Query Samples
The Samples tab lists individual query executions, newest first. Use it to see exactly what one execution was doing: who ran it, how long it took, what it waited on, and which service sent it.
- PostgreSQL: each row is a query sample from
pg_stat_activity. - MongoDB: each row is a slow operation from the database profiler.
Open it from APM → Database → Samples, or click View Query Samples on a query in Query Metrics.
PostgreSQL Samples#
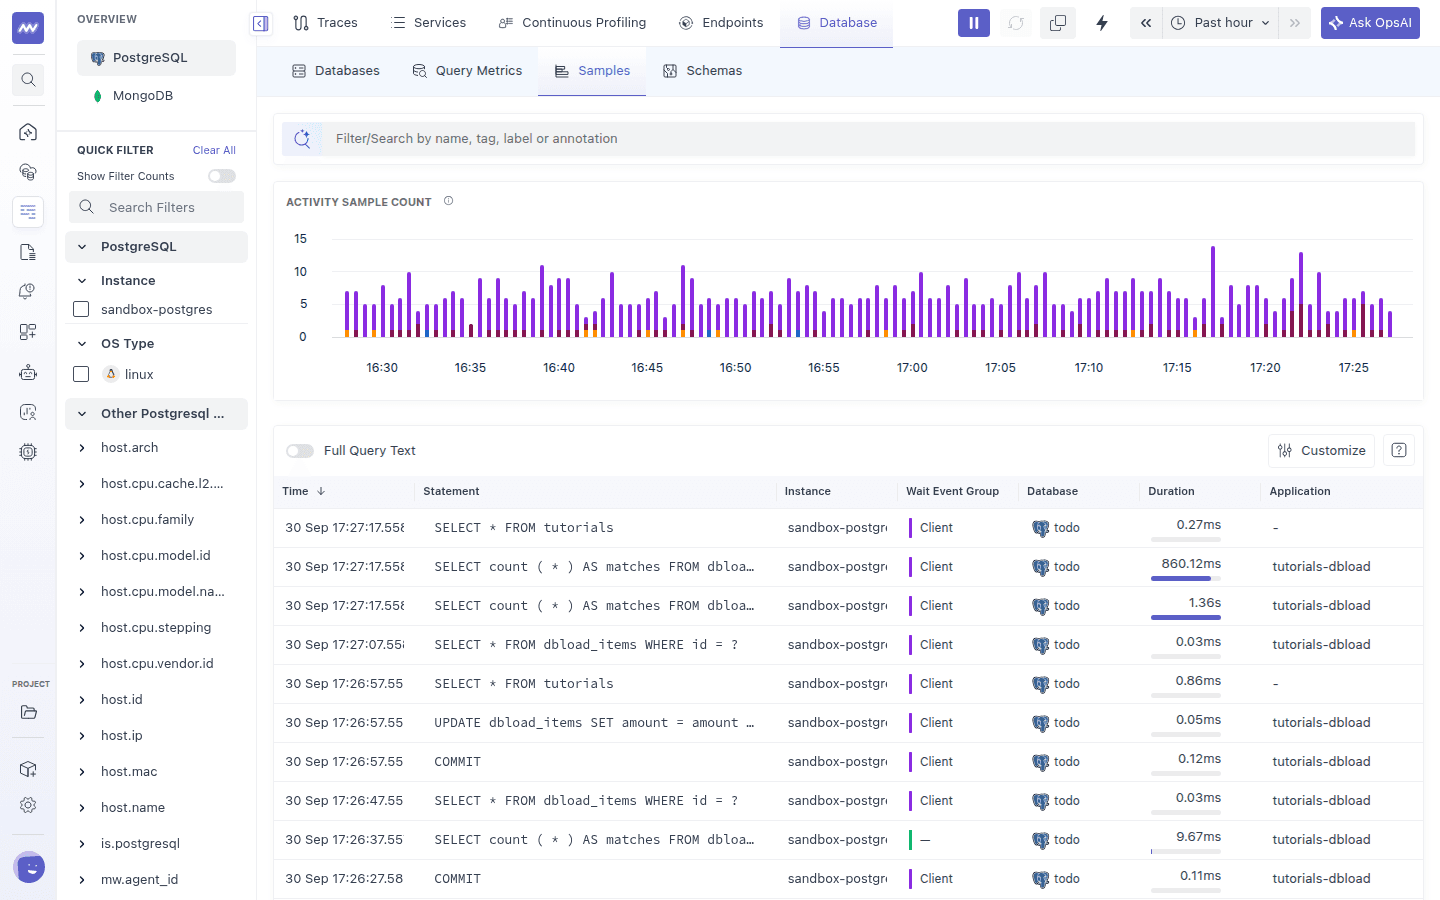
The Activity Sample Count chart shows the number of samples over time, stacked by wait event group.
Default columns:
| Column | Description |
|---|---|
| Time | When the sample was taken |
| Statement | Normalized query text |
| Instance | PostgreSQL instance |
| Wait Event Group | The wait event type at the time of the sample (— if the query was running) |
| Database | Database the session was connected to |
| Duration | Query duration recorded with the sample |
| Application | The client's application_name |
Add more columns with Customize: Calling Service, Query Start, Comment, Tables, PID, State, Backend Type, State Change, Wait Event, Blocking Pids, Service Instance ID, Trace ID, and Span ID. Turn on Full Query Text to see complete statements.
Sample Details#
Click a sample to open its details.
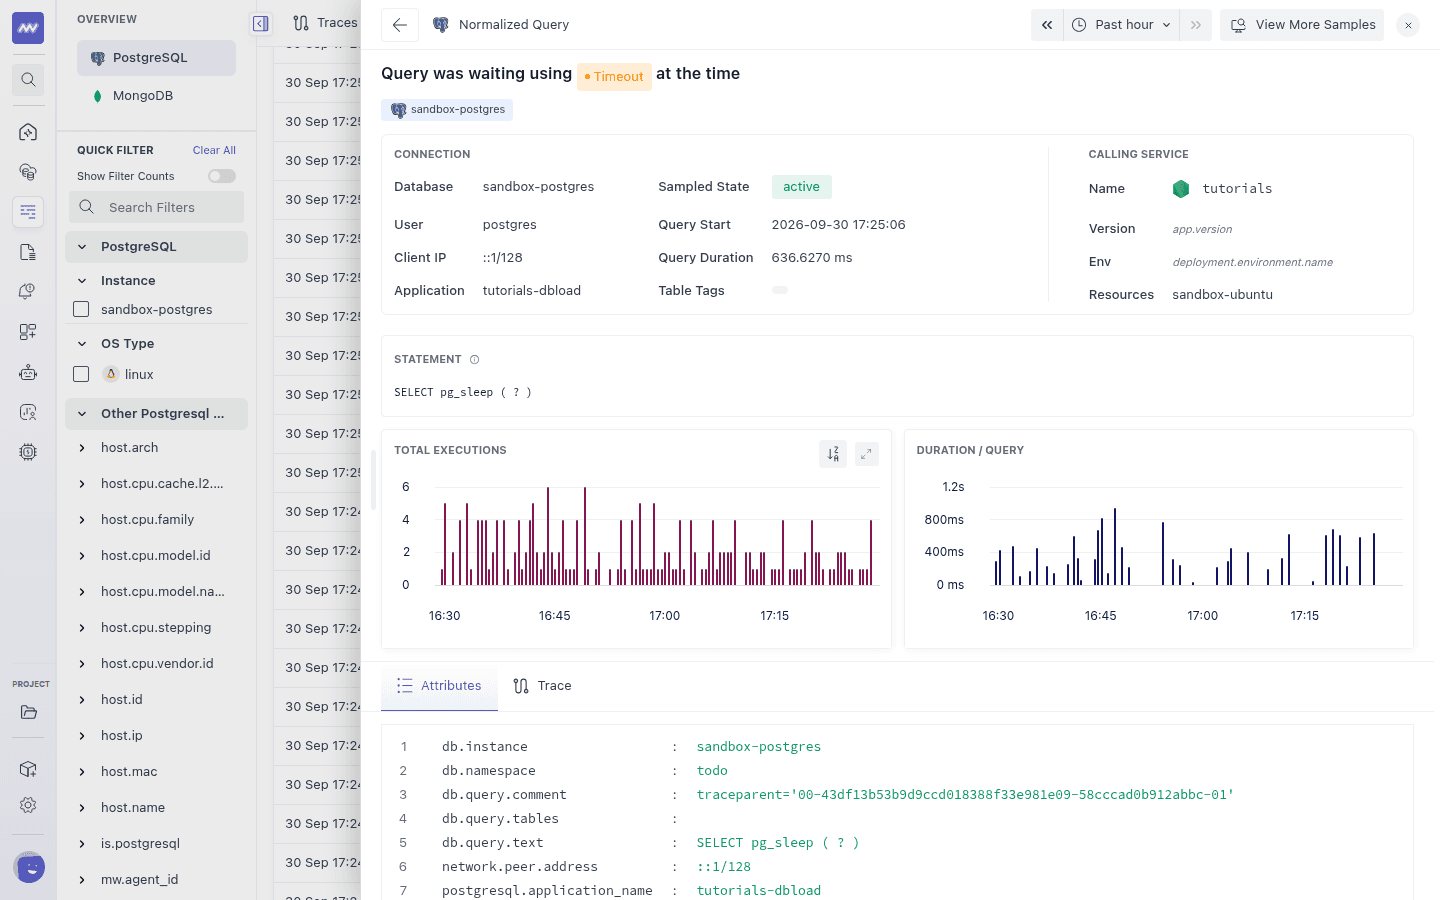
- Headline: "Query was active using …" or "Query was waiting using …", with the wait event type at the time of the sample.
- Connection: Database, User, Client IP, Application, Sampled State (for example
activeoridle in transaction), Query Start, Query Duration, and Table Tags. - Calling Service: the APM service that sent the query, with its Version, Env, and Resources. This appears when the query carries trace context. See Connect with APM Traces.
- Statement: the query text.
- Total Executions and Duration / Query charts for this query.
- Attributes: every collected field, including
db.query.comment,postgresql.pid,postgresql.state, andpostgresql.blocking_pids. - Trace: the linked APM trace, or "No Trace ID Found in the sample".
View More Samples filters the Samples tab to this instance and query.
MongoDB Samples#
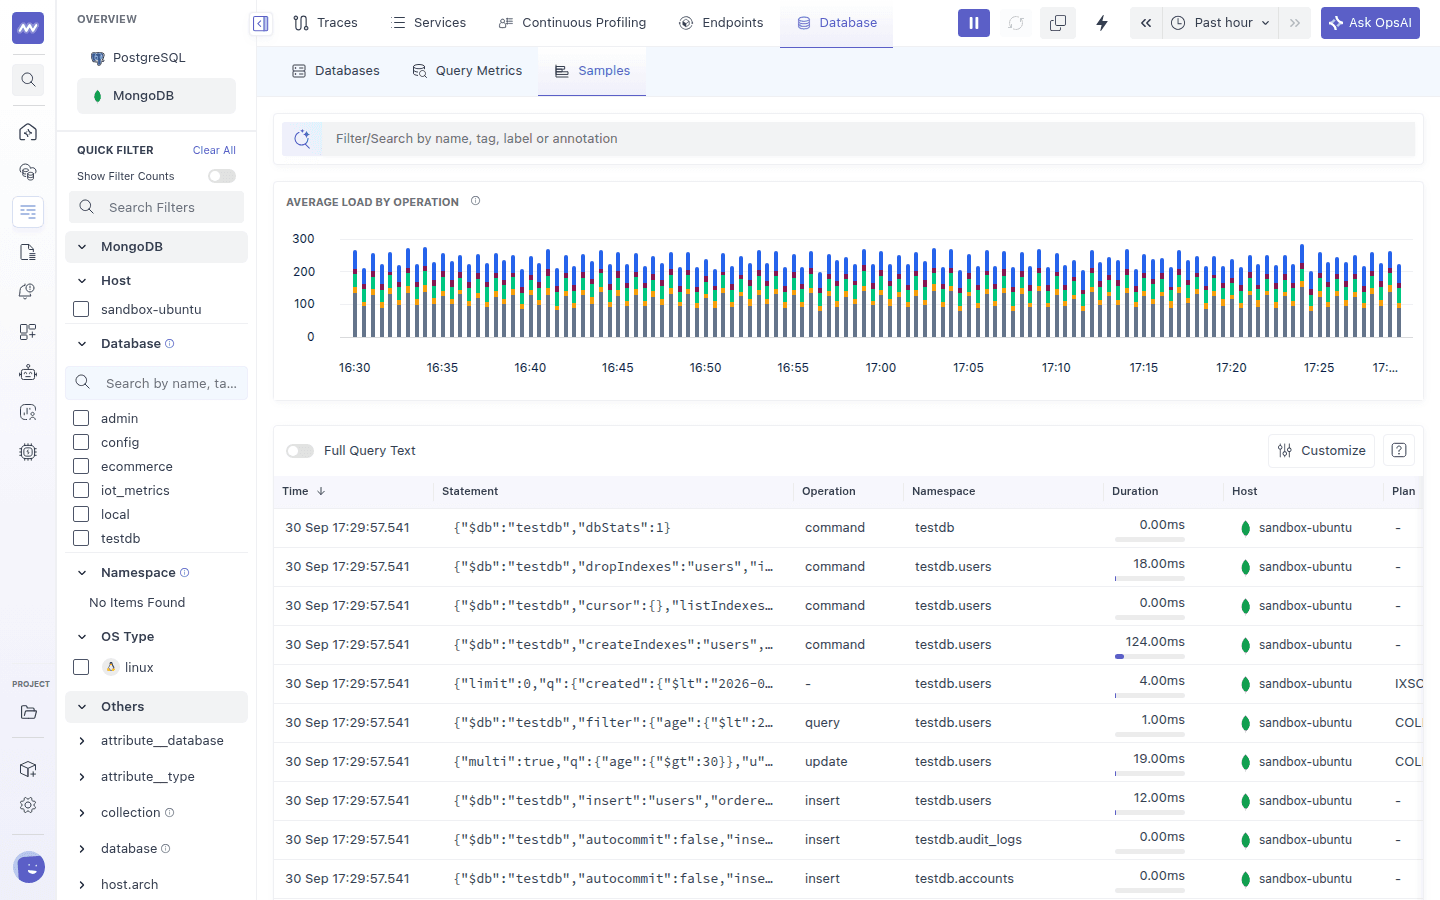
The Average load by operation chart shows the number of slow operations over time, stacked by operation type.
Default columns: Time, Statement, Operation, Namespace, Duration, Host, Plan (for example COLLSCAN or IXSCAN), Query Signature, Docs examined, Planning time, Response length, Application, and User.
Optional columns include Database, Query ID, Query hash, Query shape hash, Plan cache key, Query framework, Keys examined, Returned, Matched, Modified, Deleted, Inserted, Keys inserted, CPU time, Write conflicts, Num yields, Has sort stage, Cursor exhausted, Upsert, Used disk, Multi-planner, Replanned, Replan reason, Client, Comment, Raw query, Cursor, Lock stats, and Flow control stats.
Sample Details#
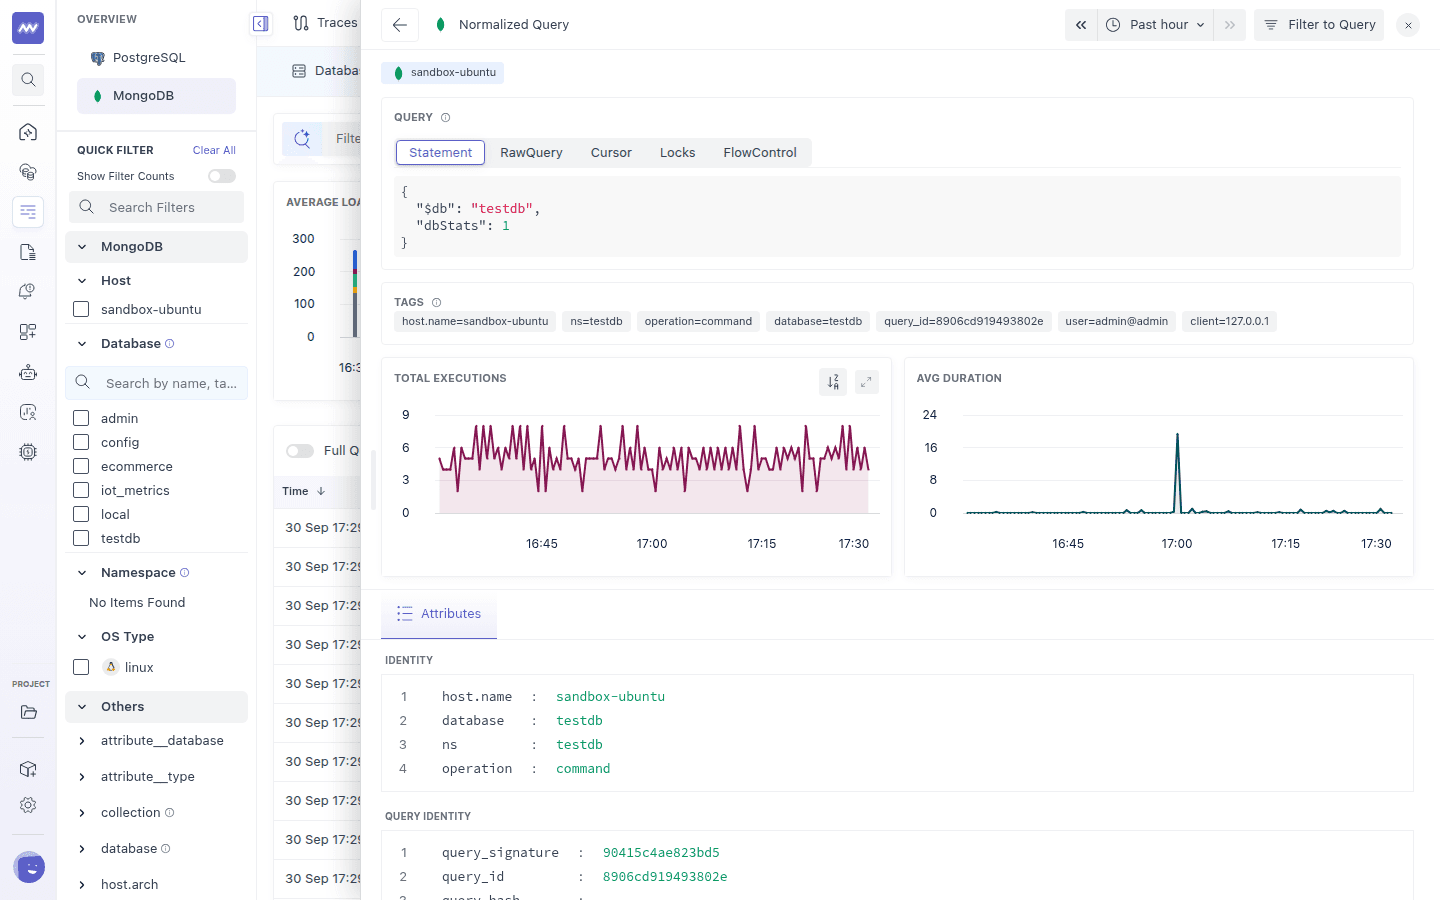
- Query: the operation in five views: Statement, RawQuery, Cursor, Locks, and FlowControl.
- Tags: host, namespace, operation, database, query ID, user, and client address.
- Total Executions and Avg Duration charts for this operation.
- Attributes, grouped into Identity, Query identity, Execution timing, Document counts, Resource usage, Execution strategy, Client, and Raw blobs.
Filter to Query filters the page to this host and query signature.
Use the Plan and Docs examined columns together. A COLLSCAN plan that examines many documents to return a few usually means the collection is missing an index.
Need assistance or want to learn more about Middleware? Get in touch with us via our Contact Us or join our Slack channel.