Performance Monitoring RUM
Use Performance Monitor to observe real‑user performance and stability across your web application. This page documents what you can do from the dashboard and how each area behaves.
Purpose#
The Performance Monitor lets you track real‑user performance and stability for your web app at a glance, then drill into outliers by page, version, environment, and error type. This section documents how the dashboard behaves, how numbers are calculated at a high level, and how to use the controls effectively.
Before You Begin#
- RUM SDK is installed in your application, so page views, resources, CWV, and errors are captured.
- Version tagging is enabled (e.g.,
app_versionor release tag) so you can attribute regressions to deployments. - ENV tagging (e.g.,
prod,staging) to compare environments side‑by‑side.
If user or page context is required in filters, ensure you set user_email, user_name, and page/route metadata when initializing the SDK.
Where to find it#
Real User Monitoring → Applications → Performance Monitor → Overview

The application header also links to Session Explorer and Error Tracking.
Data Scope & Controls#
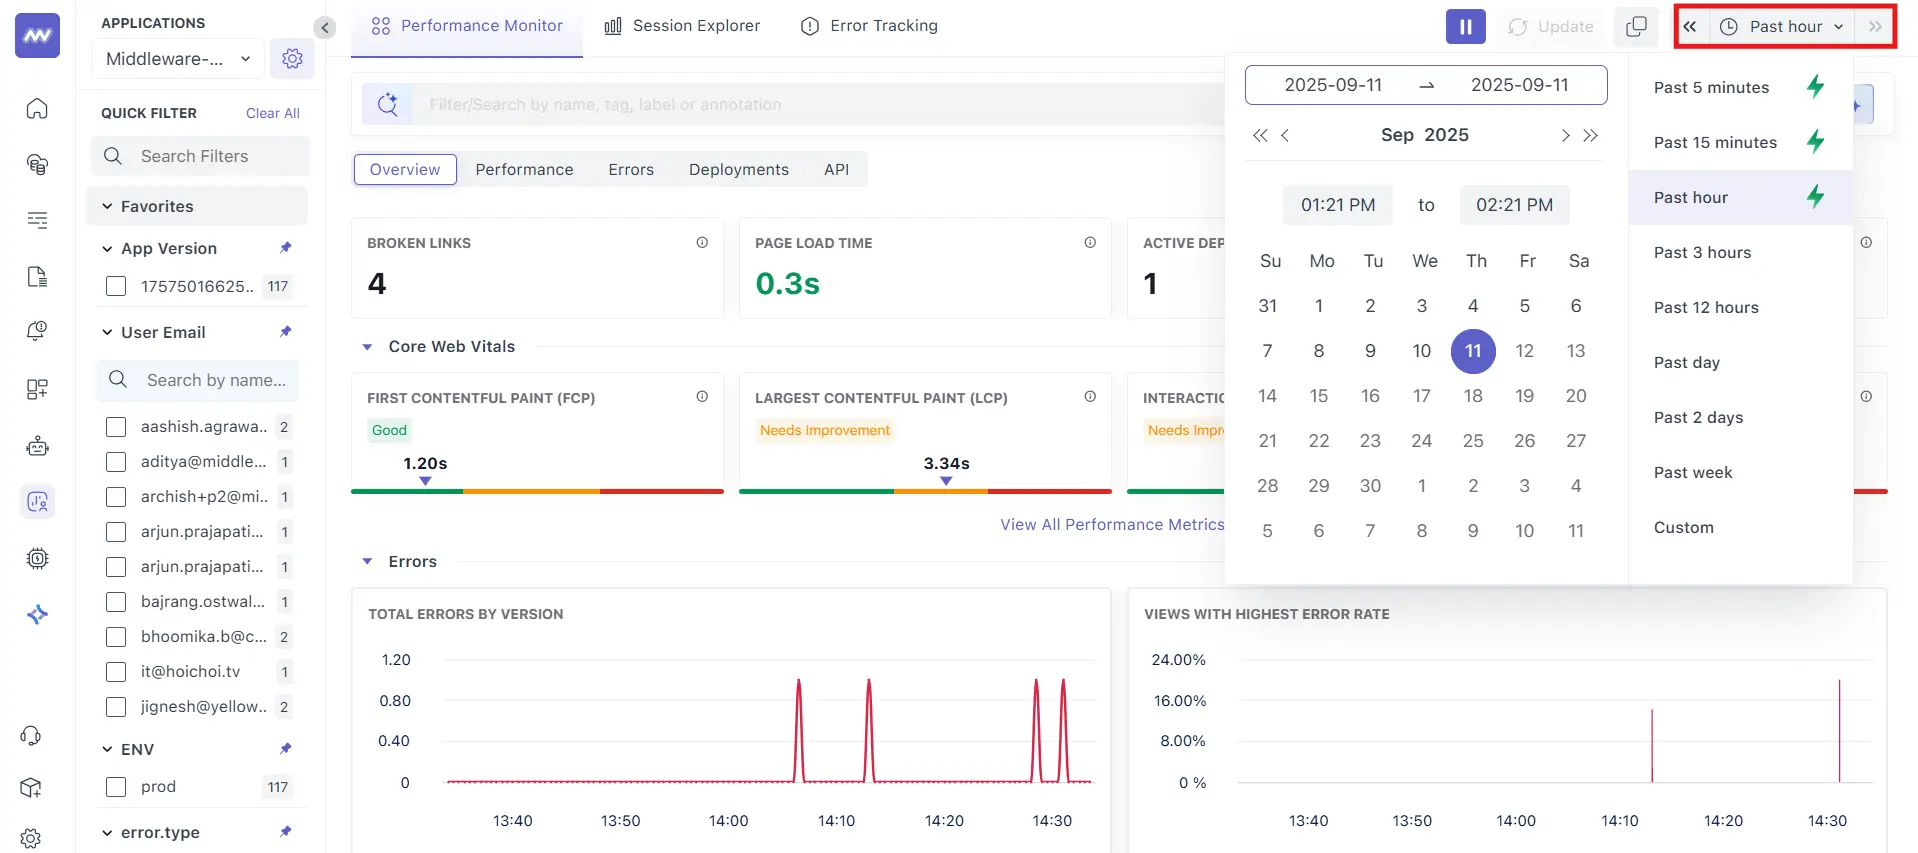
- Time range (top‑right): choose the analysis window (e.g., Past hour). Auto‑refresh is on; click Pause to freeze while you investigate.
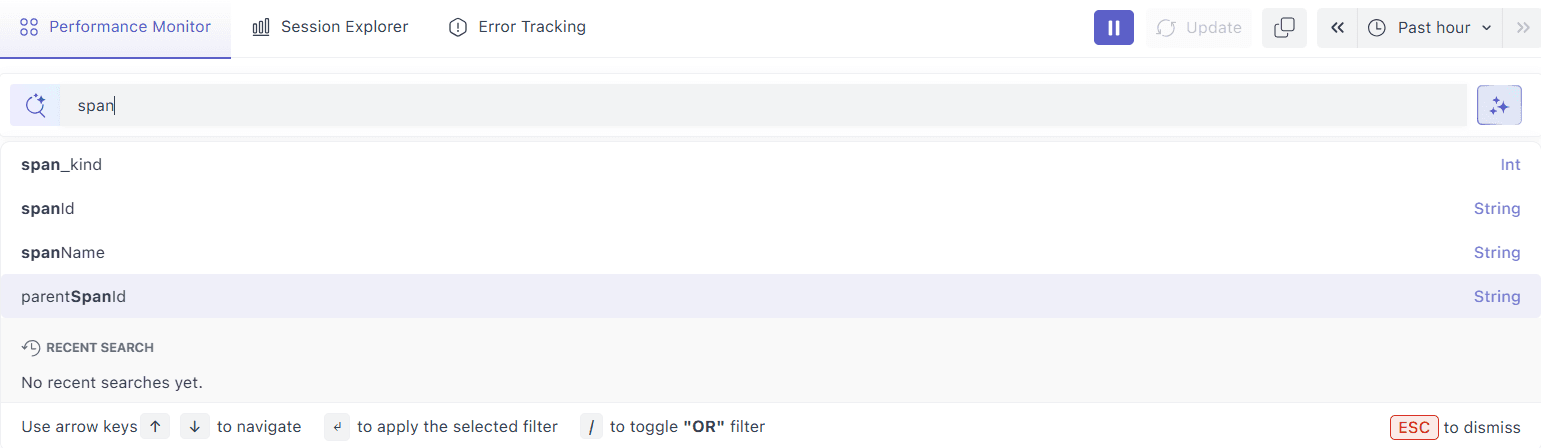
- Global search (top): Filter/Search by name, tag, label or annotation.
Left rail filters (facets):
- App Version – select one or more versions to compare or isolate a rollout.
- ENV – filter by environment (e.g.,
prod). error.type– limit to specific client‑side error categories (e.g.,documentError,uncaughtException).- Page – focus on specific routes.
- User Email / User Name – narrow to an individual user when captured.
- Quick Filter – text search across facet values to find what you need quickly.
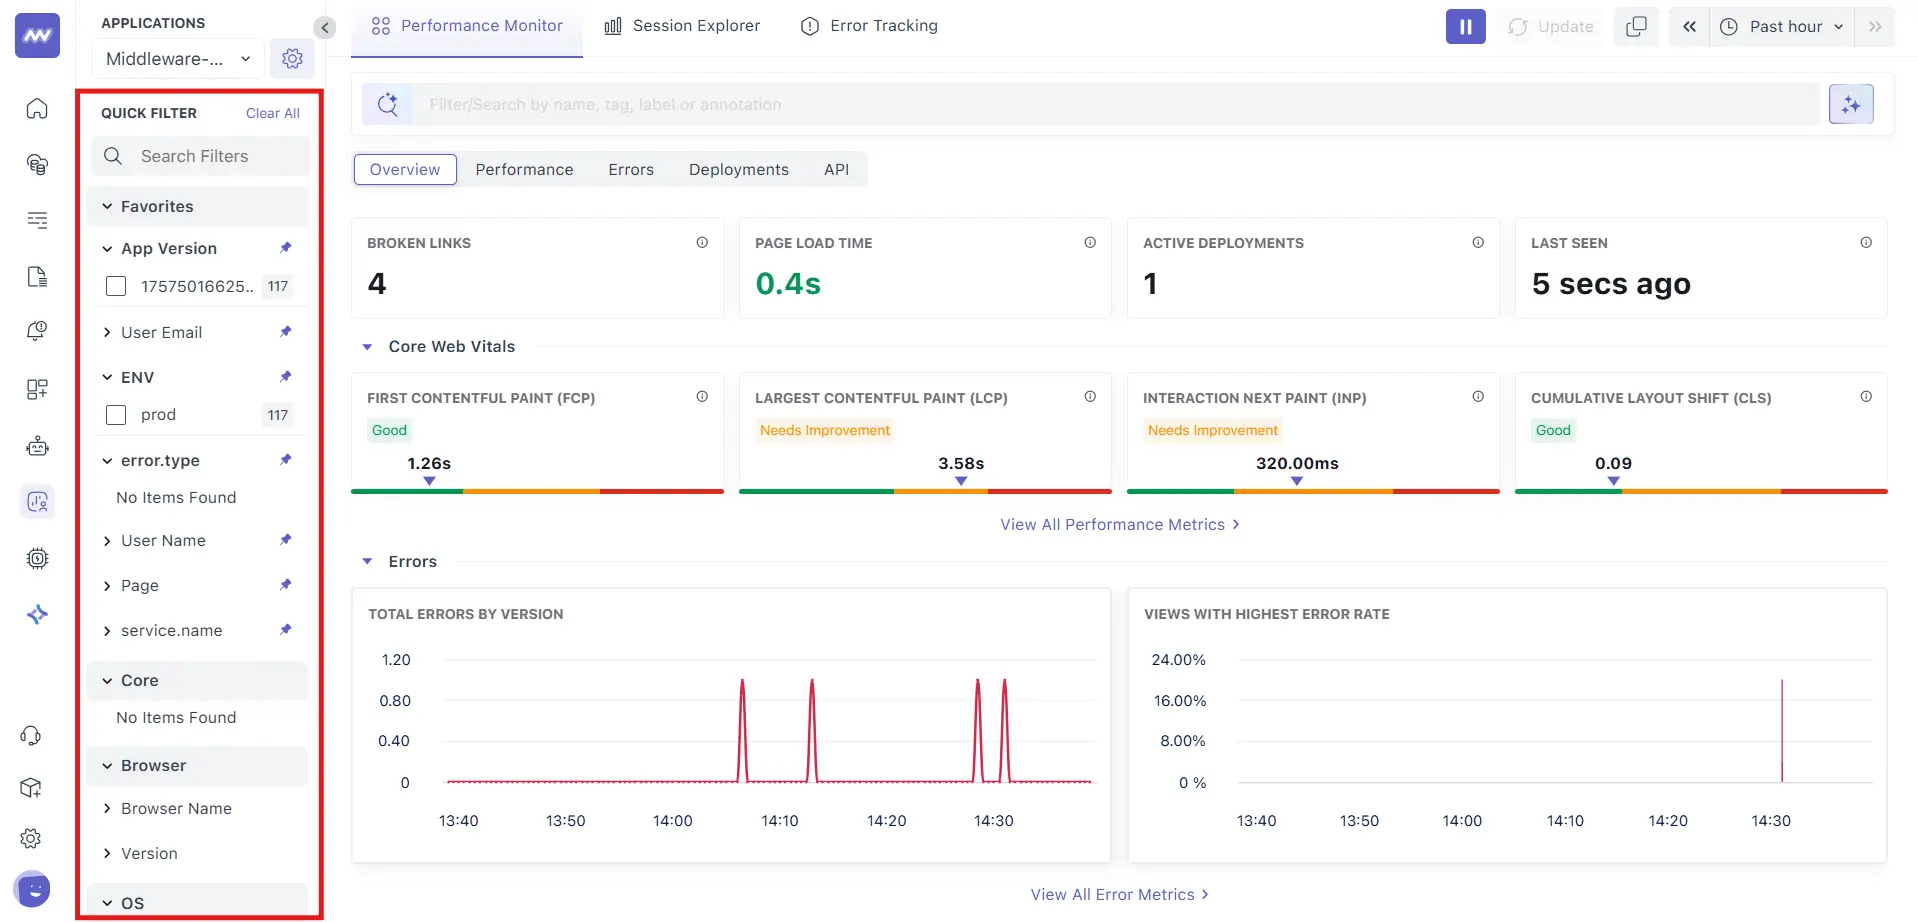
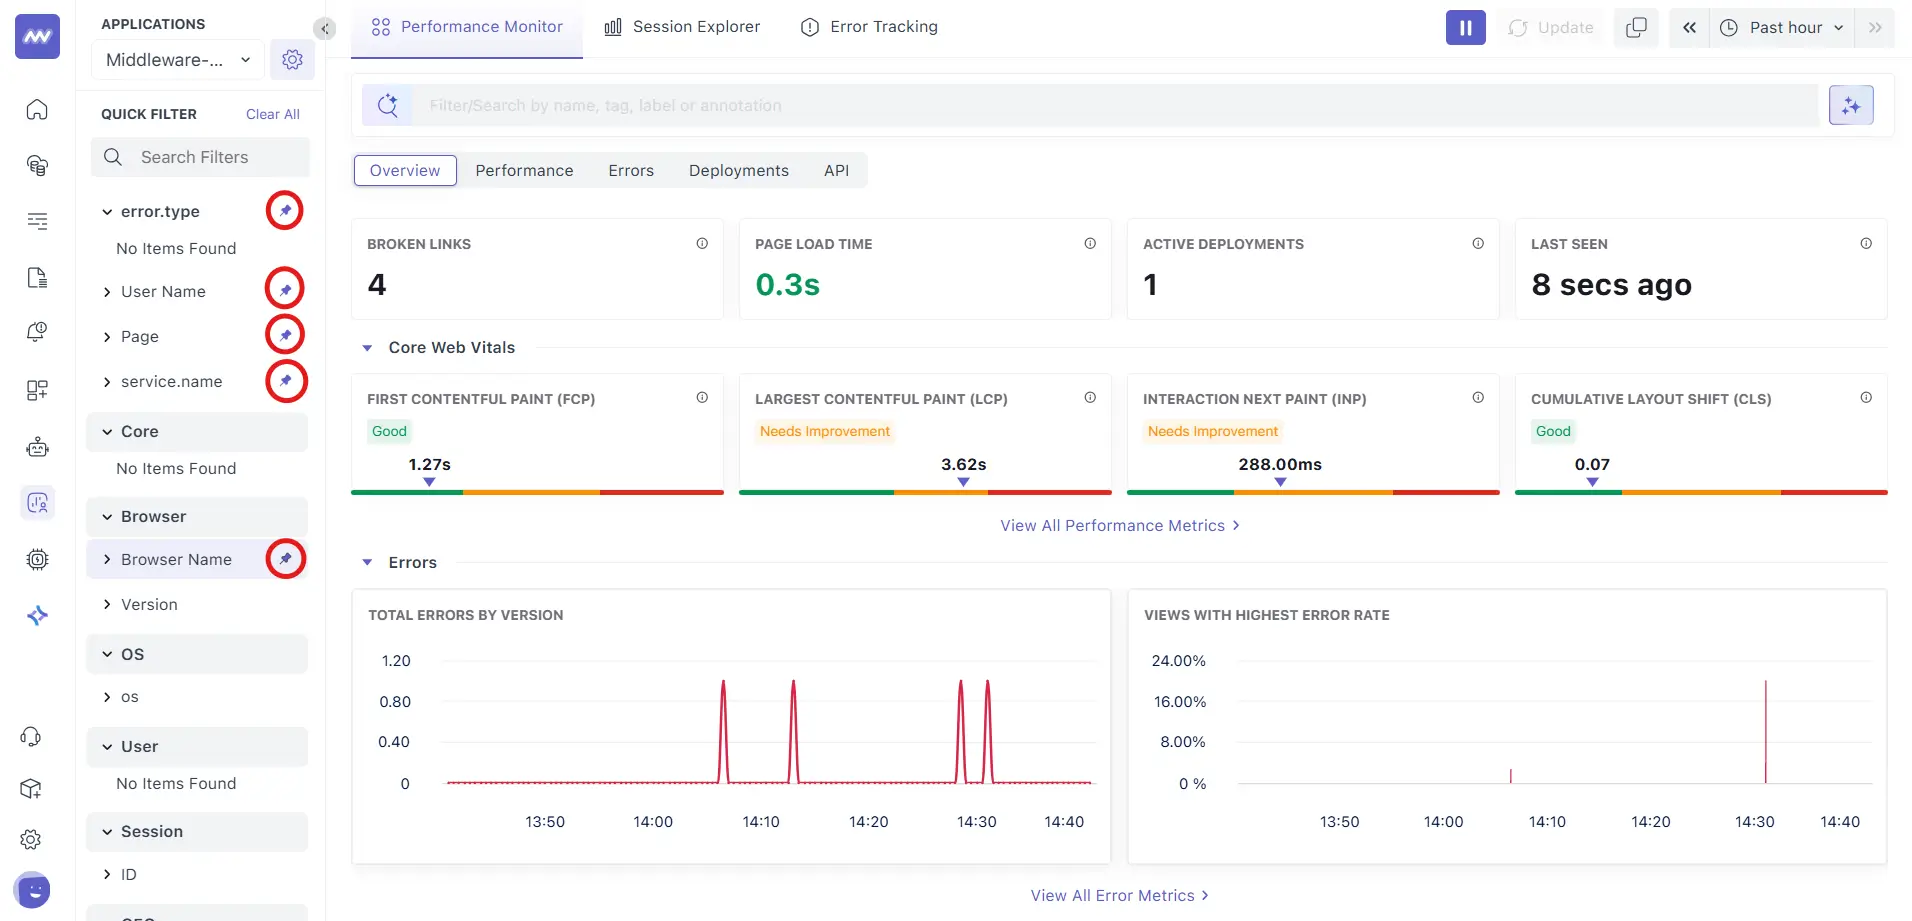
- Favorites: pin commonly used facets for quicker access later.
Tip: Start broad (24h), then narrow by ENV and App Version. Freeze the view with Pause before taking screenshots or notes.
Page Anatomy (Overview tab)#
Header & navigation#
Tabs: Overview (this page), Performance, Errors, Deployments, API. Use tabs to move between roll‑up and deep‑dive views.
Auto‑refresh & Pause: The view updates in near‑real time. Click Pause to freeze charts while you investigate; click again to resume.
Overview Tab#
A roll‑up of the most important RUM signals for the selected time range. Use this as your home base for health checks and triage.
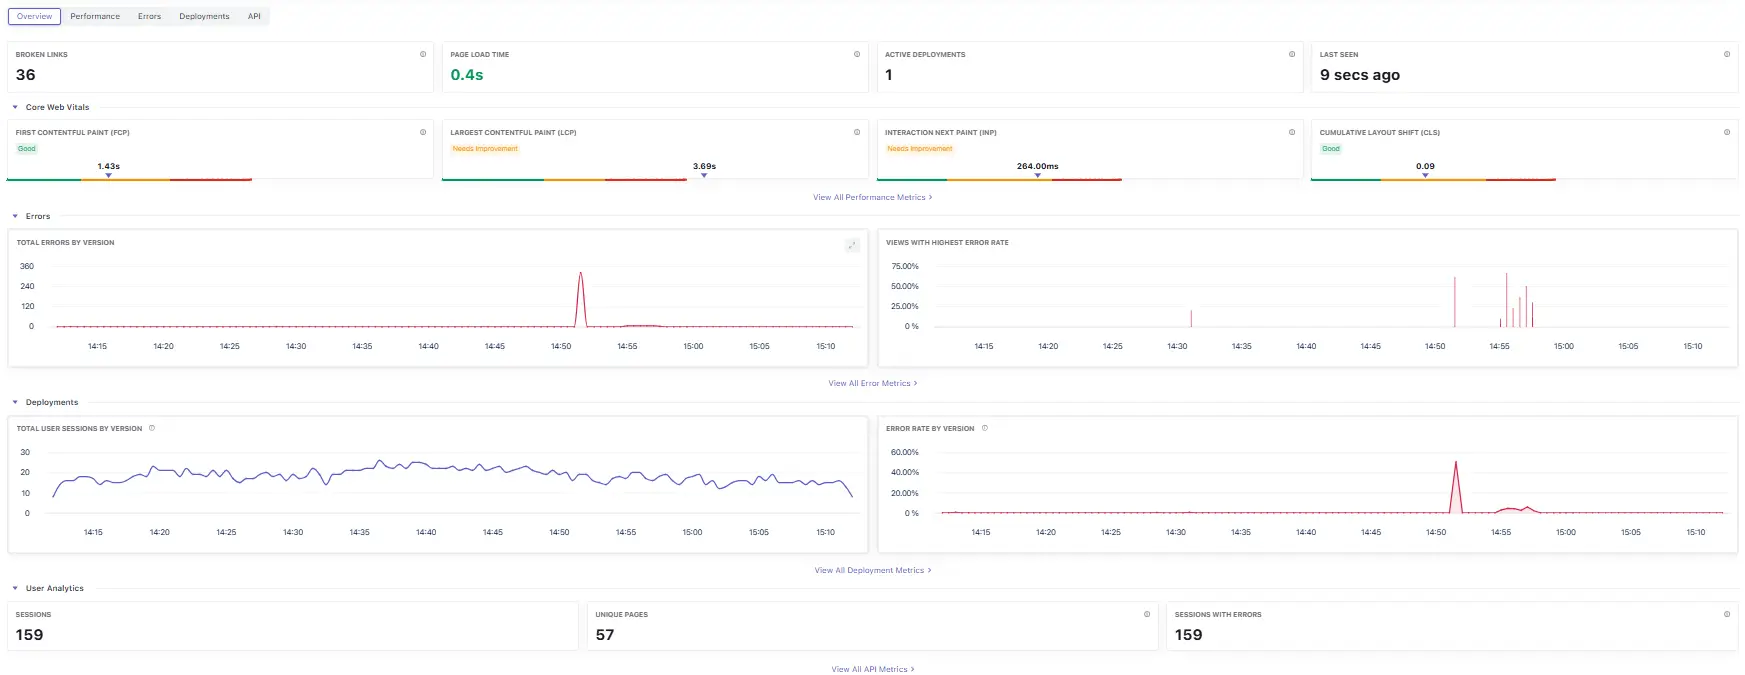
What you see
- Summary tiles: Broken Links, Page Load Time, Active Deployments, Last Seen.
- Core Web Vitals: FCP, LCP, INP, CLS with status badges. Click View All Performance Metrics for trends.
- Errors: Total Errors by Version (time‑series) and Views with Highest Error Rate (ranking).
- Deployments: Total User Sessions by Version and Error Rate by Version trend.
- User Analytics: Sessions, Unique Pages, and Sessions with Errors.
How to use it
- Release guardrail: Scan CWV and Total Errors by Version immediately after deployment; if anything regresses, pivot to Performance or Errors.
- Data sanity: Last Seen should be recent; if not, check SDK initialization and ad‑block/CSP rules.
Helpful notes:
- Version and environment comparisons rely on attributes such as
app.versionandenv. Keep them consistent across builds. - CWV statuses follow industry ranges; treat 'Needs Improvement' as an action item and investigate by page.
Performance Tab#
Analyze real‑user performance across pages and resources.
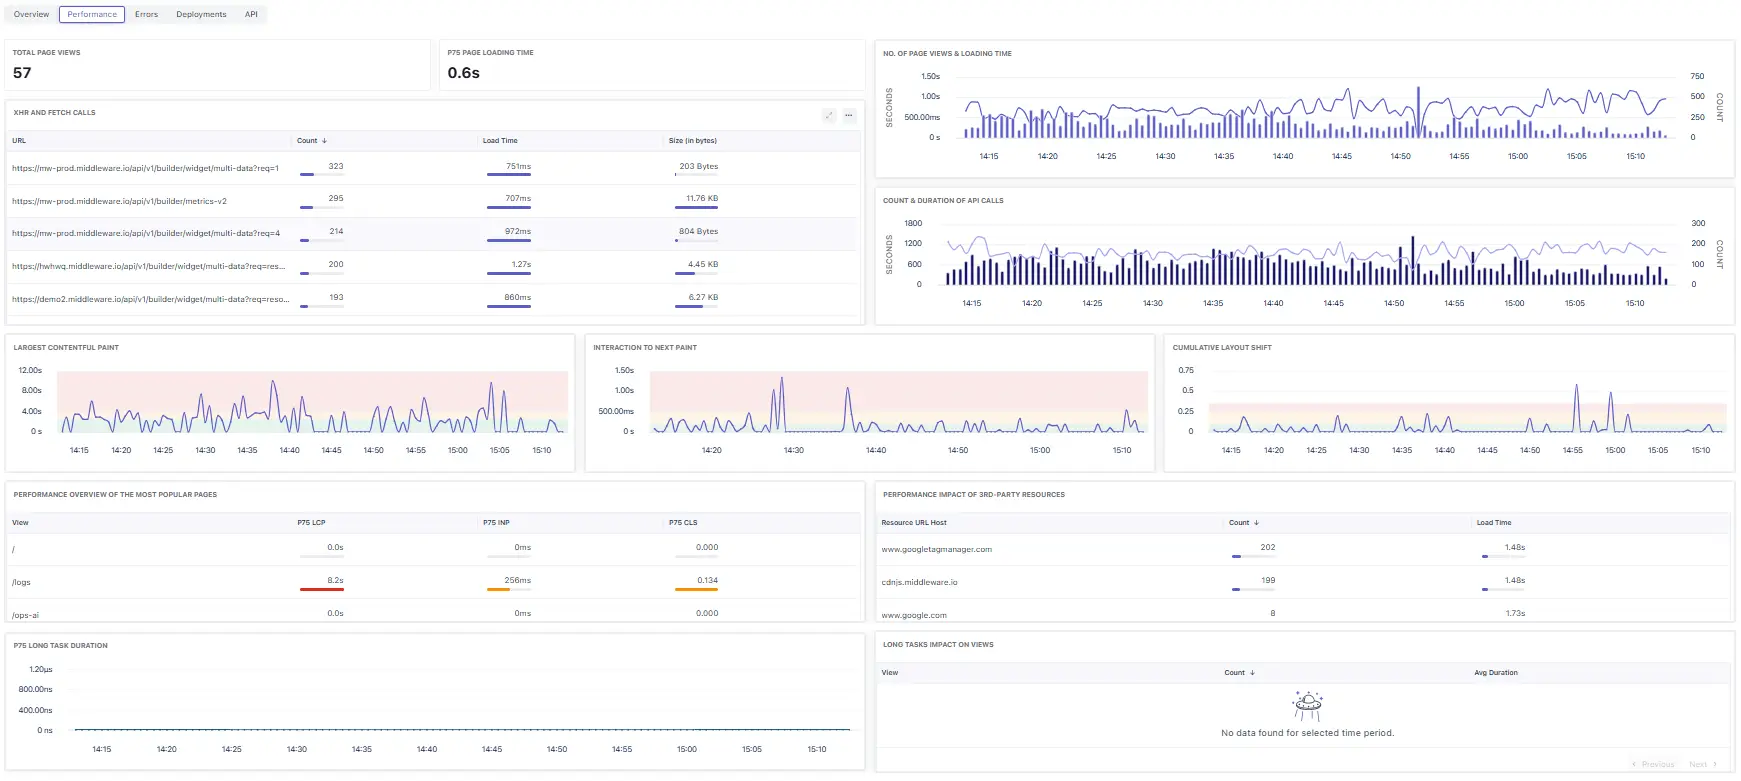
Top tiles
- Total Page Views: Count of page views in the window.
- p75 Page Loading Time: 75th‑percentile page load for the window (robust to outliers).
Key widgets
- XHR and Fetch Calls (table) – per‑URL Count, Load Time, and Size (bytes); sort by Load Time to surface slow endpoints.
- No. of Page Views & Loading Time – combined chart of traffic (bars) vs loading time (line) to spot time‑based anomalies.
- Count & Duration of API Calls – request volume and average latency.
- Largest Contentful Paint / Interaction to Next Paint / Cumulative Layout Shift – CWV time‑series for the window.
- Performance Overview of the Most Popular Pages – per‑view p75 LCP/INP/CLS; use to rank which routes need work.
- Performance Impact of 3rd‑party Resources – hosts (e.g.,
googletagmanager.com,cdnjs.middleware.io) with request Count and average Load Time. - P75 Long Task Duration – main‑thread long‑task p75 over time.
- Long Tasks Impact on Views – which routes are most affected by long tasks (empty if none detected).
A consolidated card for FCP, LCP, INP, and CLS with a status badge (Good / Needs improvement / Poor). Click View All Performance Metrics for trends and per‑page, per‑version splits.
Industry thresholds (for quick triage):
| Metric | Good | Needs Improvement | Poor |
|---|---|---|---|
| LCP | ≤ 2.5 s | 2.5–4.0 s | > 4.0 s |
| INP | ≤ 200 ms | 200–500 ms | > 500 ms |
| CLS | ≤ 0.10 | 0.10–0.25 | > 0.25 |
| FCP | ≤ 1.8 s | 1.8–3.0 s | > 3.0 s |
Tip: Pair LCP with App Version during rollouts to catch regressions early; investigate INP spikes alongside Errors for JS handler issues.
Pro tips
- Pair p75 Page Loading Time with Count & Duration of API Calls to decide whether to optimize network or rendering.
- Use 3rd‑party Resources to justify code‑splitting or async loading of external scripts.
- If Long Tasks spikes correlate with INP spikes, focus on expensive event handlers or heavy rendering.
Errors Tab#
Helps you understand stability and where users experience failures.
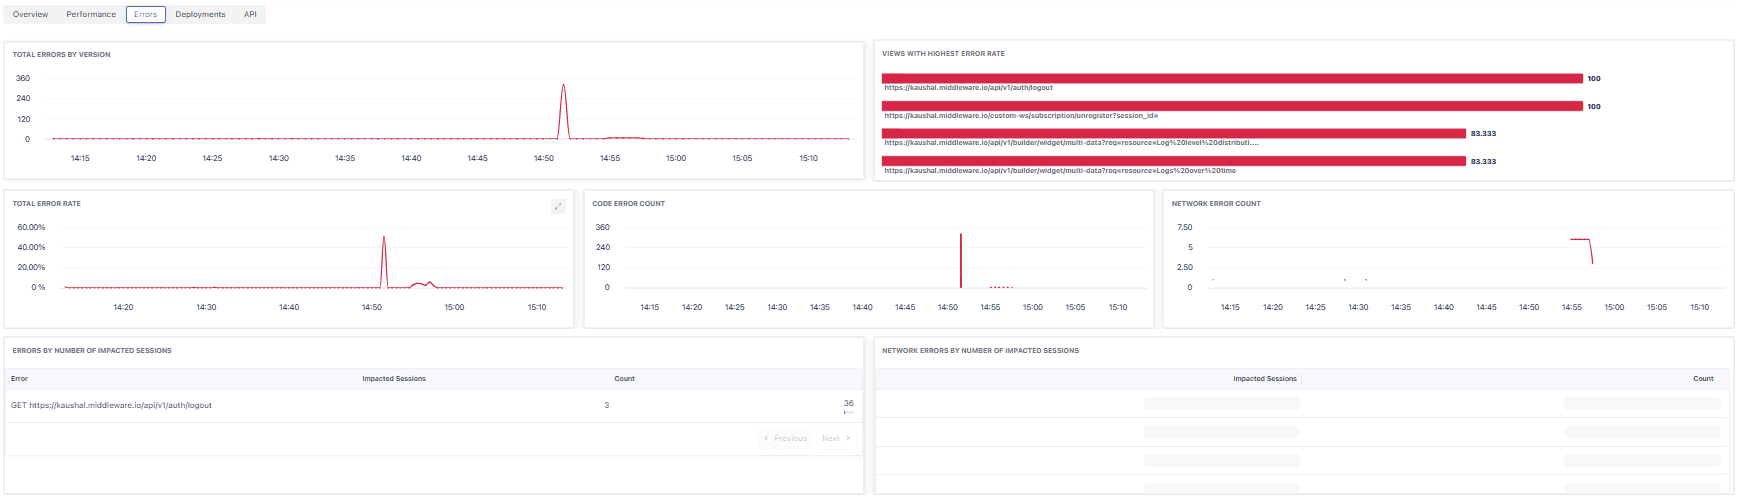
Key widgets
- Total Errors by Version: Time‑series grouped by app.version; spikes commonly align with releases.
- Total Error Rate: Percentage of views with errors over time.
- Views with Highest Error Rate: Shows the worst offending routes in the window.
- Code Error Count: Client‑side exceptions trend.
- Network Error Count: Failed XHR/Fetch trend.
- Errors by Number of Impacted Sessions: Table of error signatures with impacted sessions for prioritization (e.g., a failing auth call).
- Network Errors by Number of Impacted Sessions: Same prioritization for network failures.
Pro Tips:
- To see human‑readable stacks in production, upload source maps (CLI/webpack plugin) and ensure the uploader
appVersionmatches your RUMapp.version. - If views show 0% error rate while you’re seeing failures locally, widen the time range and confirm you’re on the same
envand version.
Deployments Tab#
Track adoption and quality by app version.
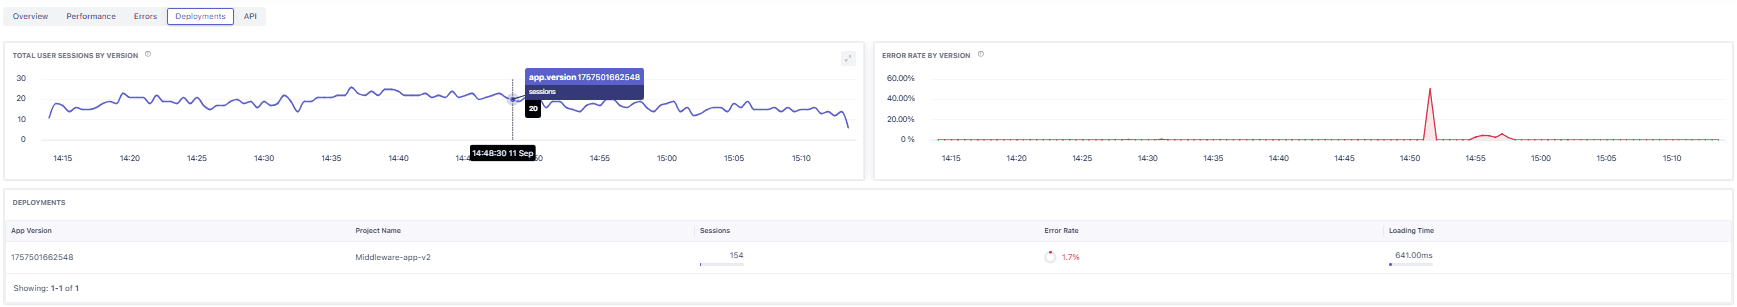
Key widgets
- Total User Sessions by Version: Traffic share per version across the window.
- Error Rate by Version: Error percentage per version (spikes imply a bad rollout).
- Deployments table: Per‑version summary with Project Name, Sessions, Error Rate, and Loading Time.
Pro tips
- During a canary, expect two active versions. Watch for sessions shifting to the new version with the error rate staying flat.
- If Loading Time regresses only on the new version, pivot back to Performance → Popular Pages to see which routes moved.
API Tab#
Deep‑dive into resource/network performance captured from real users.
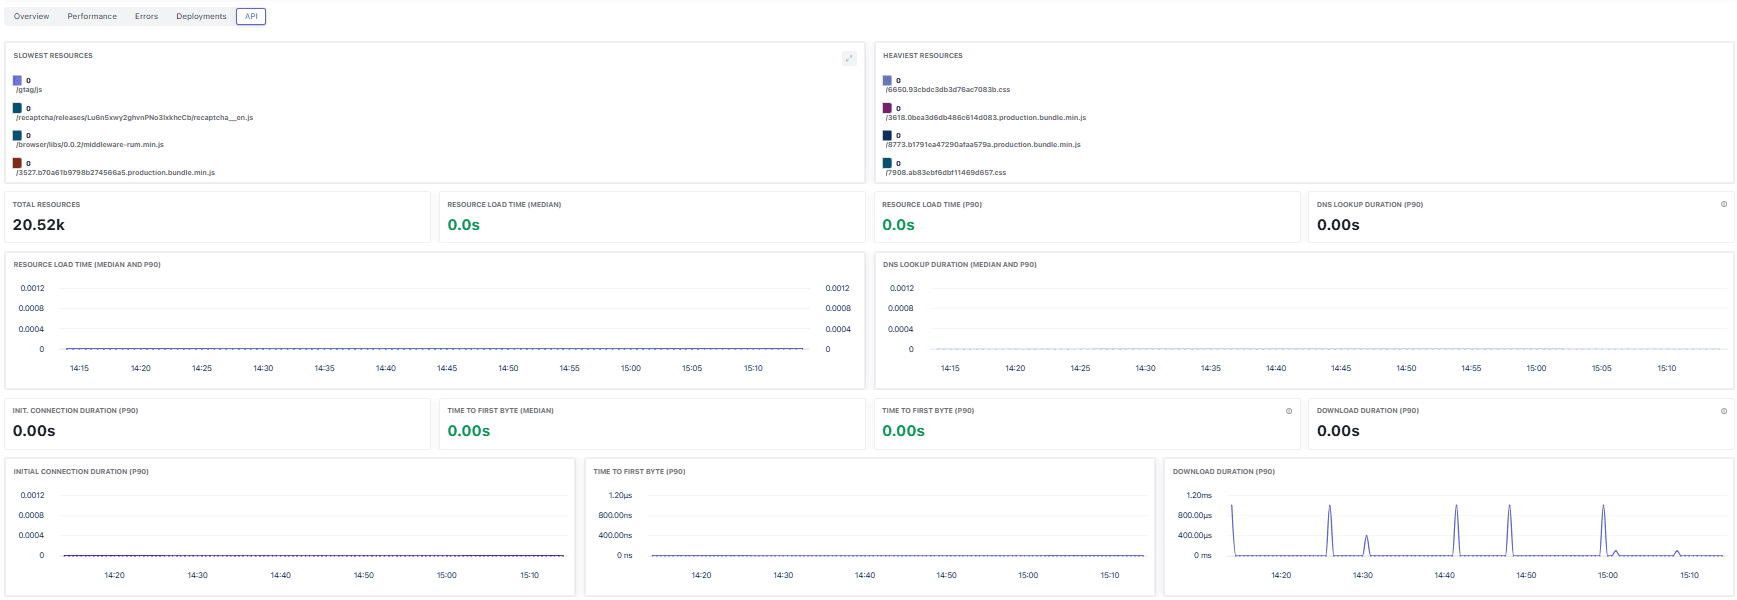
Key widgets
- Slowest Resources: Slow URLs (e.g.,
/gtag/js,recaptcha, app bundles). - Heaviest Resources: Largest assets (JS/CSS bundles) by size.
- Total Resources: Total fetched resources during the window.
- Resource Load Time (median / p90): Overall resource latency distribution.
- DNS Lookup Duration (median / p90): DNS resolution latency.
- Init. Connection Duration (p90): Time spent establishing connections.
- Time to First Byte (median / p90): Backend responsiveness from the browser’s perspective.
- Download Duration (p90): Payload transfer time; spikes usually indicate large responses or constrained bandwidth.
Field mapping to the Middleware data model
- Timings map to Resource Timing Metrics such as
resource_duration_median,resource_duration_p90,resource_first_byte_duration_*,resource_dns_duration_*,resource_connect_duration_p90,resource_download_duration_p90. - Attributes like
resource.url_host,resource.url_path,resource.type, andresource.status_codehelps you group by host/path and separate first‑party vs third‑party.
Pro tips
- Use Heaviest Resources to pick candidates for compression, lazy loading, or code‑splitting.
If Time to First Byte rises but Download stays flat, investigate server latency; if Download rises, investigate payload size/caching.
Release Validation Checklist (Middleware)#
- Confirm Active Deployments reflects the expected versions.
- Filter to the new App Version; compare LCP/INP/CLS against the prior version.
- Scan Total Errors by Version for spikes near the rollout minute.
- Check Broken Links after router or content changes.
- Clear filters and verify Last Seen stays fresh.
Troubleshooting (no/low data)#
- Last Seen is old → verify SDK init order, CSP headers, and that ad‑blockers aren’t stripping the beacon endpoint.
- Active Deployments = 0/1 when multiple expected → ensure you set
app_versionat init and that your build pipeline embeds the correct value. - Filters show zero results → widen the Time range (e.g., 24h) and remove restrictive facets.
Common Workflows#
Validate a deployment#
- Set the Time range to the rollout window and click Pause.
- In App Version, select the new version (and optionally the previous).
- Compare Summary tiles and Core Web Vitals; look for regressions.
- Inspect Total Errors by Version; click the spike to open detailed error groups and affected pages.
- Re‑enable Auto‑refresh and watch for stabilization.
Investigate slow or unstable pages#
- Open View All Performance Metrics.
- Group by Page and sort by LCP/INP/CLS.
- Add ENV and App Version filters to isolate conditions.
- Pivot to Errors for the same page/time to correlate exceptions.
- Track changes after a fix by pinning the page to Favorites.
Triage Broken Links#
- Use the Broken Links tile as the entry.
- Filter by Page and App Version to find the source route.
- After fixes land, watch the count trend toward zero across the next release window.
Notes#
- Narrow the Time range when validating hotfixes; broaden to Past 24 hours for trend context.
- During phased rollouts, you’ll see multiple Active Deployments; always filter by
app_versionwhen comparing. - If charts appear flat at zero, broaden the window or switch to a higher‑traffic environment (e.g.,
prod). - Keep
app_version,env, and route information consistent across builds for clean comparisons.
Need assistance or want to learn more about Middleware? Contact our support team at [email protected] or join our Slack channel.