Monitor-based SLOs
A Service Level Objective (SLO) is a target for how reliable a service should be over a period of time, such as "the checkout API is up 99.9% of the time over 30 days". Monitor-based SLOs build that target on alerts you already have: the SLO is up while its alerts are not firing and down while any of them is critical. The Service Level Indicator (SLI) is the share of the time window spent up.
Key terms#
| Term | Meaning |
|---|---|
| Service Level Indicator (SLI) | A quantitative measurement of a service's reliability. For a monitor-based SLO the SLI is the percentage of the time window during which the SLO's alerts were not in the Critical state. |
| Service Level Objective (SLO) | A target percentage for the SLI over a specific period of time, for example 99.9% over 30 days. |
| Target | The minimum SLI the SLO commits to. It must be strictly below 100%. |
| Time window | The rolling period the SLI is measured over: the past 7, 30 or 90 days ending now. Every SLO has a primary window, and additional windows can carry their own targets. |
| Status | The current SLI over the time window, shown against the target. It is OK at or above the target, Warning between the warning level and the target, and Breached below the target. |
| Warning level | An optional threshold above the target. When the status falls below it, the SLO is marked as Warning so that action can be taken before the target is missed. |
| Error budget | The allowed amount of unreliability derived from the target: 100% minus the target, applied to the time window. For a 99.9% target over 30 days the error budget is 43 minutes and 12 seconds of downtime. |
| Error budget remaining | The share of the error budget not yet consumed: 100 × (status − target) ÷ (100 − target). It is 100% when there has been no downtime, 0% when the budget is exactly spent, and negative when the target can no longer be met within the window. |
| Burn rate | How quickly the error budget is being consumed relative to the pace the target allows: (downtime ÷ counted time) ÷ (100% − target). A burn rate of 1 consumes the whole budget exactly over the window; a burn rate of 10 consumes it ten times faster. |
| Status correction | A period of time excluded from the status and error budget calculations, such as a planned maintenance window or a known false alert. |
Prerequisites#
- At least one alert rule. Any rule type can be used (Metrics, Host, Logs, APM, RUM, LLM, Billing, Anomaly, Forecast, Error Tracking) except SLO alerts themselves.
- The View alert history permission to see SLOs and the Create new alerts permission to create, edit or delete them.
An SLO only counts the alert's state. Muting an alert does not affect the SLO calculation. To exclude a known incident or a maintenance window, add a status correction.
Create an SLO#
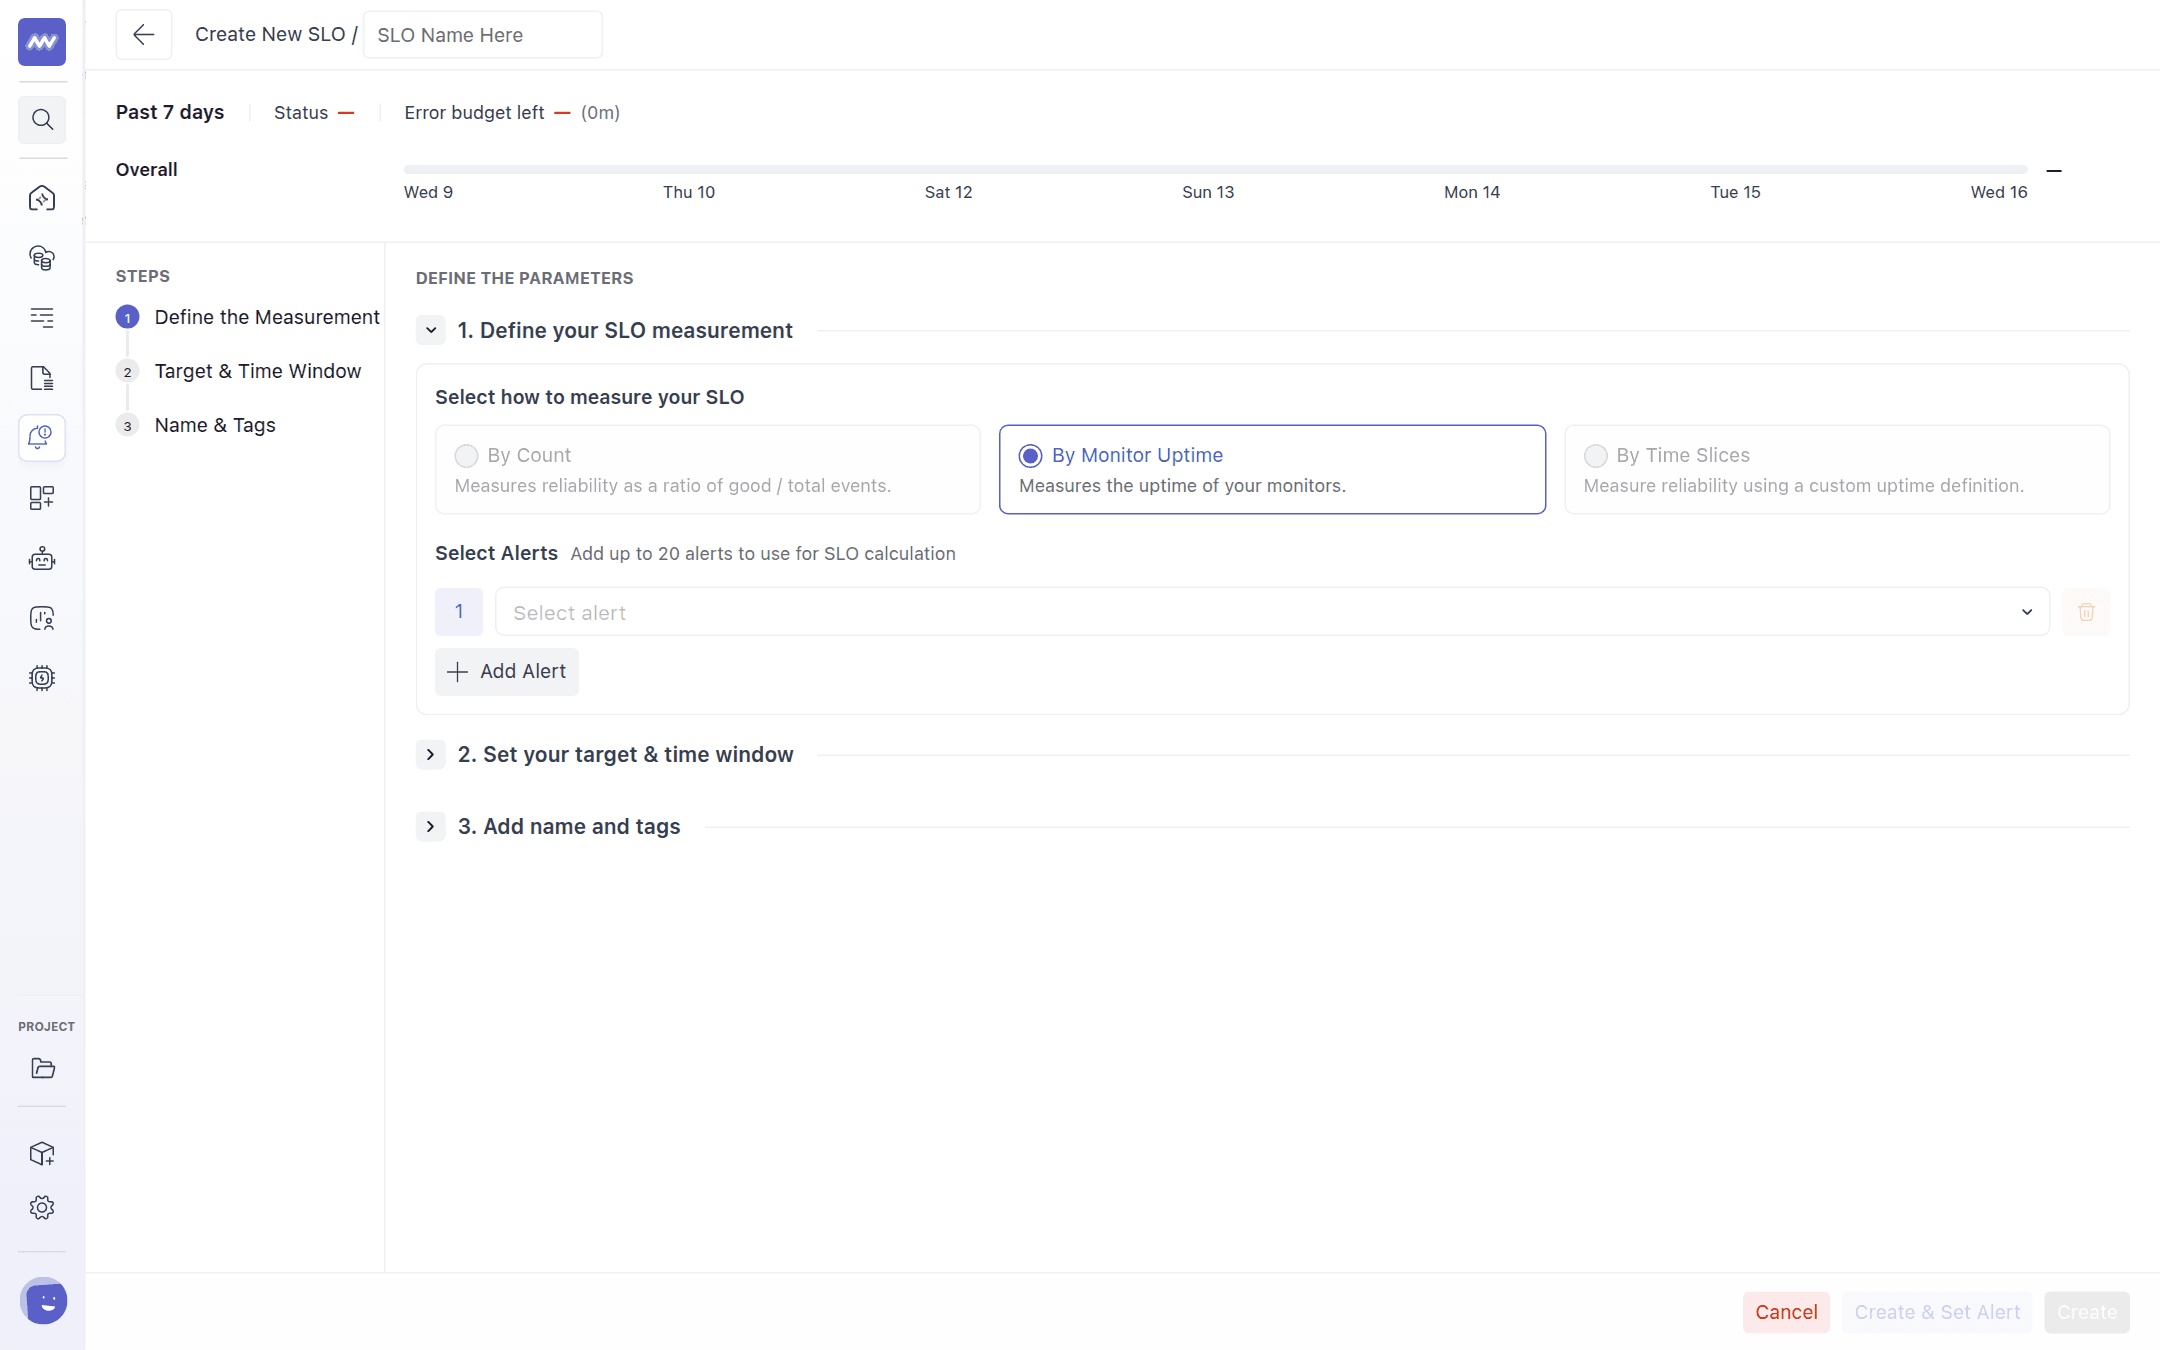
In the left navigation open Alerts, switch to the SLO List tab and click + New SLO.
1. Define your SLO measurement#
Choose By Monitor Uptime and select the alerts the SLO should track. You can add up to 20 alerts. The preview at the top of the page shows the uptime of the selected alerts over the last 7 days as you build the SLO.
Alerts with a very large number of alert groups (more than 1,000, for example one group per pod or per request path) cannot be added to an SLO.
2. Set your target and time window#
Pick the time window the SLO is measured over: a rolling 7, 30 or 90 days ending now. Then set the target, the percentage of that window during which the alerts must not be critical. Optionally set a warning level above the target.
| Time window | Target precision | Example: 99.9% target |
|---|---|---|
| 7 days | two decimals | 10 min 5 s of error budget |
| 30 days | two decimals | 43 min 12 s of error budget |
| 90 days | three decimals | 2 h 9 min 36 s of error budget |
The status shown in the list follows the first threshold you define (the primary window):
- OK (green): the SLI is at or above the target.
- Warning (yellow): the SLI is below the warning level but still above the target.
- Breached (red): the SLI is below the target.
- No data: no alert in the SLO has any data yet.
3. Add name and tags#
Give the SLO a name, an optional description and tags. Tags are shared with your other SLOs and appear as filters in the SLO list.
Click Create to save the SLO, or Create & Set Alert to save it and go straight to the alert wizard with this SLO preselected, so you can be notified when its error budget runs low.
The SLO list#
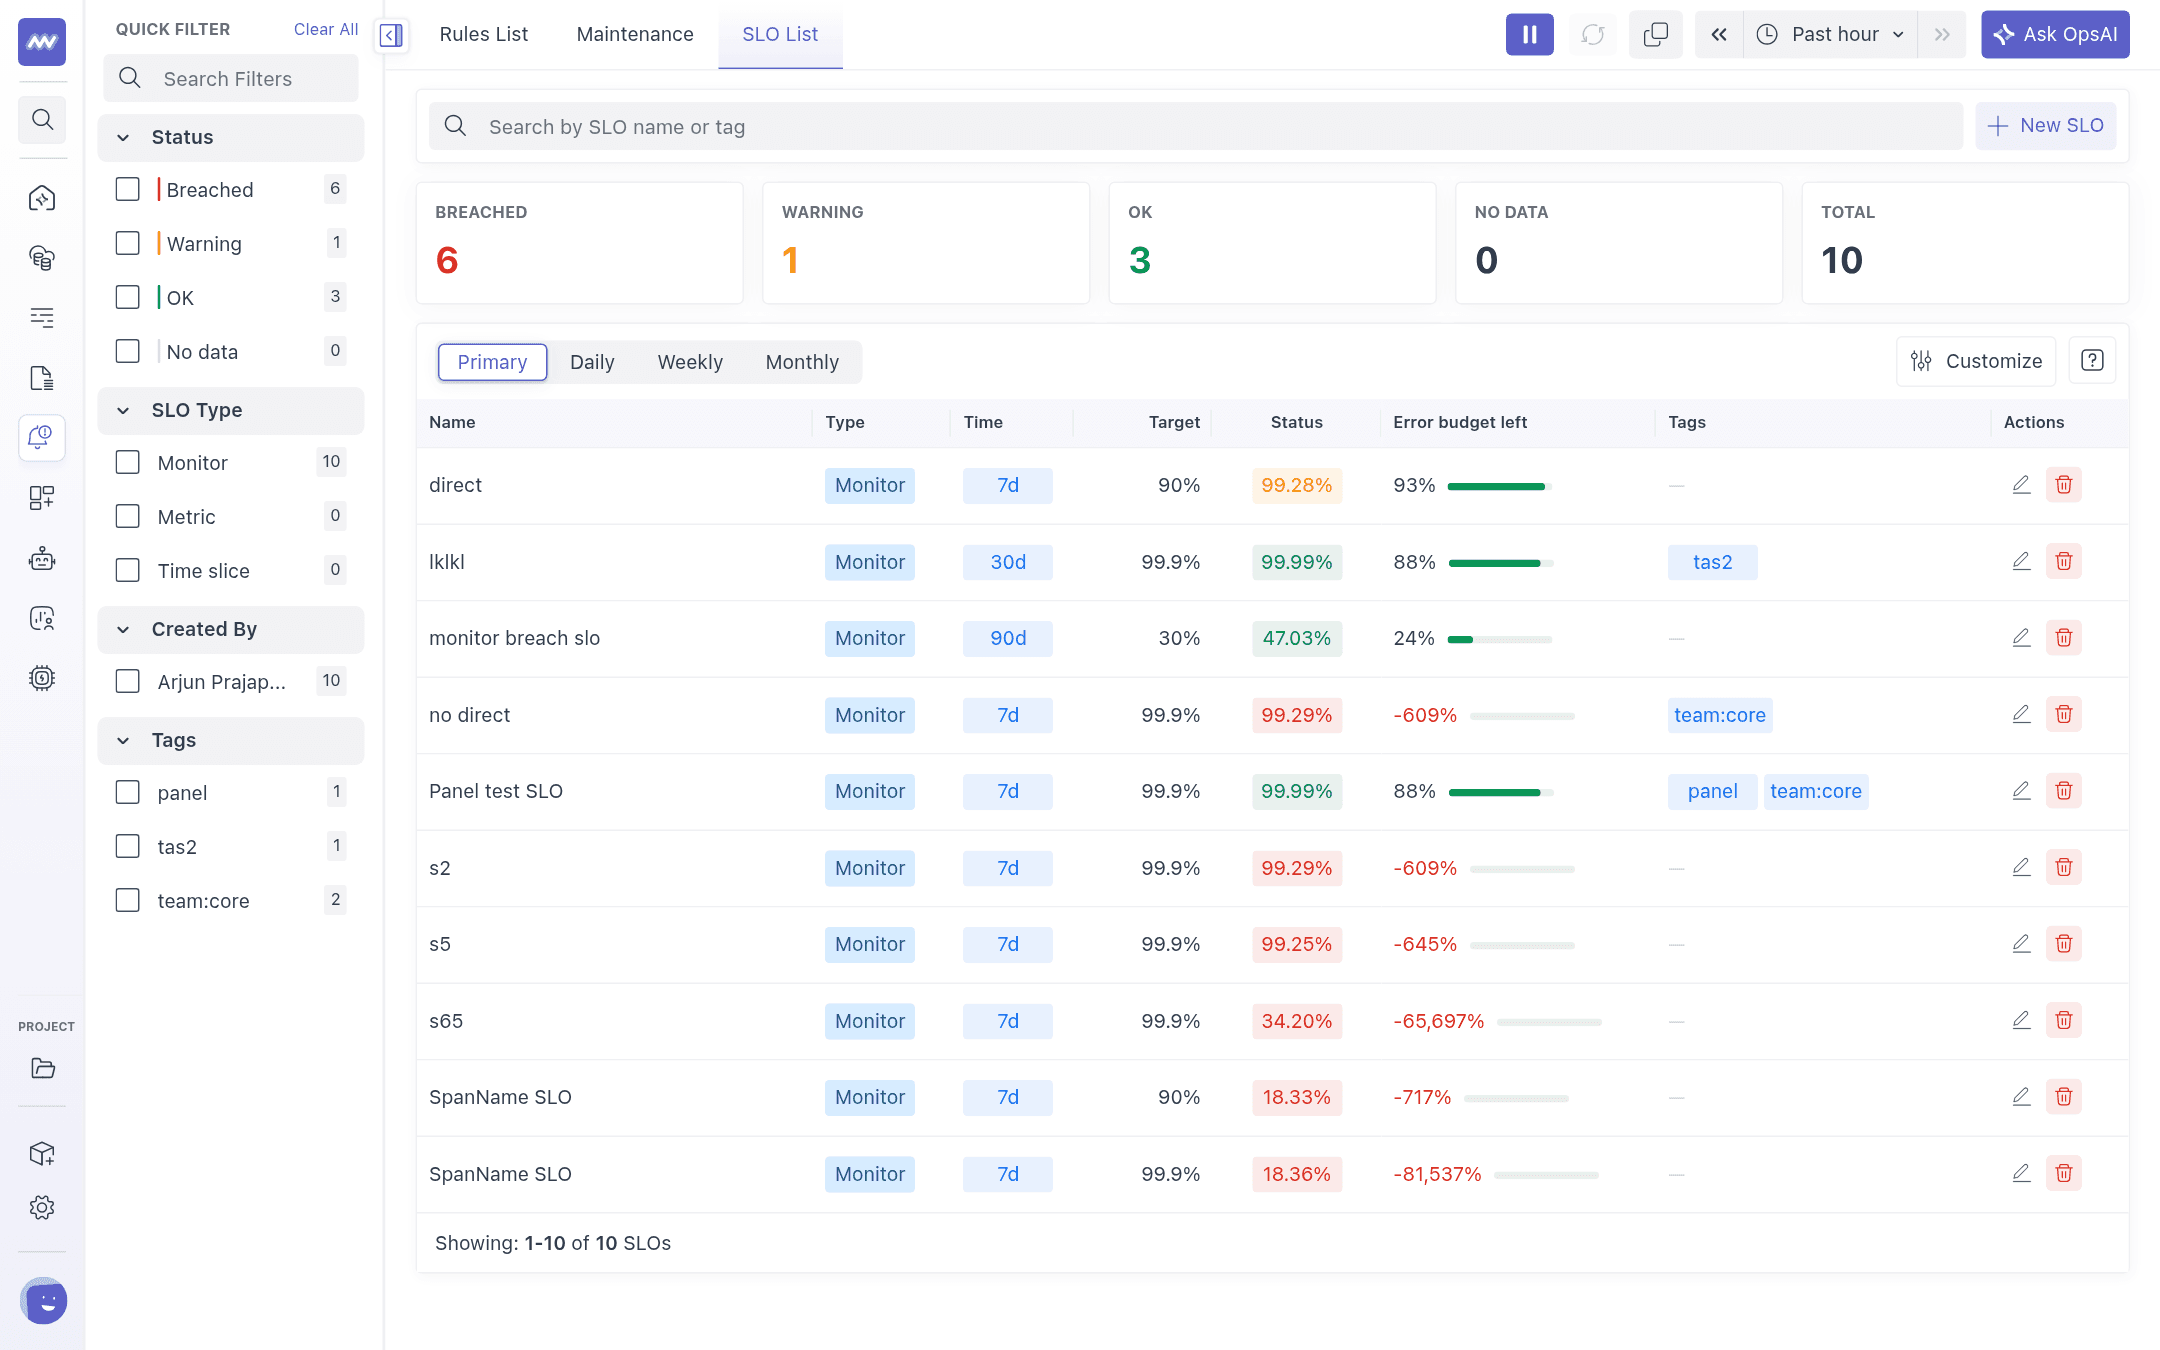
The SLO List shows every SLO of the project with its type, primary window, target, current status and remaining error budget.
- The summary cards count SLOs by state. Click a card to filter the list to that state; you can select several.
- The quick filter sidebar filters by status, SLO type, creator and tag, and the search box matches SLO names and tags.
- Primary shows the status over each SLO's primary window. Daily, Weekly and Monthly replace the status columns with one column per calendar period so you can compare recent periods; use the arrows in the header to page through older periods.
- Customize lets you show or hide columns, including Created By and Created At.
- The pencil and bin icons edit or delete an SLO. An SLO that still has SLO alerts attached cannot be deleted until those alerts are removed.
SLO details#
Click an SLO to open its side panel.
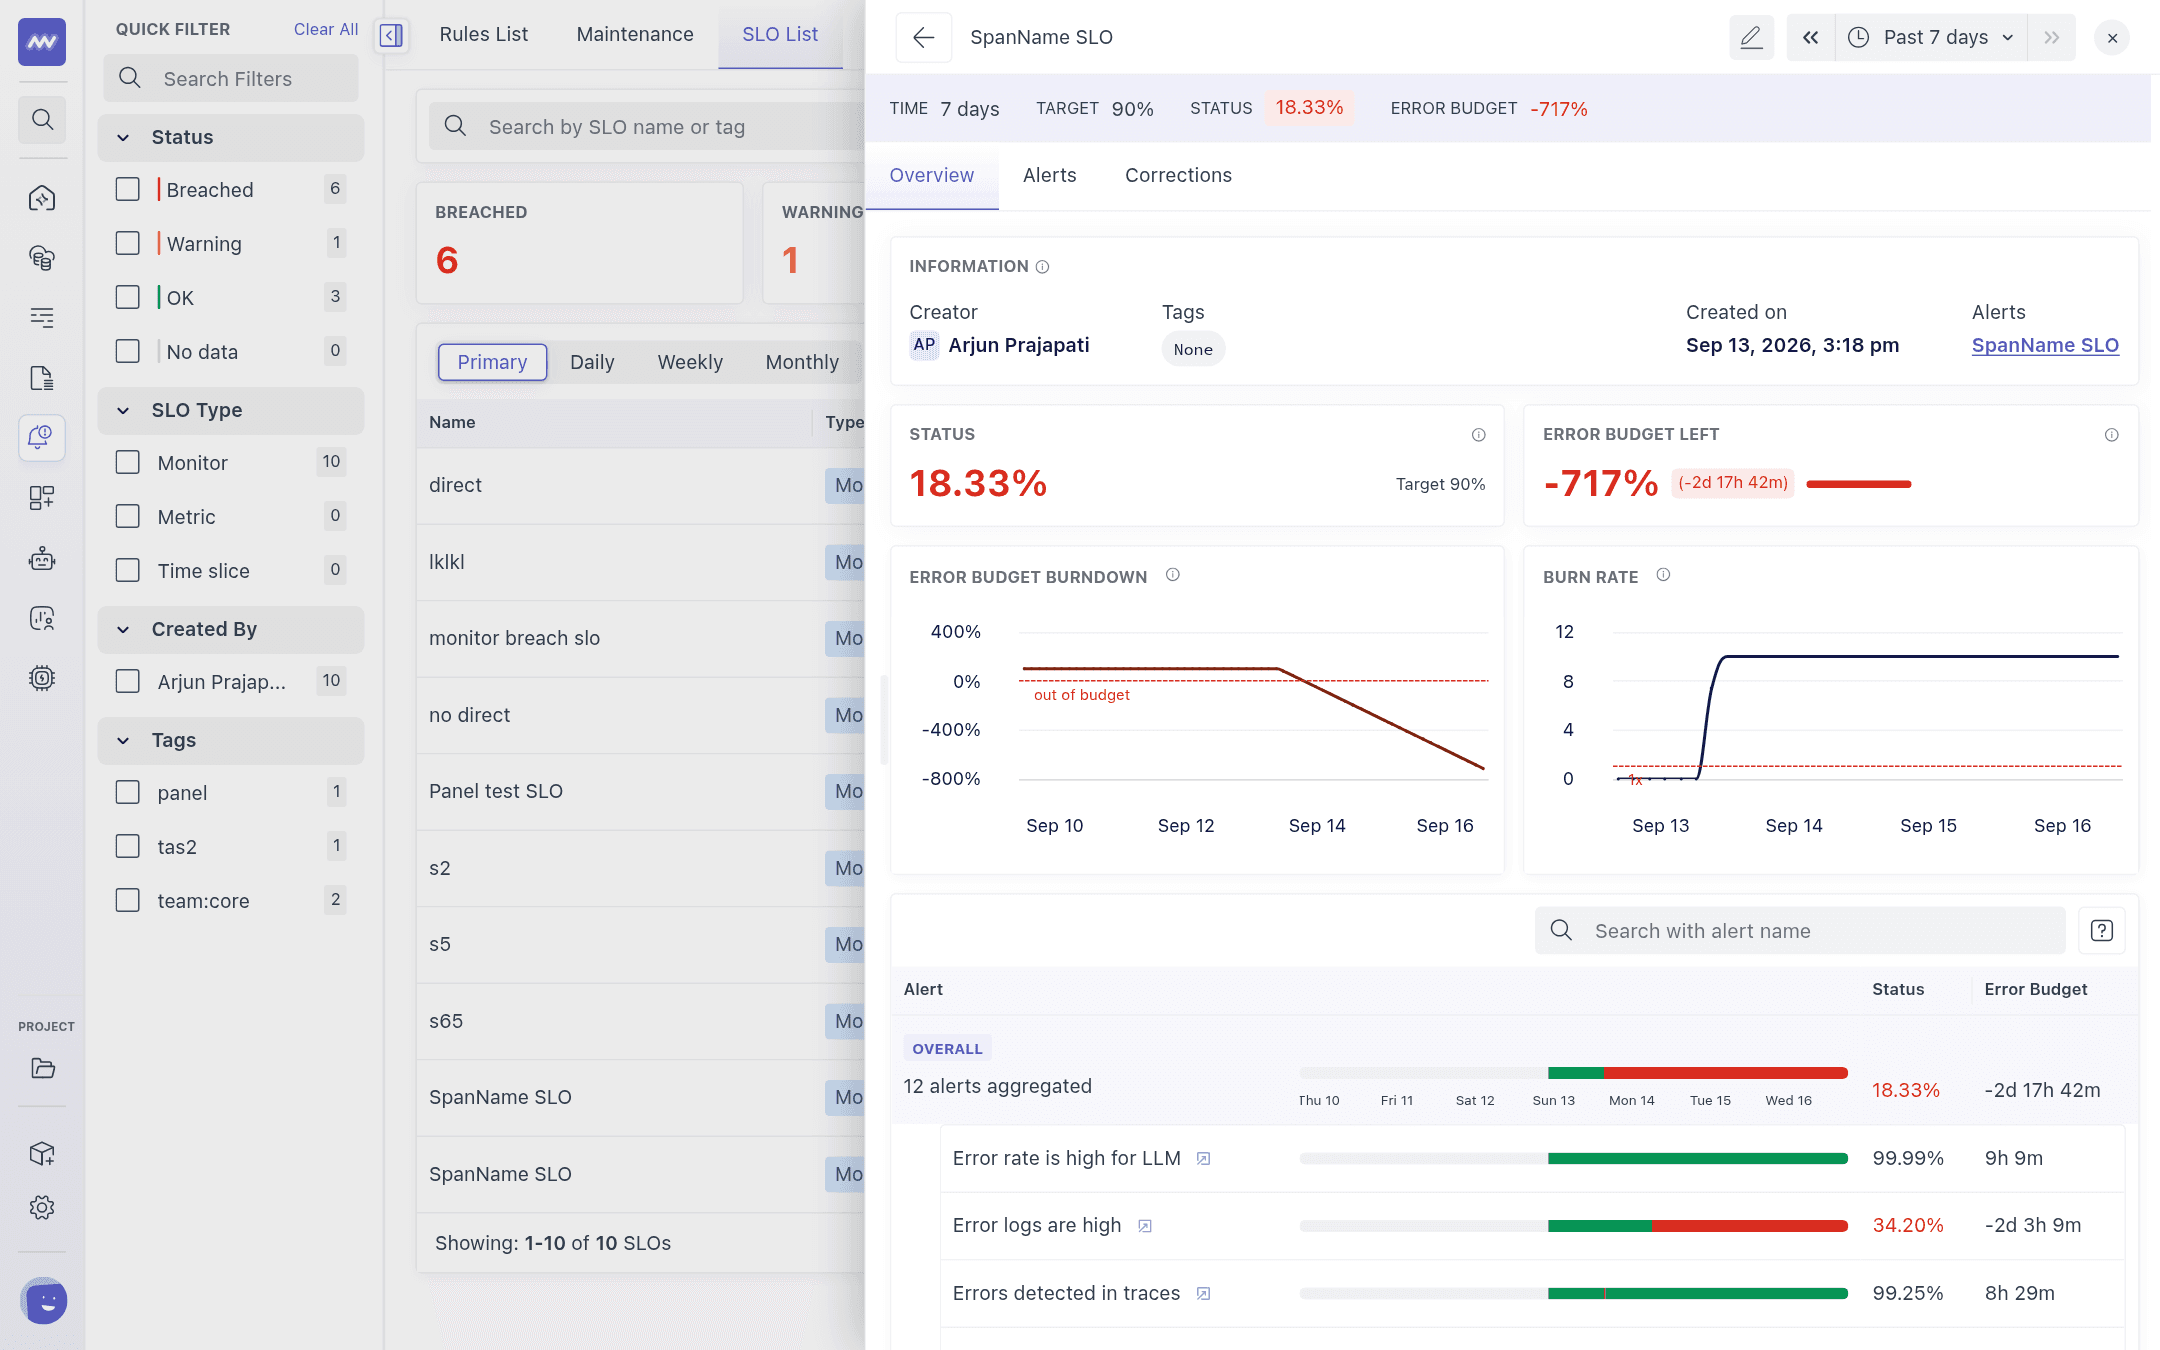
The strip at the top always shows the primary window: time window, target, status and error budget, the same numbers as the list.
Overview#
- Information: creator, tags, creation time and the SLO alerts attached to this SLO.
- Performance: the date picker selects the range the section covers. It defaults to the primary window and offers the past day, 3 days, 7, 30 and 90 days, or a custom range; the arrows step the range back and forward. The threshold that matches the selected range is used for the target.
- Status: the level of service you are currently providing to your users over the range.
- Error budget left: how much of the range's error budget is still unused, as a percentage and as a duration. It goes negative once more downtime has occurred than the budget allowed.
- Error budget burndown: how the remaining budget changed over the range. Crossing the out of budget line means the target can no longer be met for this range.
- Burn rate: how fast the budget is being spent compared to the pace the target allows. 1x means the budget would run out exactly at the end of the window; 10x means ten times faster.
- Alerts table: one row per alert with its own uptime bar, status and error budget, plus an Overall row for the whole SLO. Hover a row to preview that alert in the tiles and charts; click a row to pin it. With one or more alerts pinned, the tiles and charts show the combined status of just those alerts; click Overall to clear the selection. The external-link icon opens the alert in a new tab.
Alerts#
Lists the SLO alerts that watch this SLO and lets you create a new one (see Alerting on an SLO).
Corrections#
Lists the status corrections applied to this SLO and lets you add or remove them (see Status corrections).
How the status is calculated#
Middleware records every state change of every alert group durably, independent of the alert history retention, so an SLO can be measured over 90 days even when the alert list only keeps a few weeks.
Per alert, the timeline is:
- down while any group of the alert is in the Critical state,
- up otherwise. A Warning state counts as up, because a warning is not severe enough to indicate bad behaviour.
- An active alert counts as up from the moment it was created, until its data says otherwise. An alert that has been deleted or paused only counts for the time it actually has data.
- Time before an alert existed, and time excluded by a correction, is counted neither as up nor as down.
Overall, the SLO is down whenever any of its alerts is down. This is why the overall status can be lower than the status of every individual alert:
| Alert | t1 | t2 | t3 | t4 | t5 | t6 | t7 | t8 | t9 | t10 | Status |
|---|---|---|---|---|---|---|---|---|---|---|---|
| Alert 1 | OK | OK | OK | OK | ALERT | OK | OK | OK | OK | OK | 90% |
| Alert 2 | OK | OK | OK | OK | OK | OK | OK | OK | ALERT | OK | 90% |
| Alert 3 | OK | OK | ALERT | OK | ALERT | OK | OK | OK | OK | OK | 80% |
| Overall | OK | OK | ALERT | OK | ALERT | OK | OK | OK | ALERT | OK | 70% |
The numbers derived from that timeline:
| Value | Calculation |
|---|---|
| Status (SLI) | up ÷ (up + down), as a percentage of the counted time. |
| Error budget | counted time × (100% − target). For a 99.9% target over 7 days that is 10 minutes and 5 seconds. |
| Error budget remaining | error budget − downtime, shown as a duration and as a percentage of the budget, which equals 100 × (status − target) ÷ (100 − target). Negative when the budget is overspent. |
| Burn rate | (downtime ÷ counted time) ÷ (100% − target). A burn rate of 1 consumes exactly the budget over the window. |
While the alert engine is down, every alert group keeps its last known state. A group that was critical when the engine stopped keeps burning budget until the engine is back.
Status corrections#
A correction excludes a period of time from the calculation, for example a planned maintenance window or a known false alert. Corrected time counts as neither up nor down, so it neither burns budget nor adds uptime.
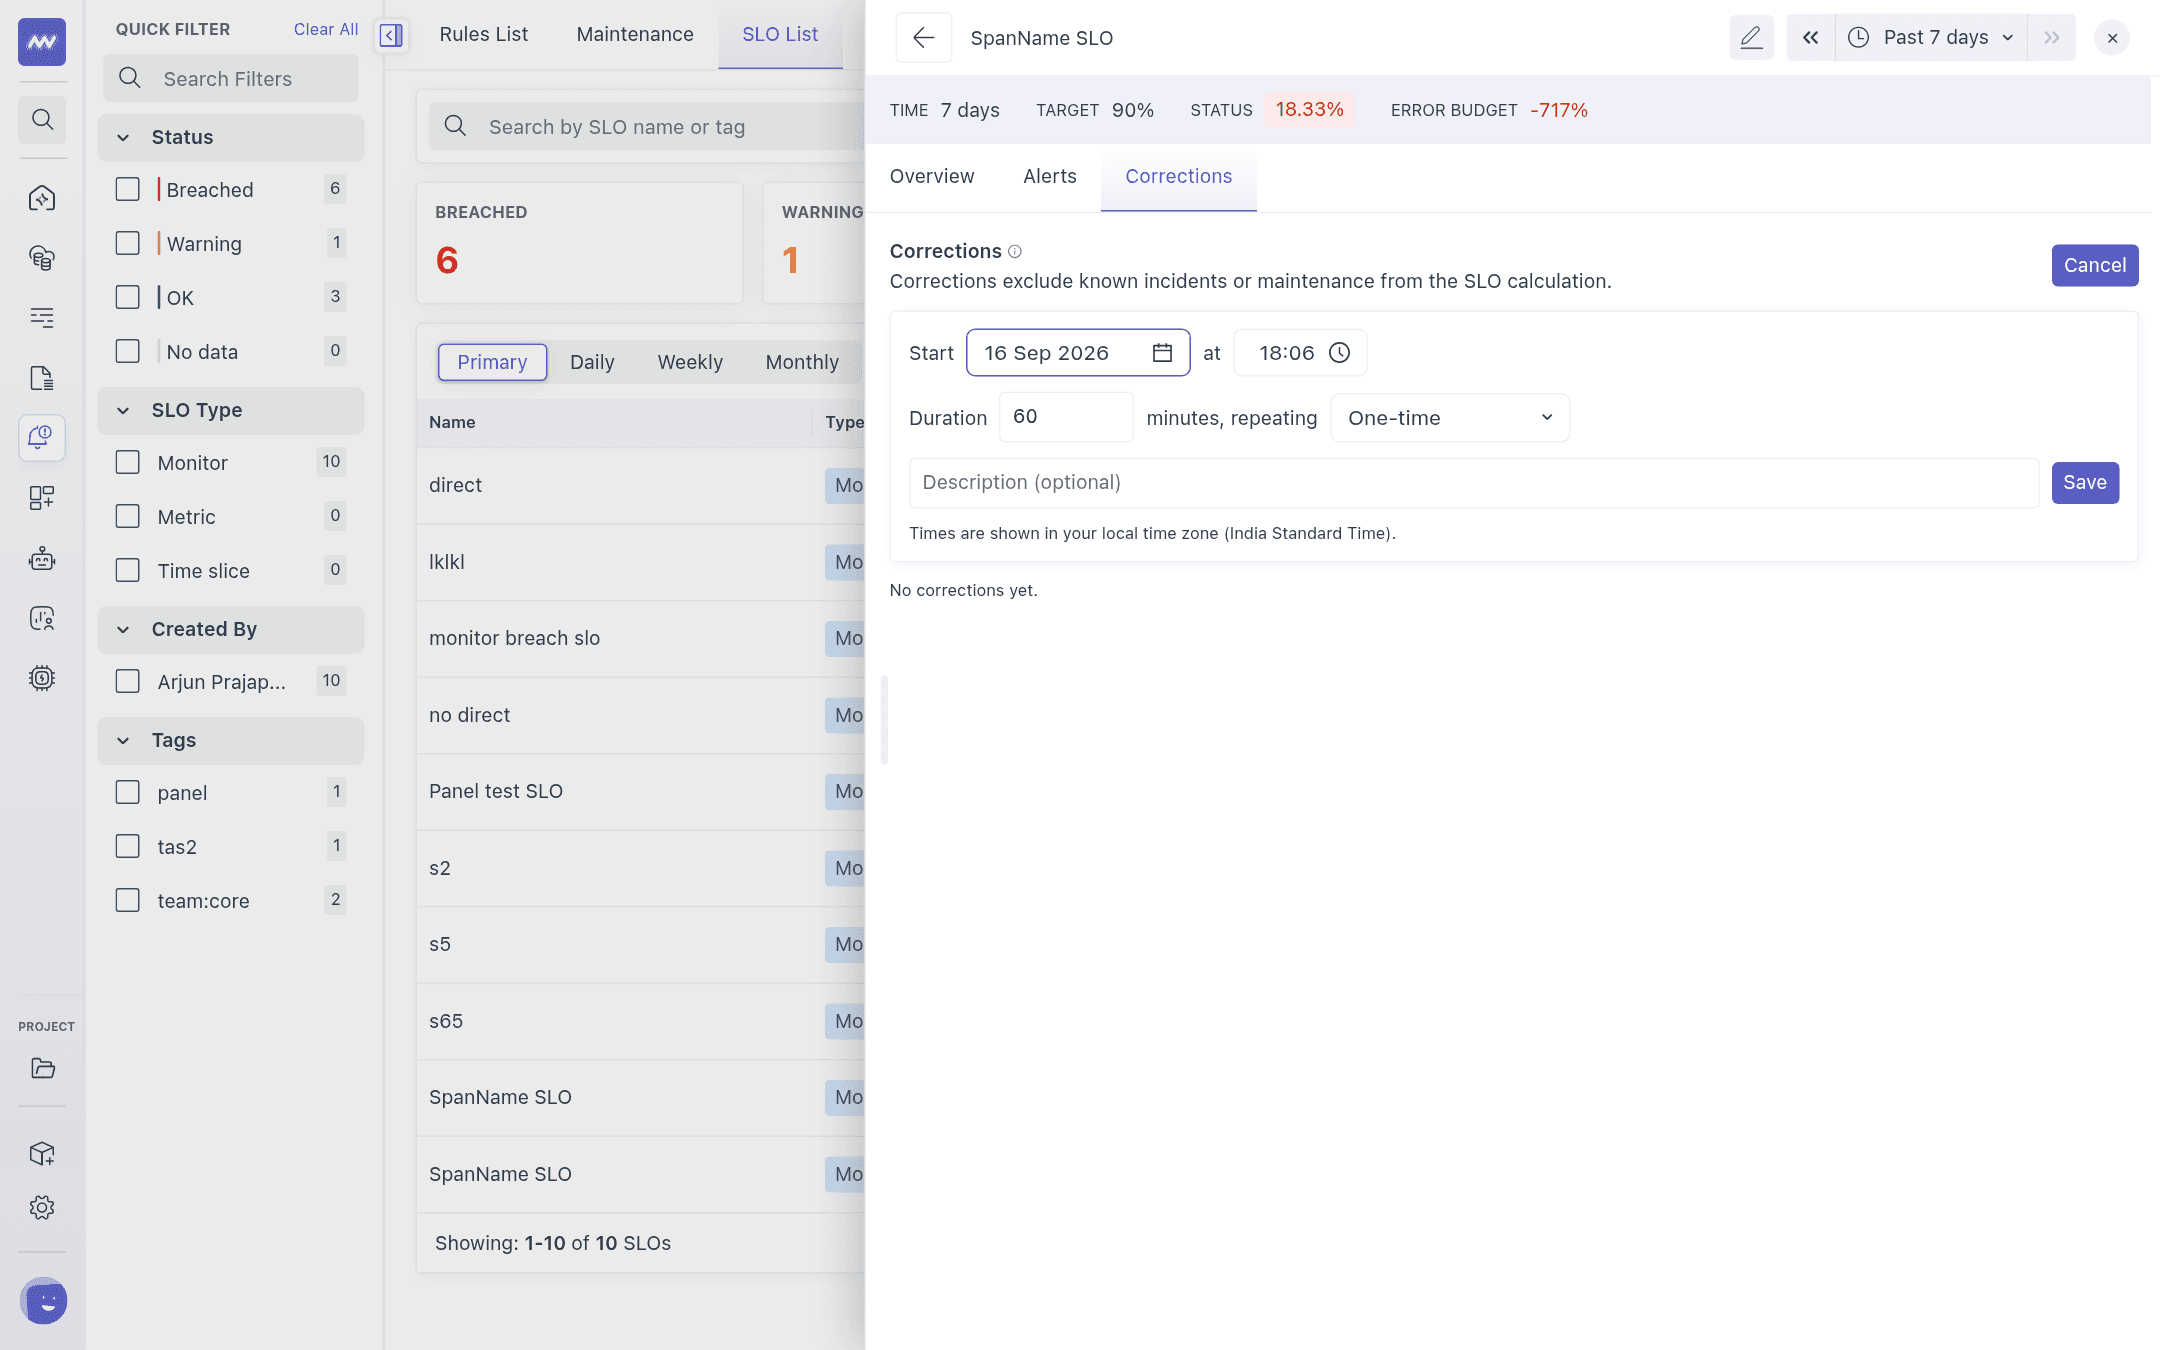
Open the SLO, switch to the Corrections tab and click Add correction. Set the start time and duration, an optional description, and, for recurring windows such as nightly maintenance, a repeat schedule (daily, weekly or monthly, with an optional end date). Corrections take effect immediately in both the list and the details panel.
Alerting on an SLO#
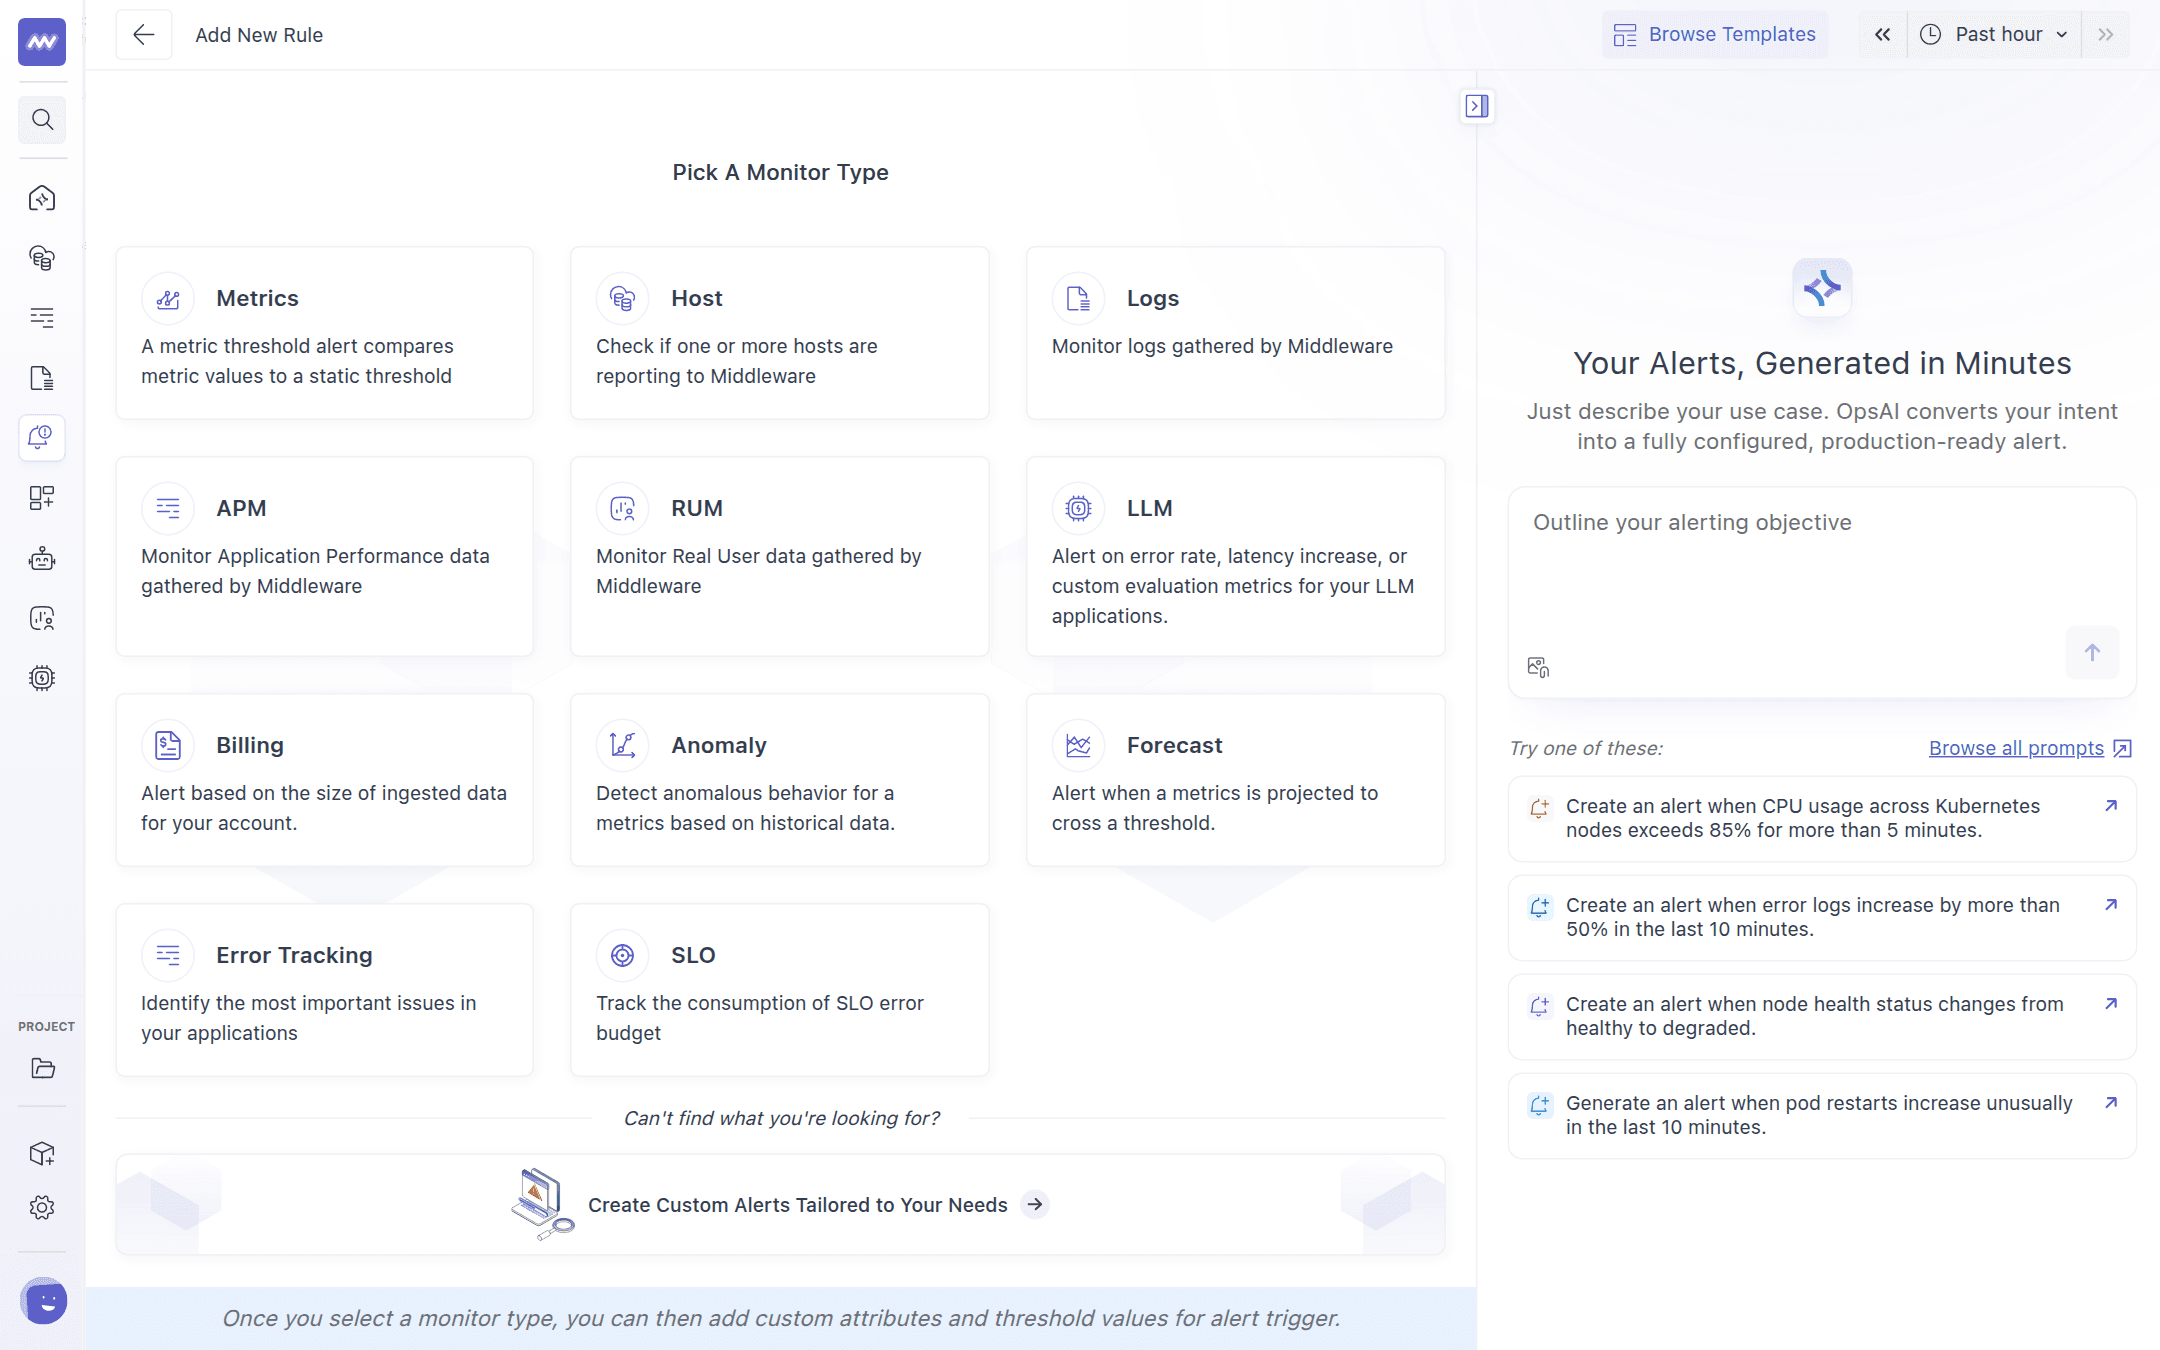
An SLO alert is an alert rule of type SLO. Create one from the SLO's Alerts tab, from Create & Set Alert when saving an SLO, or from Alerts → + Add New Rule by choosing the SLO monitor type.
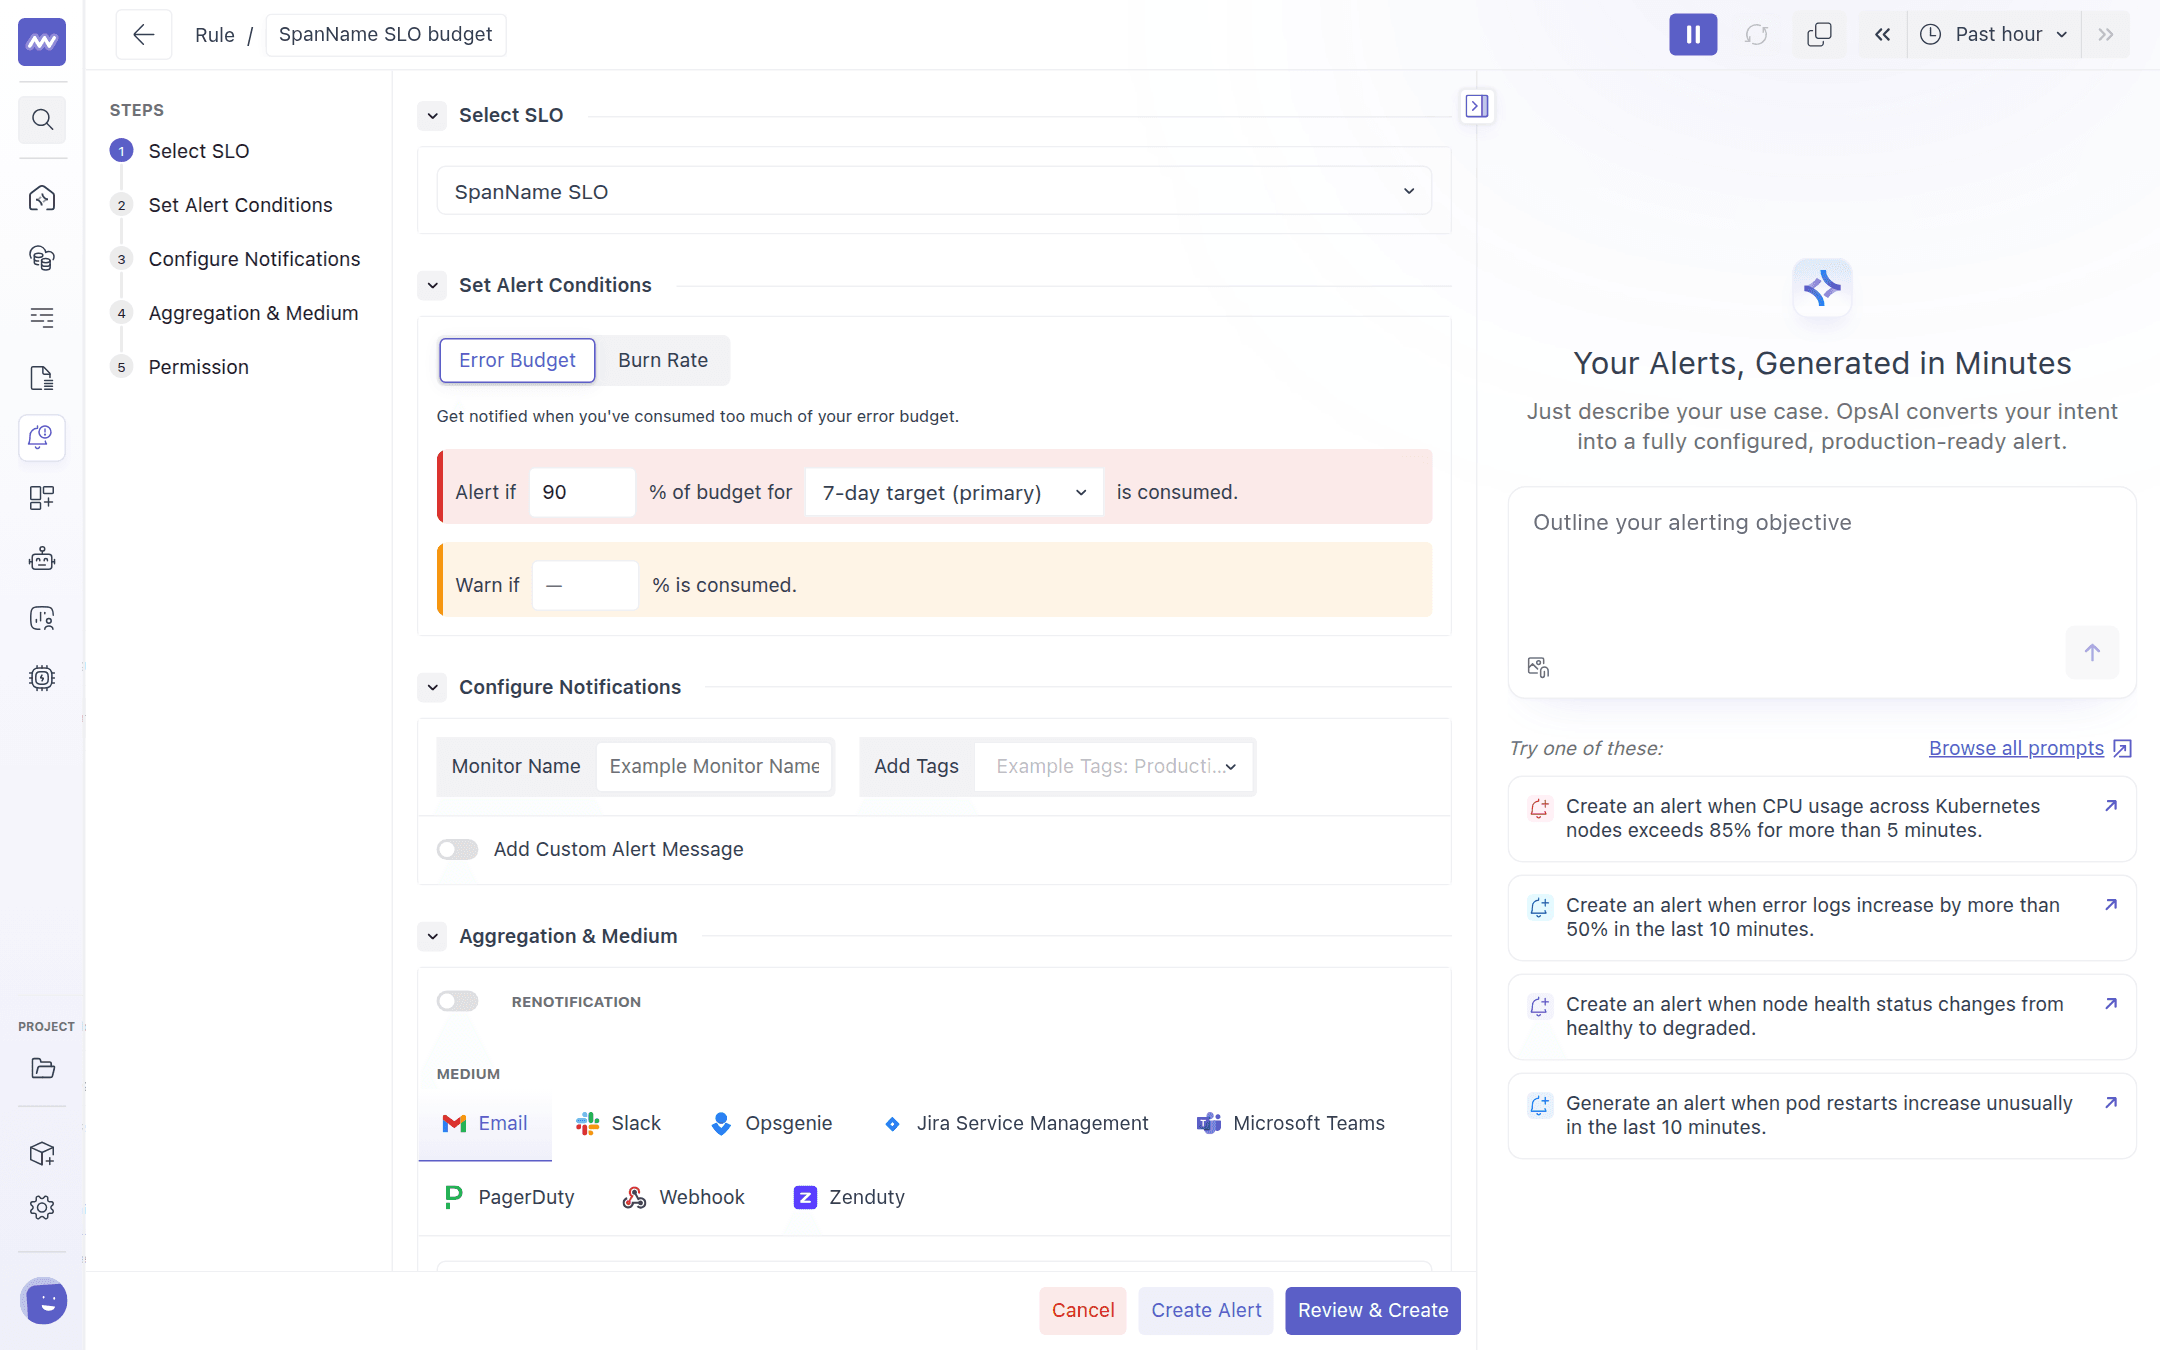
- Select SLO: pick the SLO to watch.
- Set alert conditions: choose one of two modes.
- Error budget: alert when the percentage of the error budget consumed over the SLO's window reaches a threshold, for example alert at 90%, warn at 80%.
- Burn rate: alert when the budget is being consumed faster than a multiple of the allowed pace over a long window (for example 6 hours) and a short window (for example 30 minutes). The rule fires when both windows exceed the threshold, which catches sustained fast burns without paging on a short blip.
- Configure notifications, Aggregation & medium and Permission work exactly as for any other alert rule. Notifications name the SLO, the window, the target and the consumed budget or burn rate, on every medium.
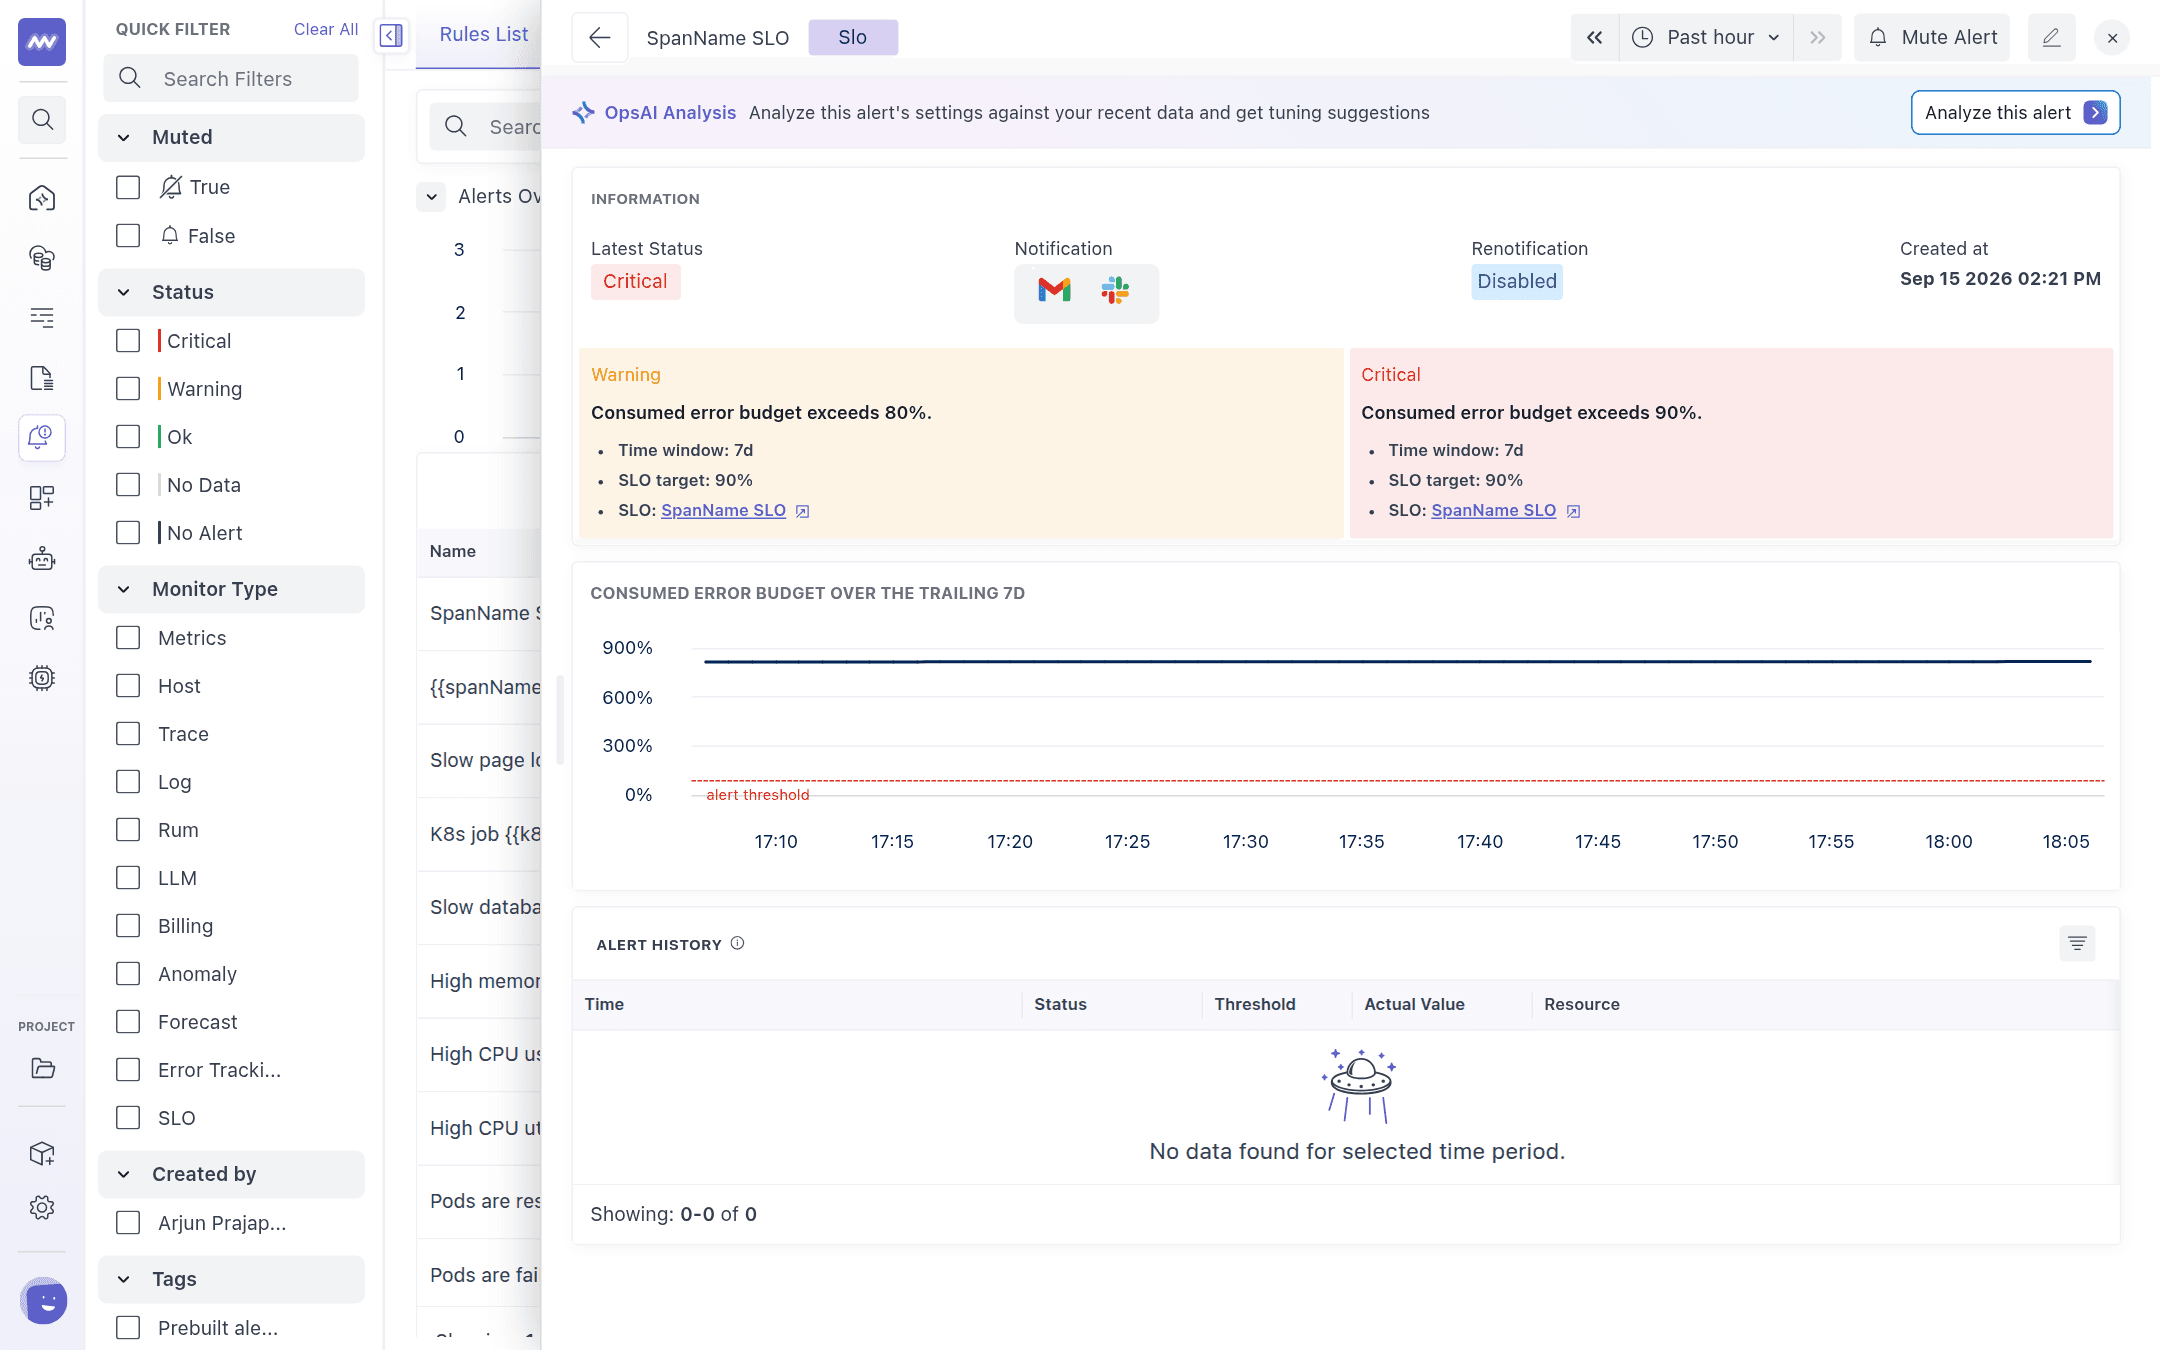
SLO alerts are evaluated every 5 minutes. The triggered alert panel for an SLO rule shows the condition, a link to the SLO and a chart of the value the rule evaluates over time, which is the trailing-window value at each moment rather than only what happened in the visible range.
Limits#
| Limit | Value |
|---|---|
| Alerts per SLO | 20 |
| Alert groups per alert used in an SLO | 1,000 |
| SLOs per project | 500 |
| Time windows | 7, 30 or 90 days |
| Status refresh in the list | every 5 minutes, and immediately after editing an SLO or a correction |
Need assistance or want to learn more about Middleware? Get in touch with us via our Contact Us or join our Slack channel.