Dashboard Builder
Design rich, reliable dashboards by composing widgets, self‑contained visual blocks that read from your telemetry and present it in the format you choose. This guide walks through the full widget workflow in the exact order you will experience it in the UI: creating a widget, selecting a graph type and time window, organising with groups, building queries and formulas, tuning roll‑ups, applying functions and advanced options (including a comprehensive unit system), and finally finishing the visual and layout polish.
1. Create a Dashboard
To create a dashboard, go to Dashboard Builder → Create Dashboard → Give name and description. It will open a window giving you multiple widget options.

You can add a widget to an empty or an existing dashboard. On an empty dashboard, select one of the available widget types. The editor opens immediately with that type preselected. On a dashboard that already contains widgets, use "Add Widget" in the top-right corner; you will see the same list of types, and choosing one opens the widget editor.
2. Understand the Widget Editor
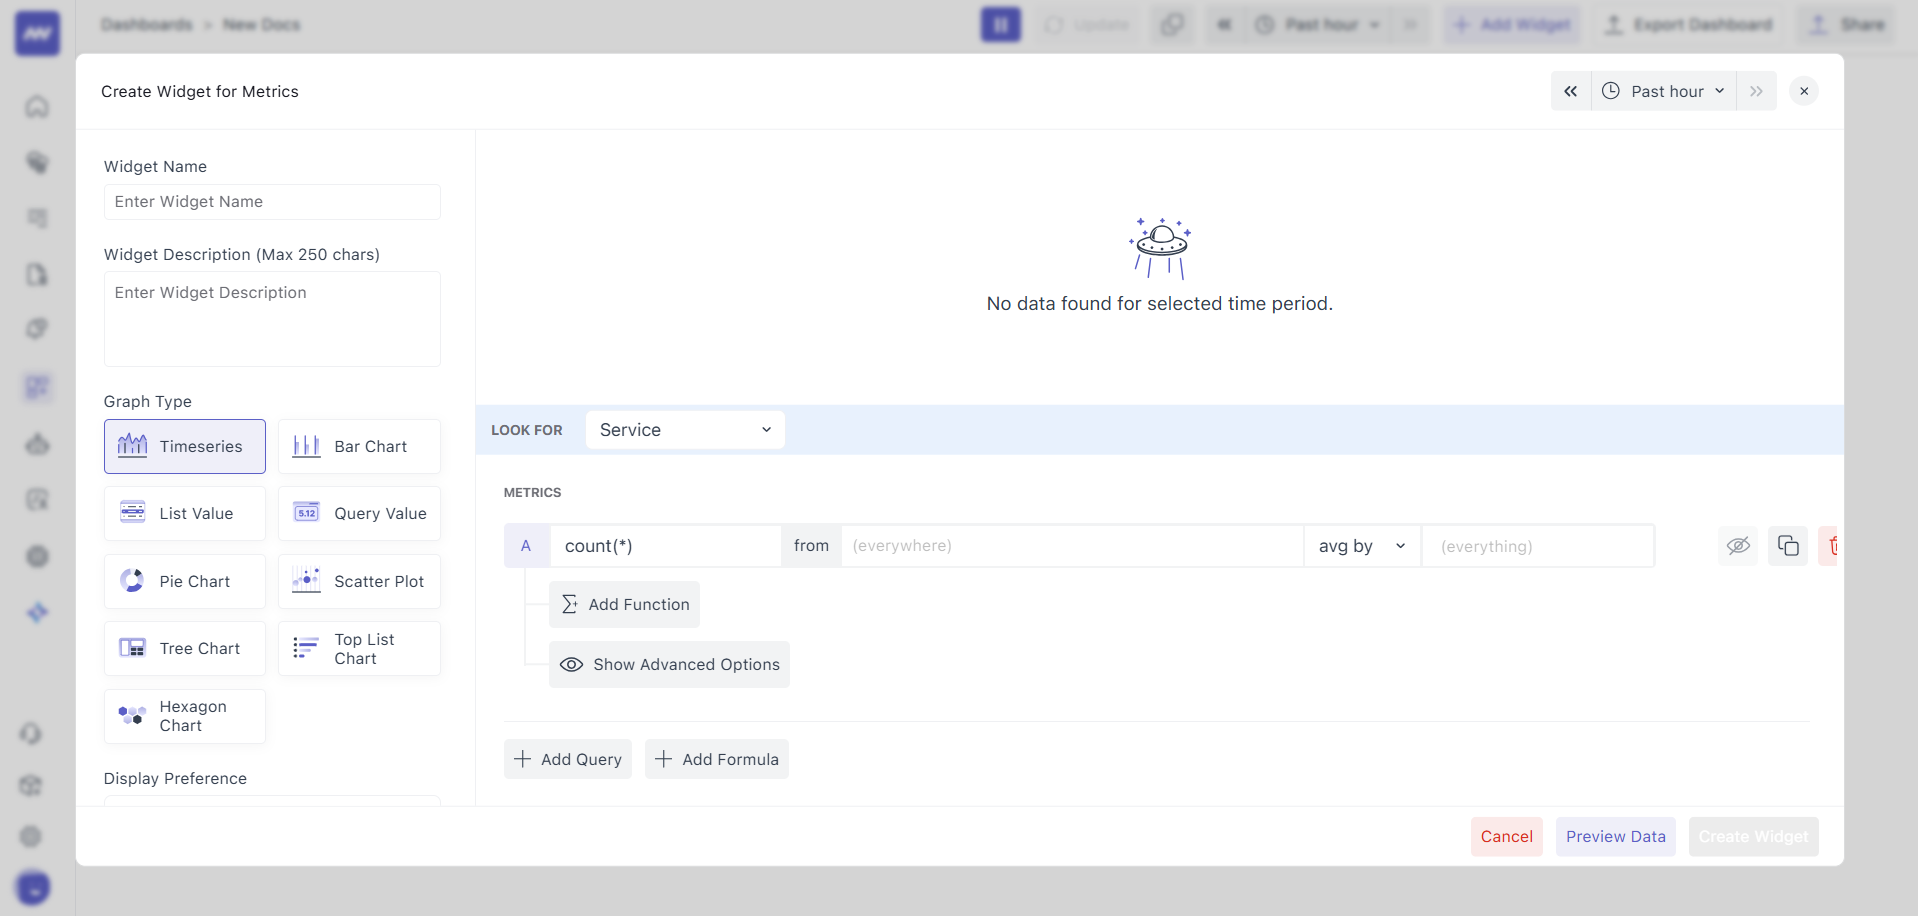
When the editor opens, it is separated into three clear sections so you can set context, data, and visuals without losing your place:
- Top bar: Pick a preview time range so you can see the effect of your configuration on real data while you edit.
- Left panel: Name and describe the widget, optionally assign it to a Group with a Group Order, and choose the Graph Type. Treat this panel as the widget’s metadata and high‑level intent.
- Right panel: At the top, you see the live graph preview; below that, you configure Query Data, Formulas, Functions, and Advanced Options. This is where the widget actually connects to and transforms your data.
3. Choose an Appropriate Graph Type
Middleware supports multiple visualizations, allowing the same metric to be inspected from different angles: Timeseries, Bar, List, Query (Query Value), Pie, Scatter, Tree, Top List, and Hexagon. Pick the type that matches the story you want to tell.
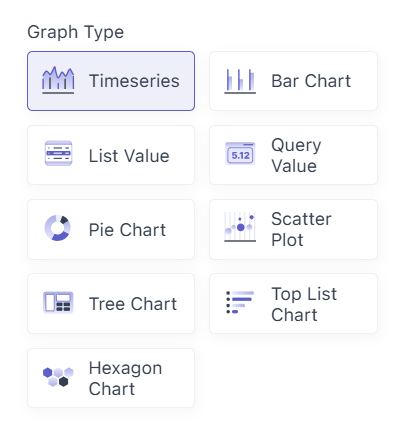
For example, Timeseries for change over time, Bar to compare categories at a glance, Top List to surface the highest/lowest values, and Query (value) to emphasise a single computed number. (Insert your Graph Type screenshot here.)
3.1 Display Preference (time window behaviour on the dashboard)
Decide how the widget obeys time on the dashboard:
- Global Time (default): The widget inherits the dashboard’s time range so multiple widgets remain comparable.
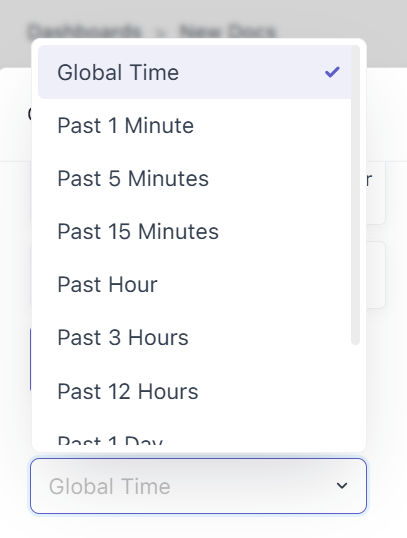
- Past X: The widget always shows a trailing window you select (e.g., Past 1m/5m/15m/1h/3h/12h/1d/2d/1w), regardless of the dashboard range. Use this when a fixed recent context is essential (e.g., “last 15 minutes of errors”) and cross‑widget alignment is less important. (Insert your Display Preference screenshot here.)
3.2 Group and Group Order (dashboard organisation)
Use Group to collect related widgets into labelled sections. Set the Group Order to a number that controls the section's position; lower numbers appear earlier. To keep the group together, reuse the same order number for each widget in that group. Otherwise, widgets may interleave with other groups.
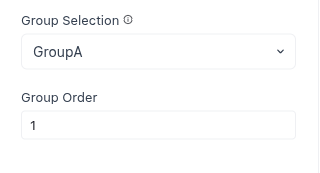
Make sure the group order number is the same for all widgets in that group. Otherwise, the group may not display in the correct order on the dashboard.
4. Build the data layer: Queries, Filters, Aggregation, and Groups
A widget’s data is defined by one or more Queries and, if needed, one or more Formulas. Add as many as you require.
4.1 Query Data
You can fill your graph with data using queries and formulas.
- Queries let you pull specific data from your selected resource.
- Formulas allow you to apply calculations or combine results from multiple queries.
You can add as many queries and/or formulas as needed to get the exact data you want to visualize.
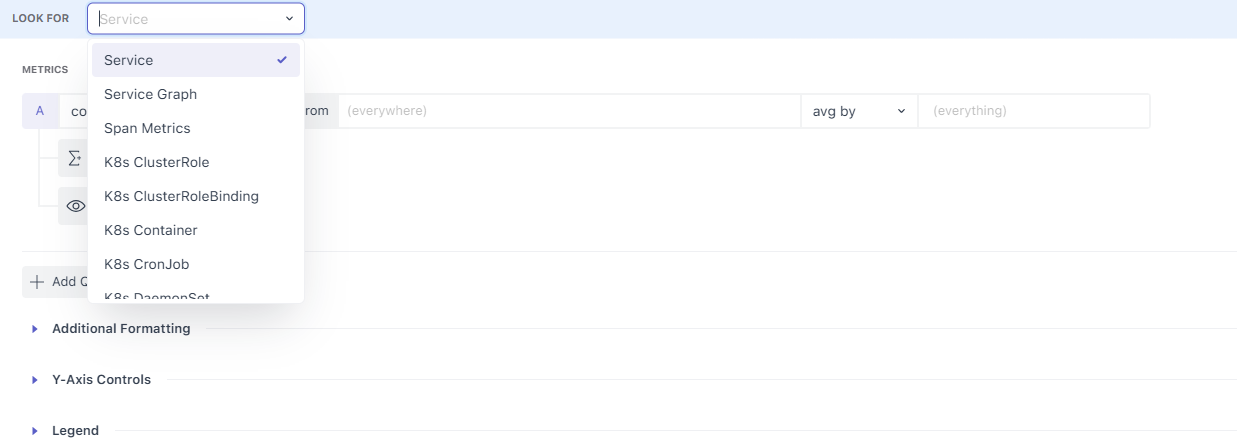
4.2 Select the data source (Look For)
Every piece of OpenTelemetry and monitoring data is attached to a resource such as a host, container, process, or service. Choose the resource that actually emits the metric you need. For metric‑centric widgets, you may use All Metrics if you are unsure which resource to begin with. Only resources you have integrated are selectable; resources that exist but currently have no data are visible yet disabled to prevent misconfiguration.
4.3 Define the Query (Metric and Filter)
Metric
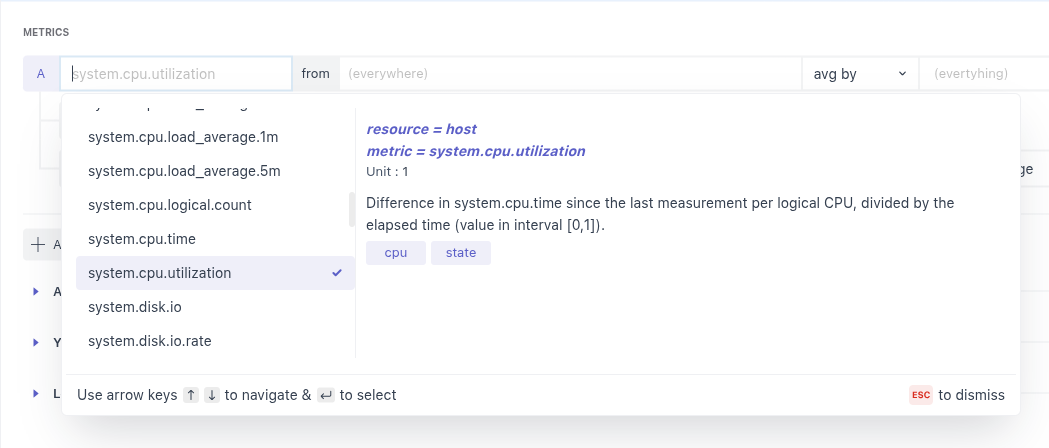
Choose the metric you want to display in the graph from the dropdown list or by searching for it. The list of metrics shown will be related to the resource you selected earlier.
When you hover your mouse over an option in the dropdown, you will see more details about the metric on the left side, such as its description, unit, and attributes. This helps you understand what each metric represents before selecting it.
Filter
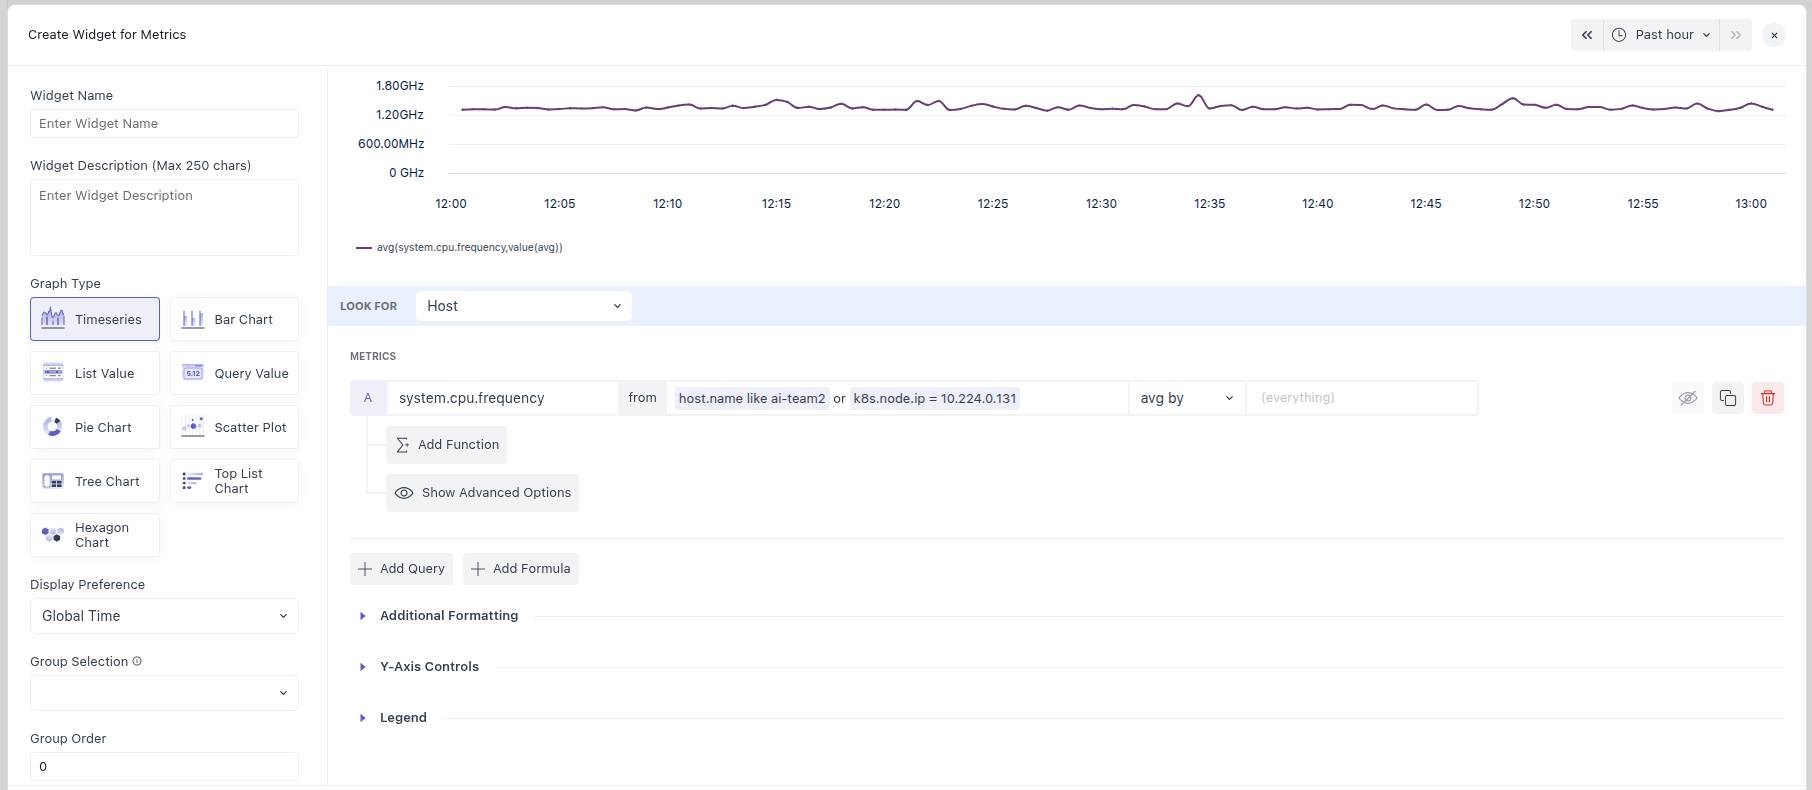
You can filter your metric’s data by attributes or other metrics using the from box (next to the metric selector).
Default Filter: (everywhere), shows combined data from all sources (e.g., hosts, processes, containers).
Custom Filter: Use advanced filtering to narrow results. You can build Boolean expressions in this format: <attribute or metric> <operator> <value>
Example: host.id != prod-machine
How to Use the From Box:
- Click inside the From box.
- Type the attribute or metric name, or select it from the dropdown.
- Choose an operator (suggestions will appear; you can type or select).
- Enter the value to compare against (type it or pick from the dropdown).
The From box is smart; as you type, it will suggest valid attributes/metrics, operators, and values based on your selection, making filtering faster and easier.
Combining Multiple Filter Conditions
You can create more complex filters by combining multiple Boolean expressions using AND or OR operators.
You can also group and nest conditions using round brackets () to control the order in which they are applied.
Example: (host.id != prod-machine AND os.type == mac) OR status == stop
Supported operators:
| Operator | Description | Example |
|---|---|---|
= (Equal To) | Match results where the attribute/metric value is exactly equal to the given value. | os.type = linux |
!= (Not Equal To) | Match results where the attribute/metric value is not equal to the given value. | host.id != prod-server |
IN | Match results where the attribute/metric value is one of the values in a given list. | region IN us-east,us-west,eu-central |
NOT IN | Match results where the attribute/metric value is not in the given list. | status NOT IN stopped,paused |
LIKE | Match results using a case‑sensitive pattern with wildcards (% for any number of characters). | service.name LIKE api% |
NOT LIKE | Exclude results that match the case‑sensitive pattern. | hostname NOT LIKE test% |
ILIKE | Like LIKE but case‑insensitive (ignores letter case). | app.name ILIKE sales% |
NOT ILIKE | Exclude results that match the case‑insensitive pattern. | username NOT ILIKE admin% |
REGEX | Match results where the value fits the given regular expression pattern. | env REGEX ^prod.* |
NOT REGEX | Exclude results that match the given regular expression pattern. | log.level NOT REGEX ^debug$ |
Additional mupported operators (For numeric metrics only):
| Operator | Description | Example |
|---|---|---|
< (Less Than) | Match results where the metric value is smaller than the given number. | system.cpu.utilization < 0.75 |
<= (Less Than or Equal To) | Match results where the metric value is smaller than or equal to the given number. | system.processes.count <= 100 |
> (Greater Than) | Match results where the metric value is larger than the given number. | system.cpu.utilization > 0.9 |
>= (Greater Than or Equal To) | Match results where the metric value is larger than or equal to the given number. | system.memory.usage >= 500 |
If the value in your expression contains spaces, quotes, reserved keywords (like operators), or special symbols, then enclose the value in double quotes " " to ensure it’s interpreted correctly.
Example: body LIKE “metric is not available in service \”db-viewer\””
4.4 Choose Aggregation and Aggregation Group
At each timestamp, multiple instances (hosts, processes, containers) may report the same metric. Aggregation determines how those per-source points are reduced into one value per timestamp (the default is average by). Supported methods include Average, Sum, Min, Max, Any, Uniq, Count, and Group.
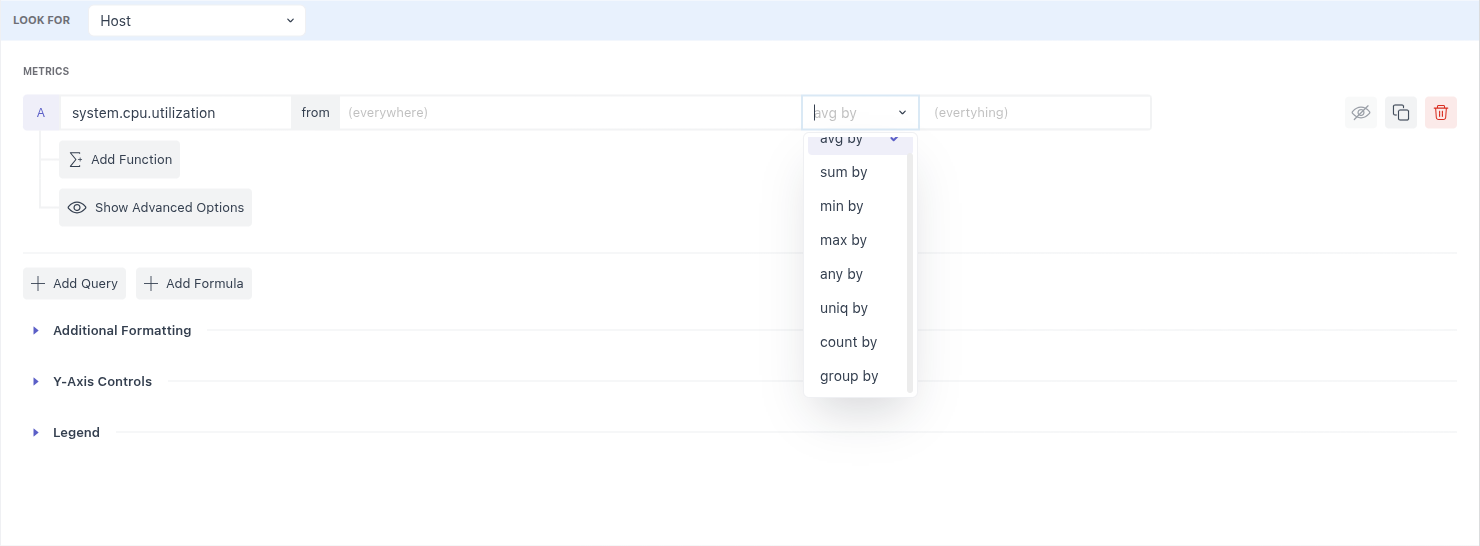
If you want to compare instances side by side, use Aggregation Group. Select one or more attributes to group and each group will render as its own line, bar, list row, or element. For example, grouping by host yields one series per host in a timeseries chart, making instance comparisons effortless.
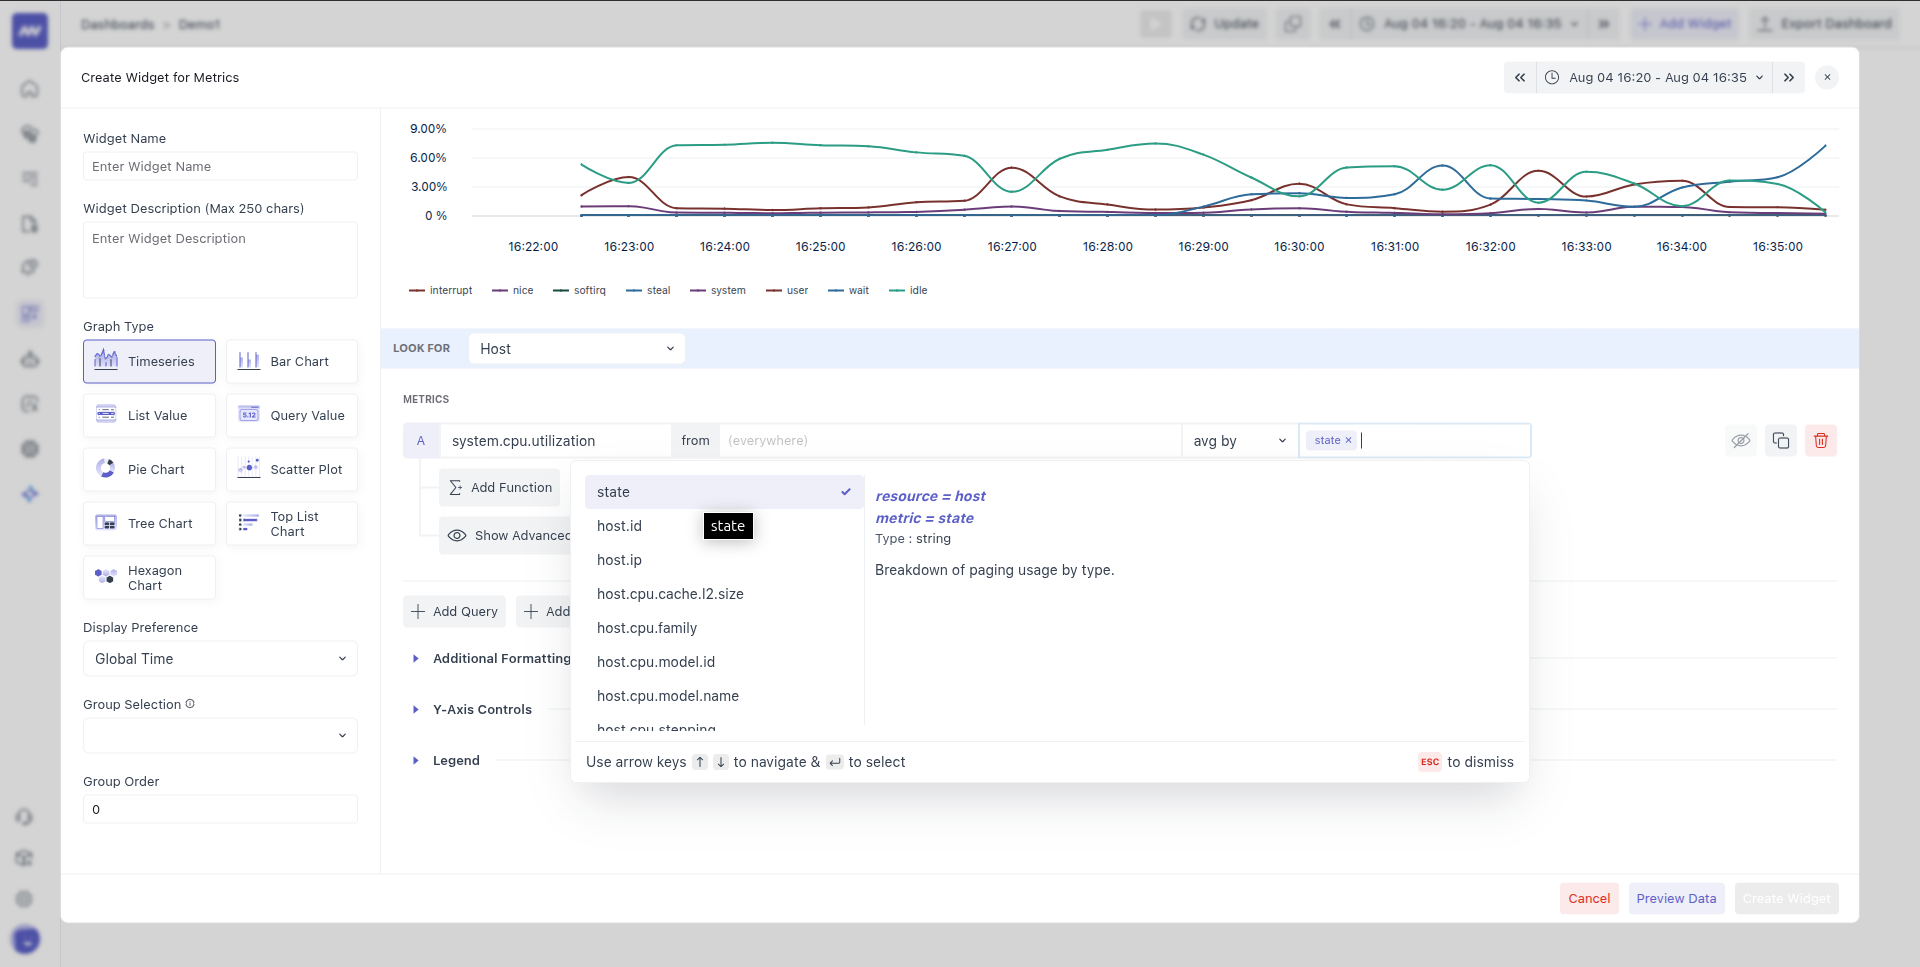
4.5 Control density with Roll‑Up (aggregation over time)
Metrics are usually collected in short intervals, typically every 5 to 20 seconds, by agents, integrations, or cloud services.
For example:
- If a metric is collected every 5 seconds, you will have 17,280 data points for one day of data.
- Due to physical limits, middleware graphs can only display about 200–300 data points at once. The system automatically aggregates your data into larger time blocks.
- Hence, 1-day data will be rolled up every 5 minutes, creating 288 data points, where each new point represents an average of 60 original data points.
By default, middleware:
- Averages the metric values across all sources/instances
- Uses a fixed roll-up interval based on the selected time window
| Time Window | Roll Up Interval |
|---|---|
| < 1 hour | 30 seconds |
| < 3 hours | 1 minute |
| < 1 day | 5 minutes |
| < 2 days | 10 minutes |
| < 1 week | 1 hour |
Use the Roll Up box under the Advanced Options to adjust:
- The aggregation method (e.g., average, sum, max, min)
- The roll-up time interval (e.g., 120 secs, 600 secs)

4.6 Compose results with Formulas
Assign letters (a, b, c, …) to your queries, then write an expression that uses those letters as variables. For instance, to compute a percentage, you might write: (a / b) * 100
Rules:
- Each query must be represented by its assigned lower‑case letter symbol, or you will get an error.
- The formula must be a valid mathematical expression. The only variables allowed are the query symbols.
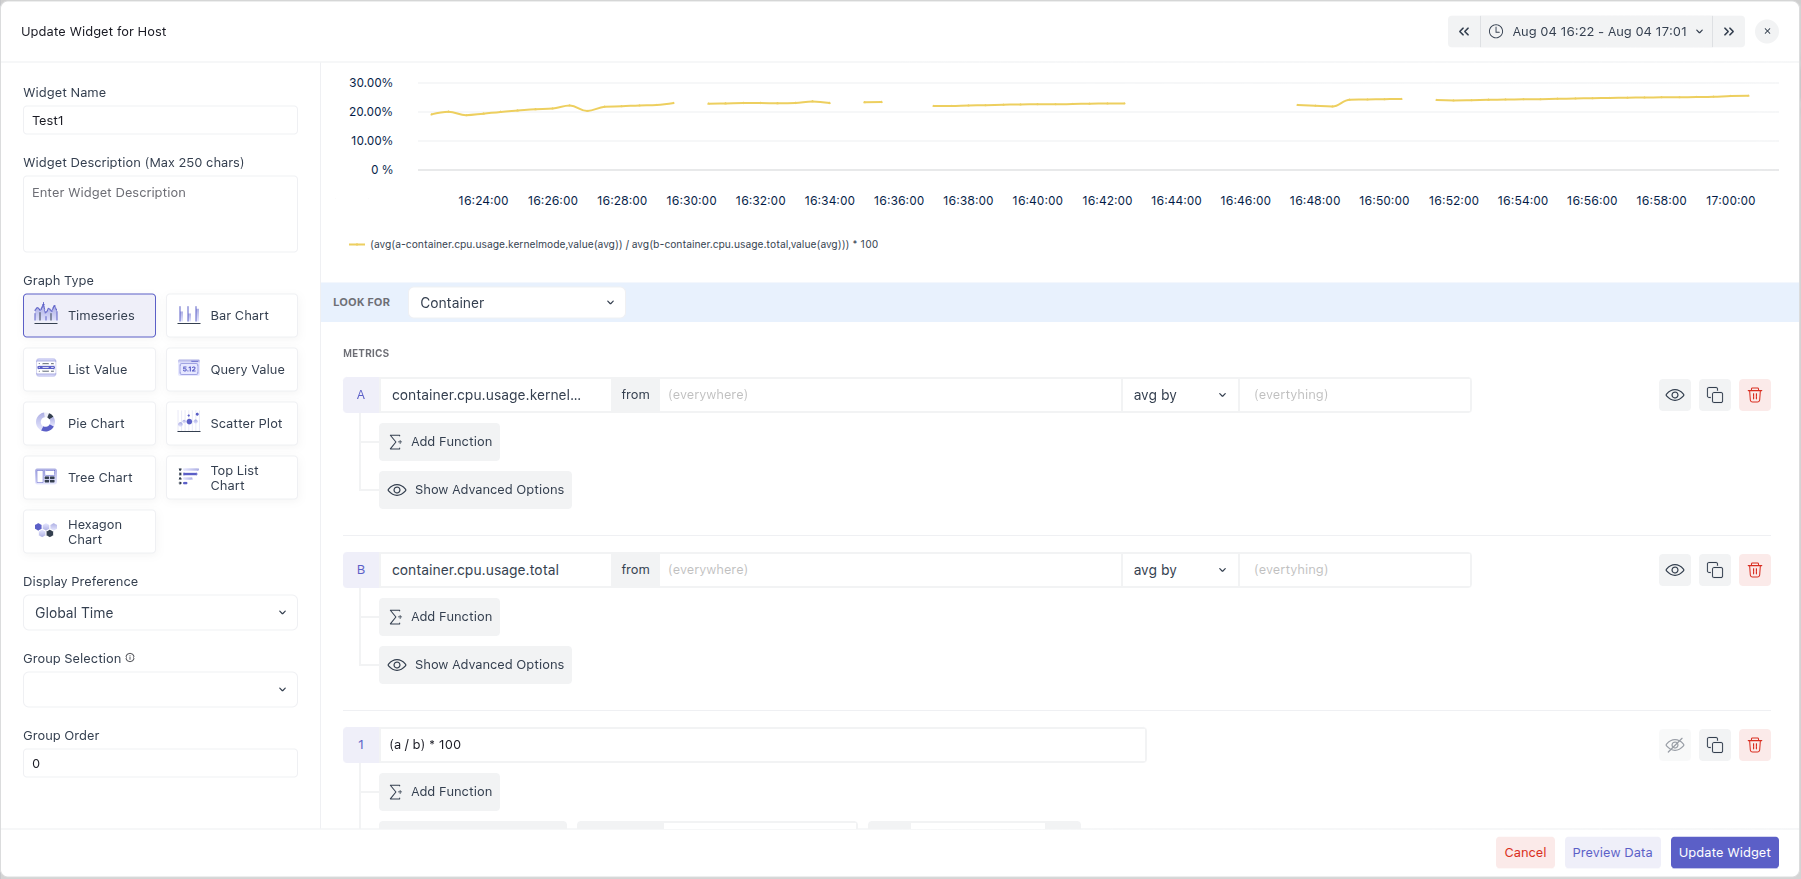
4.7 Post‑process with Functions
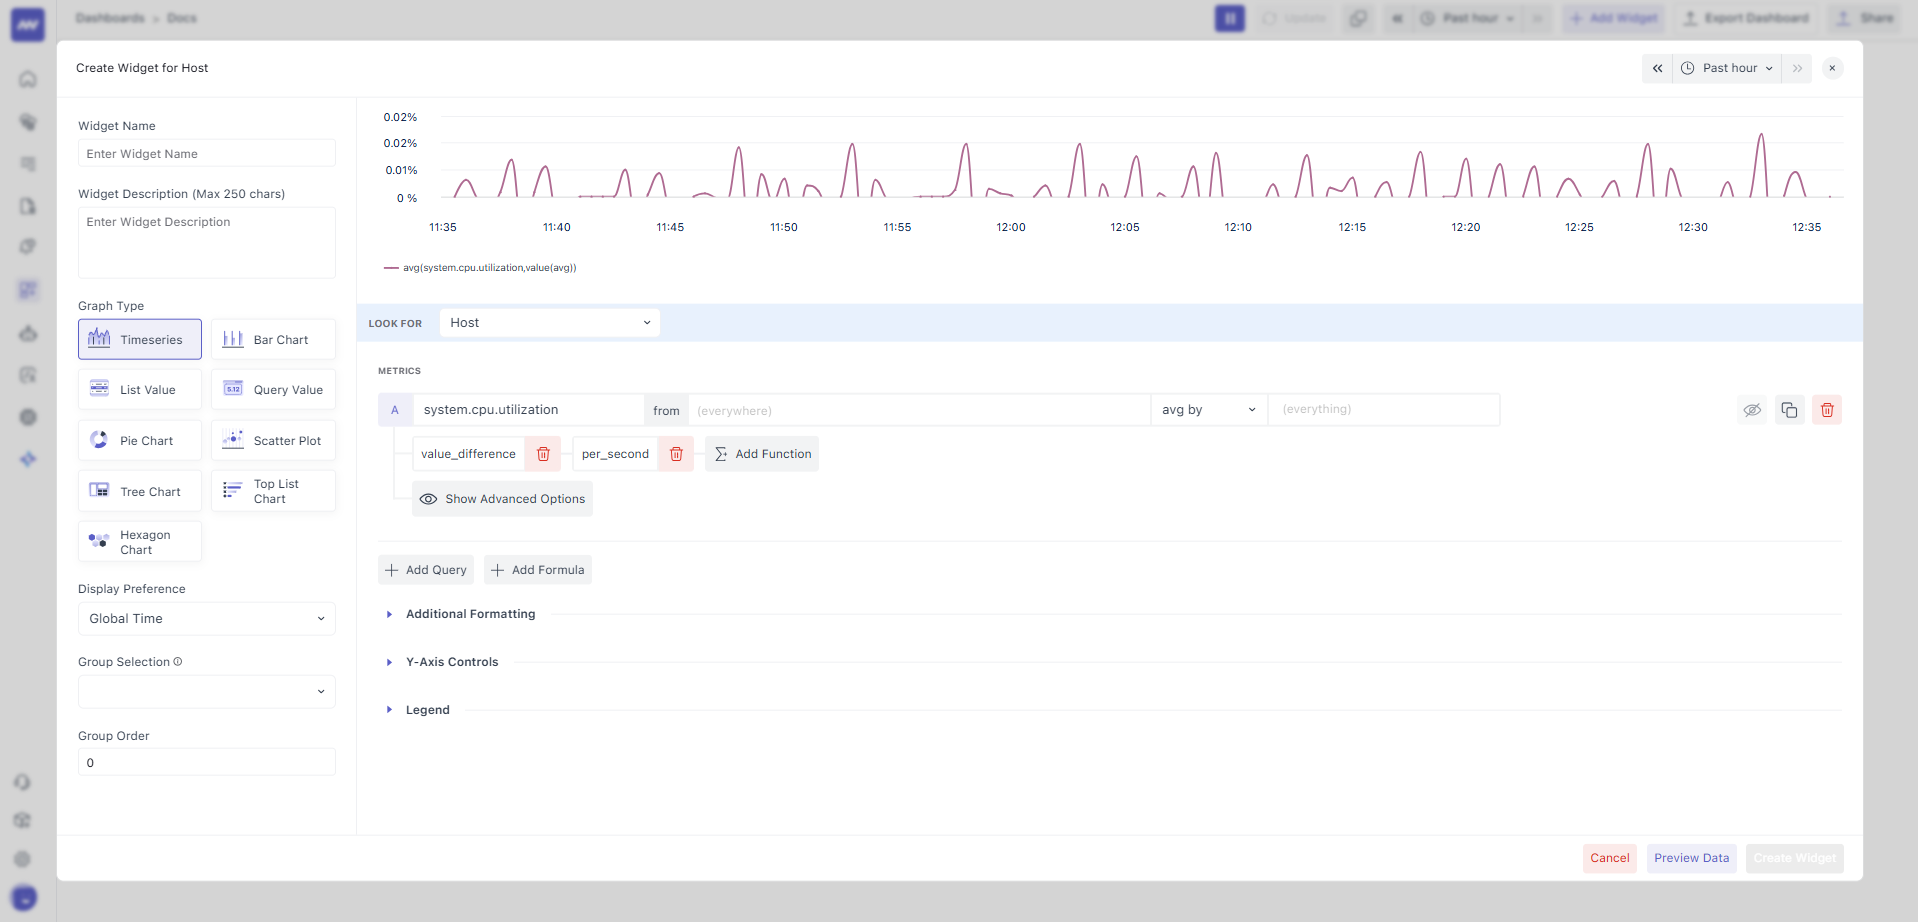
Functions operate on the output of a query or a formula and can be chained. The Rate family is especially useful when you need a change‑per‑interval view from a cumulative series:
- Value Difference subtracts the previous value from the current value.
- Per Second Rate / Per Minute Rate / Per Hour Rate divide the difference by the elapsed seconds/minutes/hours between points.
- Monotonic Difference behaves like Value Difference but ignores negative drops that can appear in reset‑prone series.
Use these to transform raw counters into meaningful rates right in the widget pipeline.
Example:
| Timestamp | Value | Value Difference | Per Second Rate | Per Minute Rate | Per Hour Rate | Monotonic Difference |
|---|---|---|---|---|---|---|
| 2025-08-13 15:00:00 | 10 | N/A | N/A | N/A | N/A | N/A |
| 2025-08-13 15:01:00 | 12 | 2 | 0.0333 | 2 | 120 | 2 |
| 2025-08-13 15:02:00 | 15 | 3 | 0.05 | 3 | 180 | 3 |
| 2025-08-13 15:03:00 | 22 | 7 | 0.1167 | 7 | 420 | 7 |
| 2025-08-13 15:04:00 | 30 | 8 | 0.1333 | 8 | 480 | 8 |
| 2025-08-13 15:05:00 | 15 | -15 | -0.25 | -15 | -900 | 0 |
5. Advanced Options
Advanced controls tighten the final semantics and presentation of the widget.
5.1 Alias Name
By default, your graph will use the selected metric name as the label for the line, column, or component that shows its data.
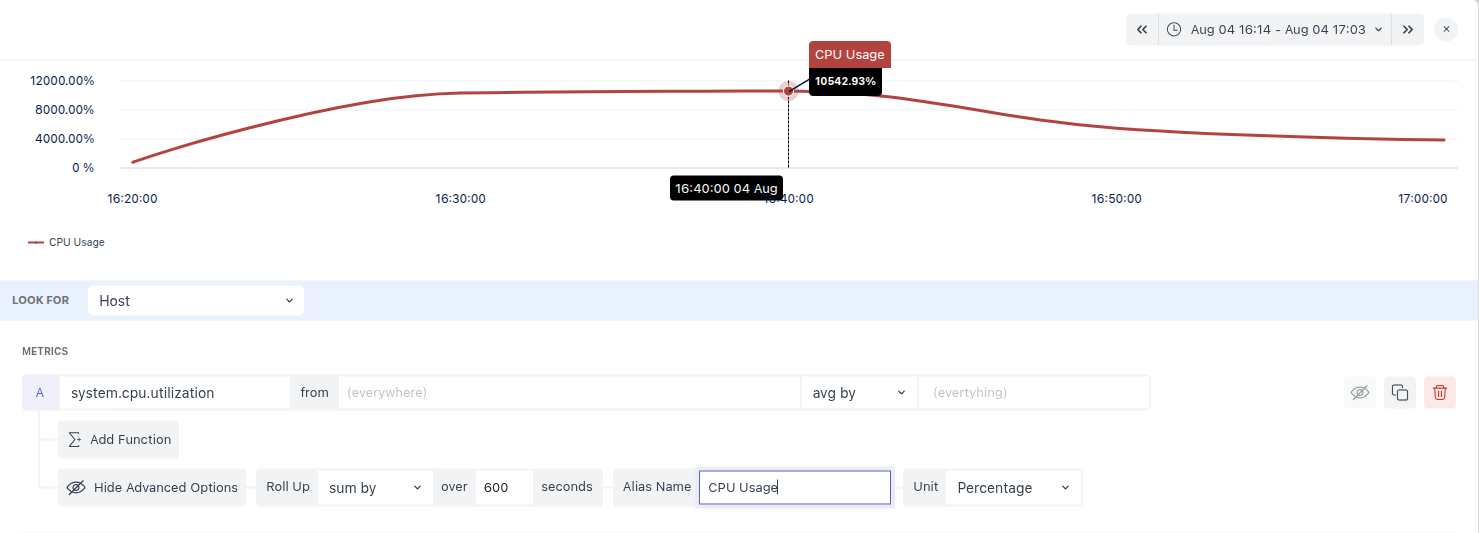
If you want a different label, you can enter a custom name in the Alias Name input box. This custom name will then appear in the graph legend and tooltips instead of the metric’s default name.
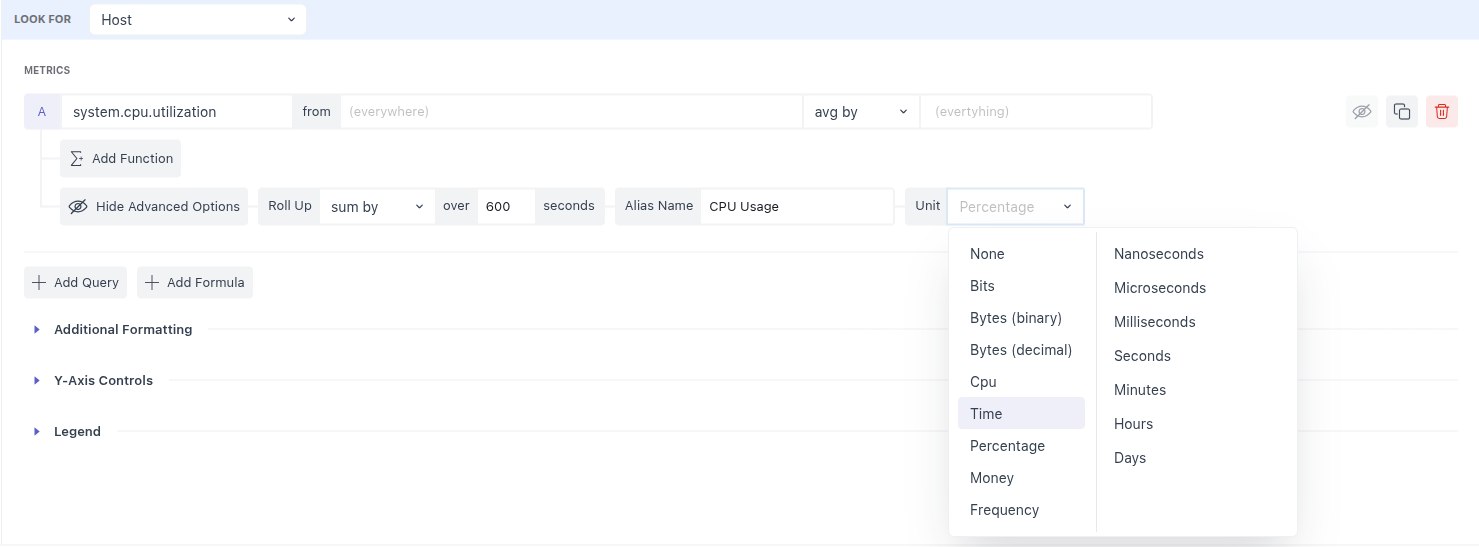
5.2 Unit (override default metric units)
Most metrics ship with a default unit (for example, system.cpu.utilization renders as %). You can override this if your reporting requires different semantics. Open Show Advanced Options, locate Unit, and choose from the dropdown. The widget immediately interprets and displays values using this unit.
5.3 Visual Config
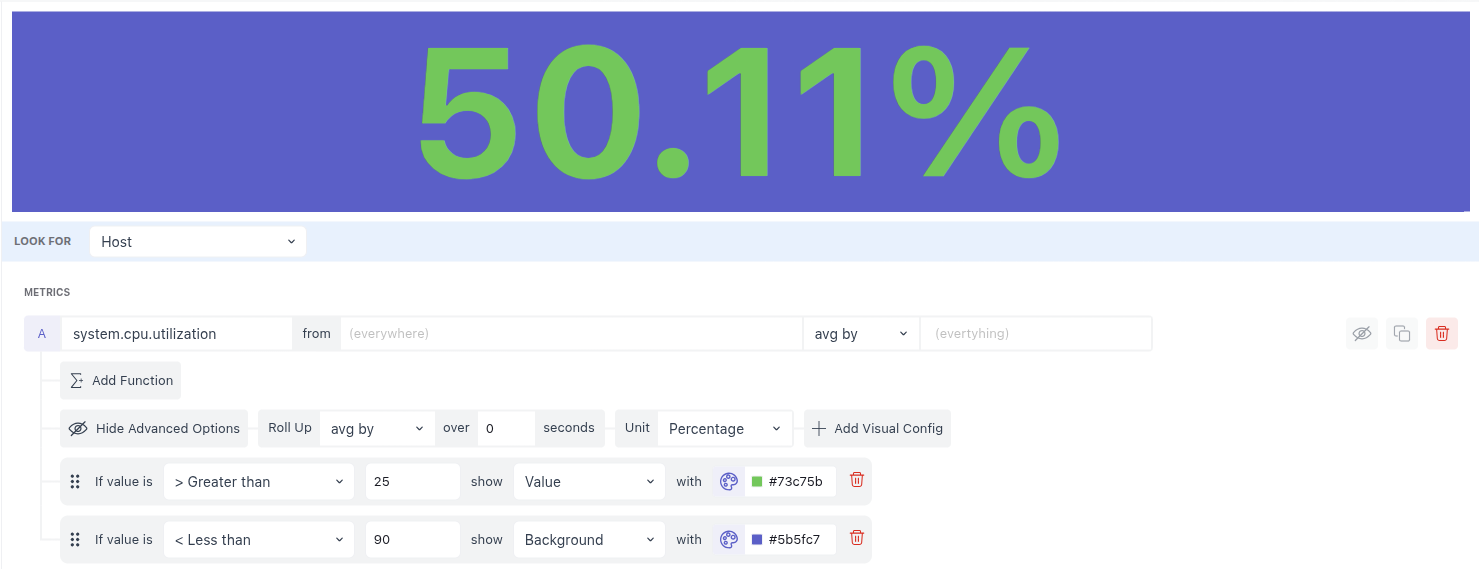
In the Query Value graph, you can customize the color of the value and the background based on specific conditions using the Visual Config rules.
How to add a Visual Config rule:
- Click the Add Visual Config button to create a new rule.
- In the rule, specify these settings:
- Operator: Choose an operator (like equals, greater than, less than) from the dropdown to compare against the value.
- Value: Enter the number or value you want to compare the metric against.
- Apply Color To: Select whether the color should change for the value itself or the background behind the value.
- Color: Pick the color you want to apply, either by entering a hex code or selecting from the color picker.
Compare data with the previous time period
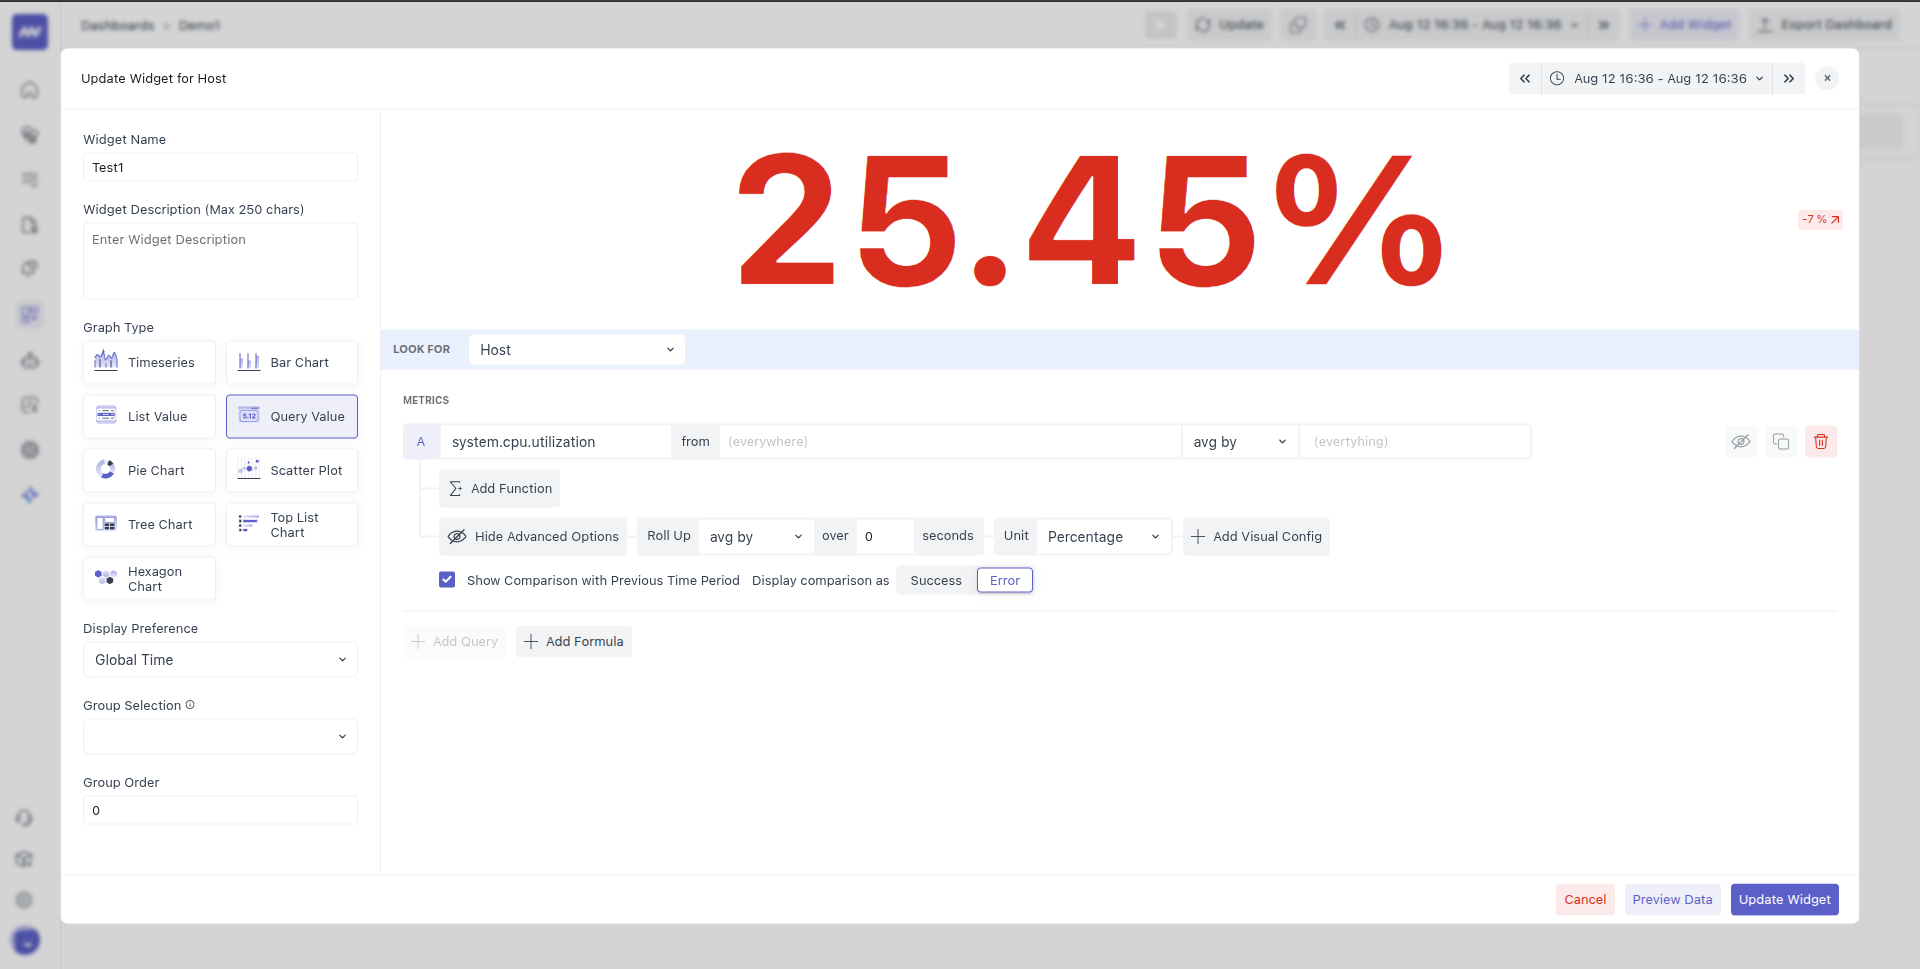
In the Query Value graph, you can also show the percentage change compared to the previous time period.
Example:
- Last hour's metric value: 25.45
- Last-to-last hour's metric value: 27.46
- Change: ~7.3% decrease (shown in the mid‑right corner of the graph)
How to enable this:
- Check the Show Comparison with Previous Time Period checkbox.
- Use the Success / Error tabs next to the checkbox to decide how the change should be displayed.
JSON Format
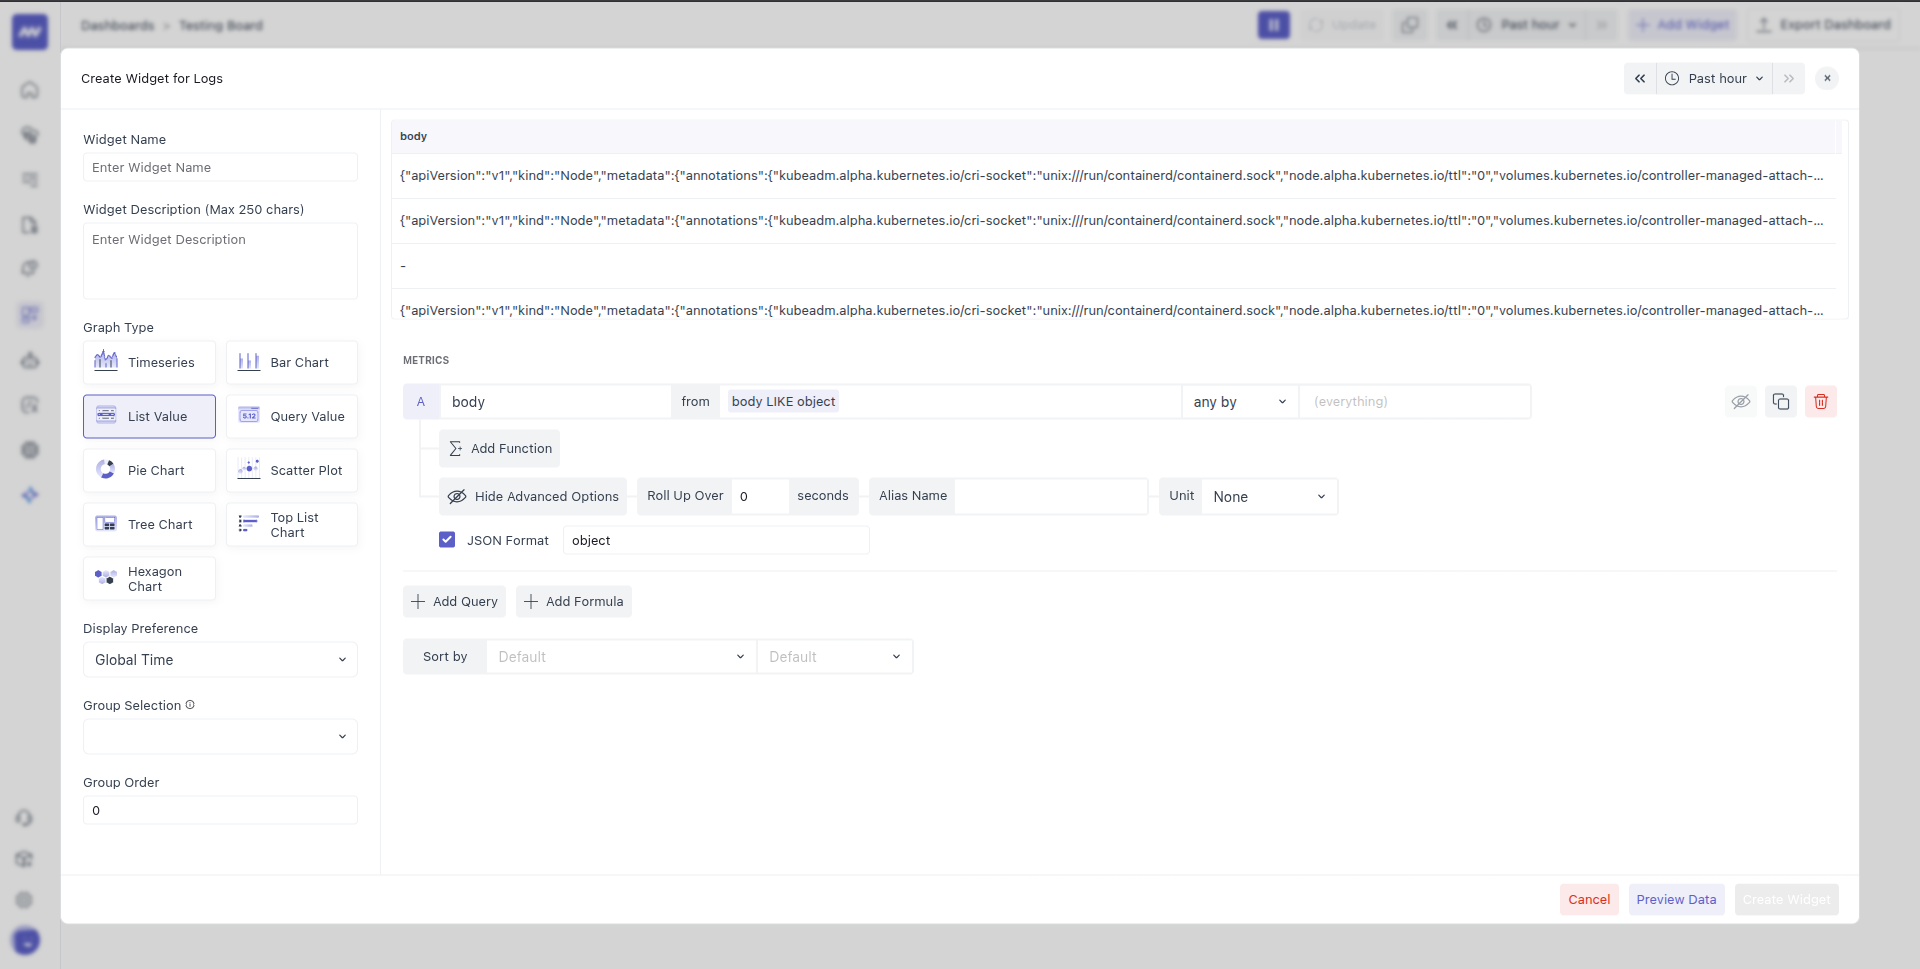
In the List graph, if the data is in JSON format (for example, a log body or message), you can extract and display the value of a specific field.
How to use JSON Format:
- Check the JSON Format checkbox.
- In the input box next to it, type the field name whose value you want to extract from the JSON.
The widget will then display the value from that specific JSON field as the complete value in the list.
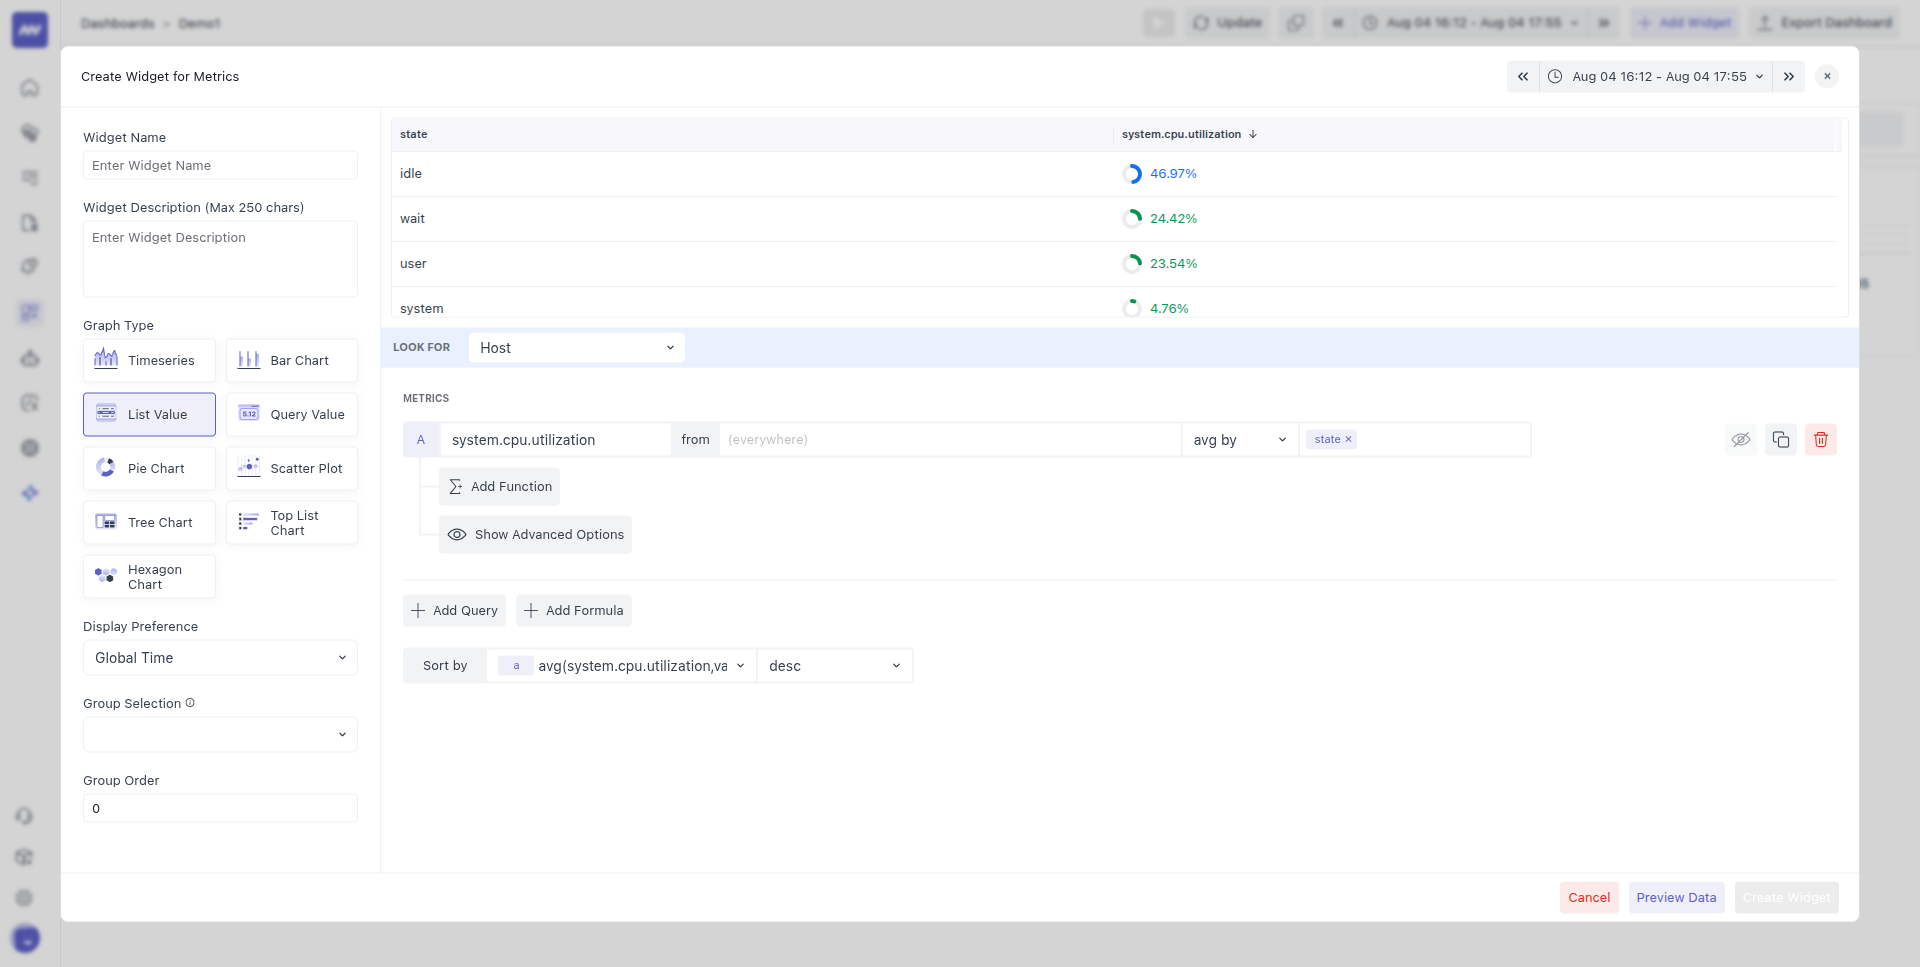
Sort Data
In the List Value graph, you can sort the displayed data by clicking the column headers in the table. This lets you quickly reorder the rows based on a metric or group name. However, this sorting only applies temporarily and will reset when you reload the page.
To make the sorting persistent across page reloads, use the Sort By dropdown menus: - First Dropdown: Select the metric or group name by which you want to sort the data. - Second Dropdown: Choose the sorting order, such as ascending or descending.
Limit Data
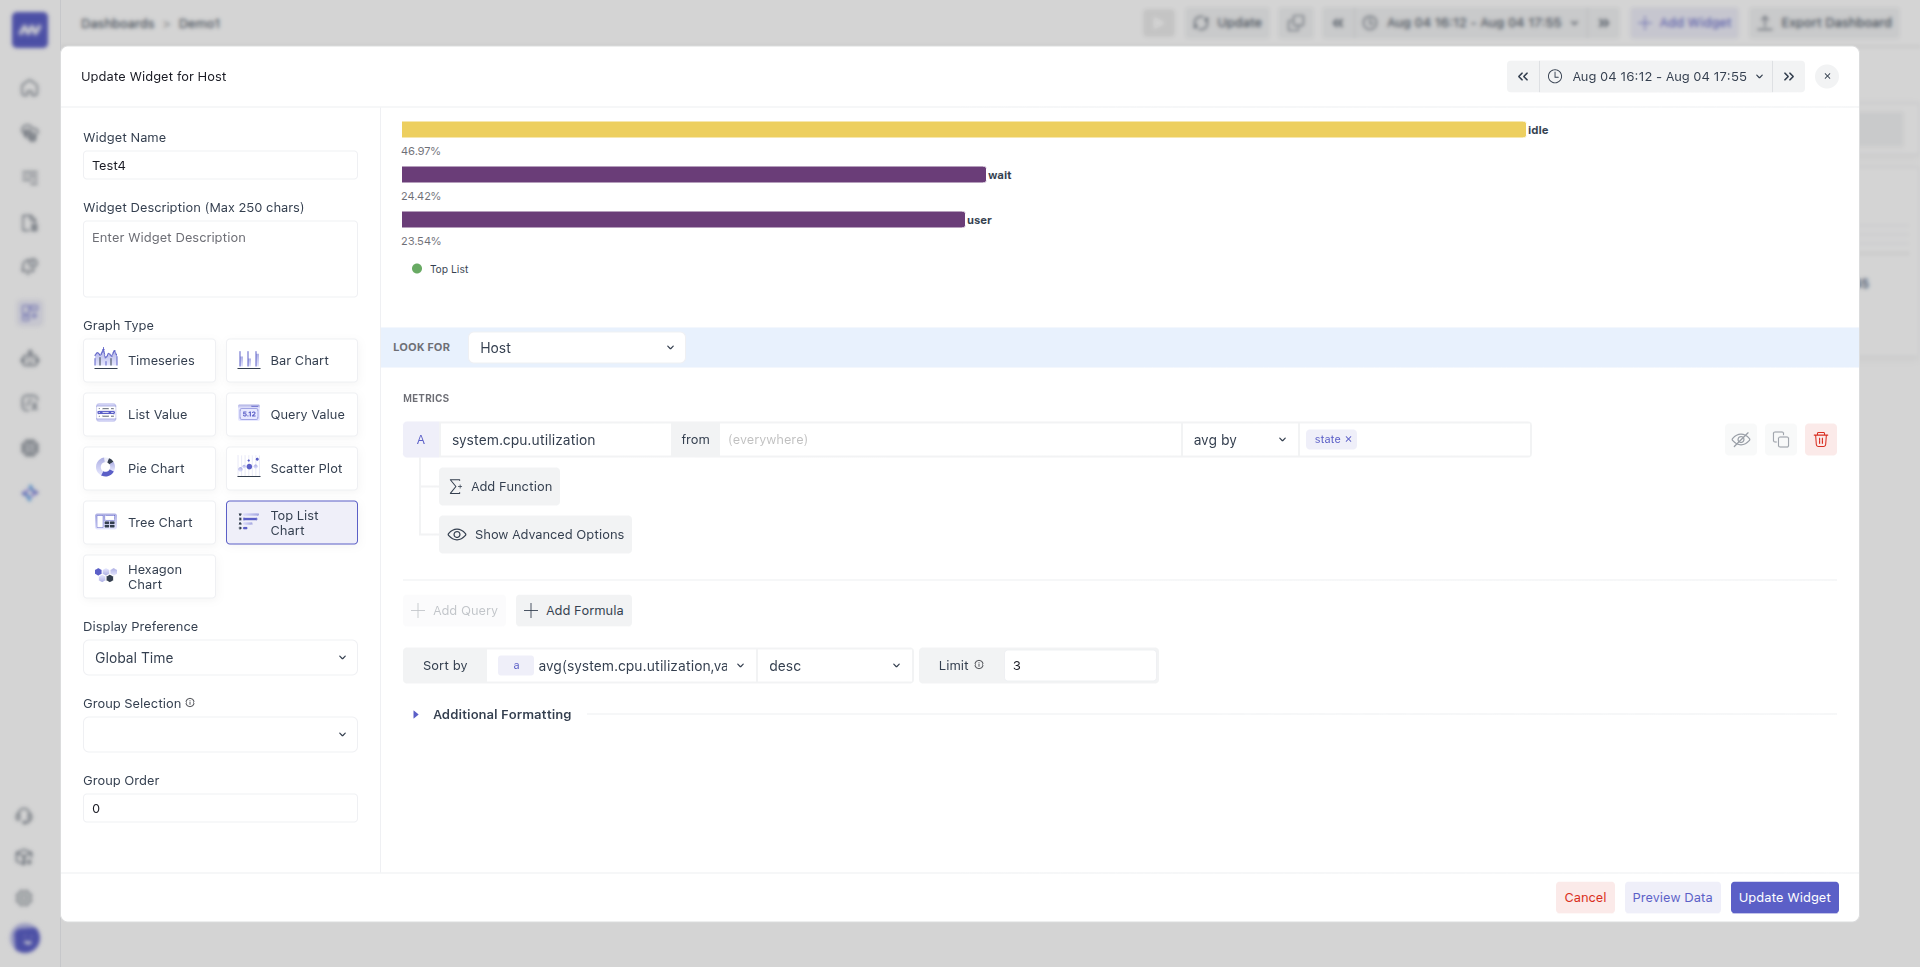
In the Top List graph, you can control how many values are displayed by setting a number in the Limit input box.
6. Additional Formatting
This section gives you various options to customize how your data appears in the graph.
Many of these formatting options are designed for specific graph types, so you may not see all options available for every graph. The options shown will depend on which type of graph you selected.
6.1 Display Options
You can choose from multiple display options to fine tune the graph according to your preference.
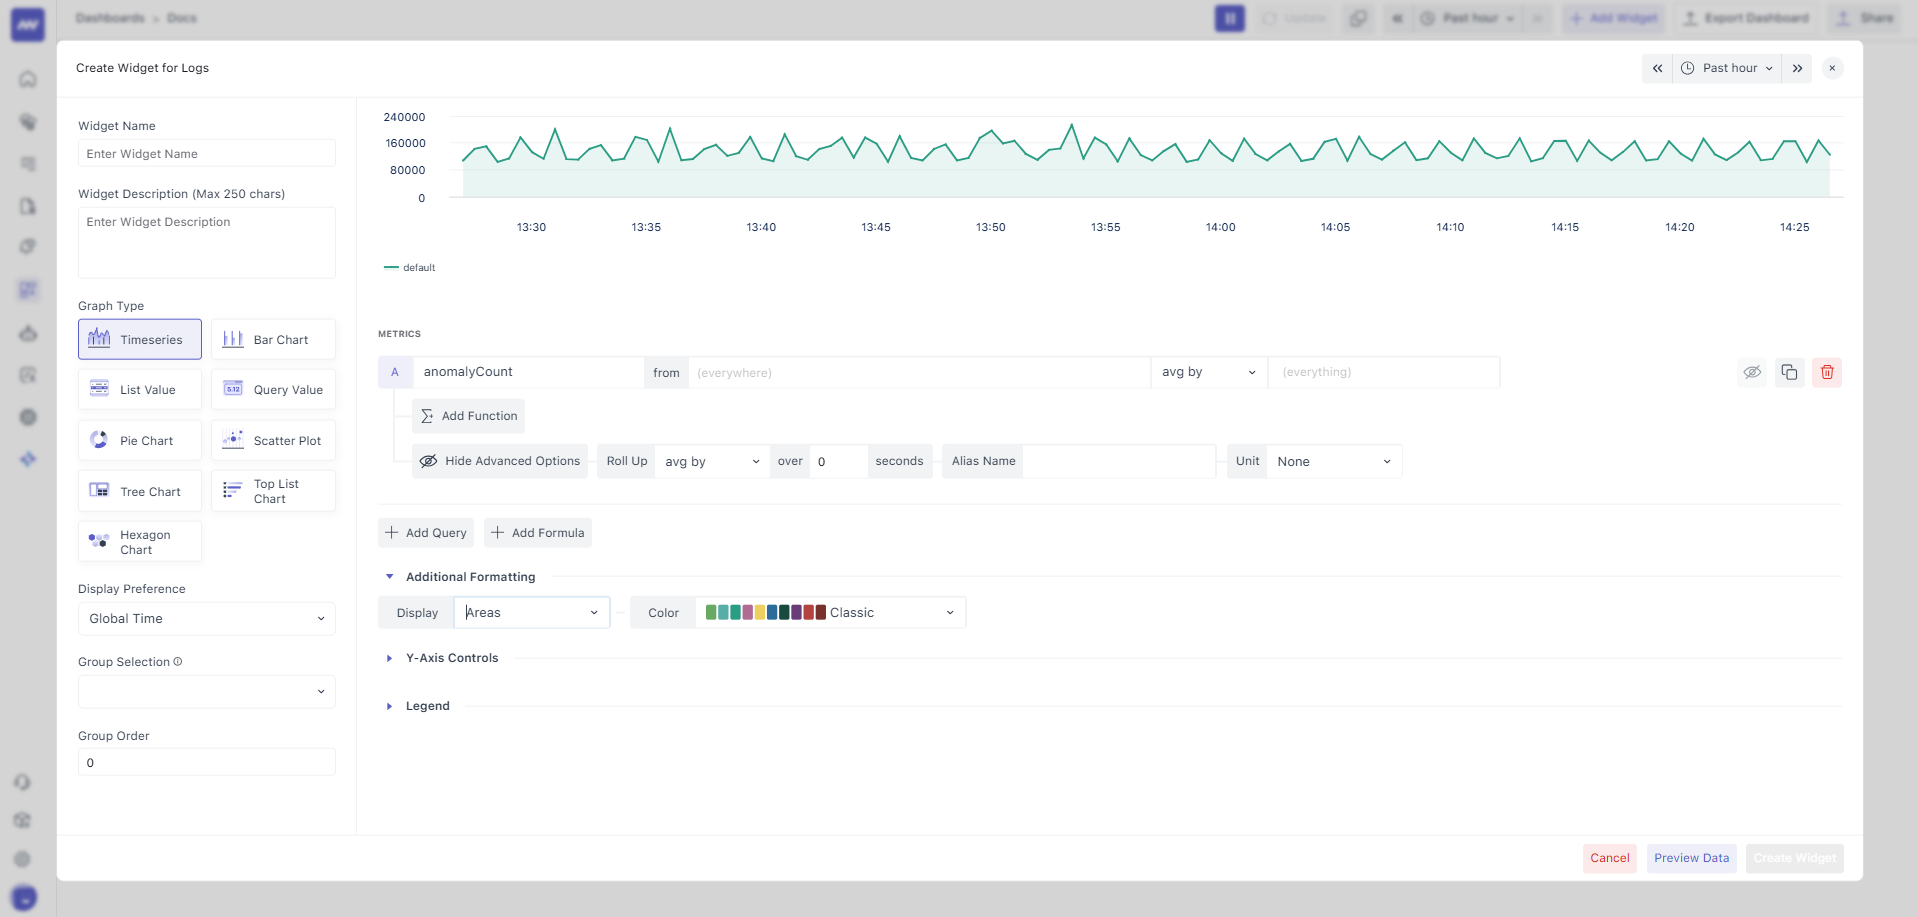
- Timeseries Graph: You can choose how to show your data as either Lines (the default) or Areas.
- Lines: Displays your data as connected points forming a line, showing trends over time clearly.
- Areas: Fills the space underneath the line with color, helping to highlight the volume or magnitude of values over the timeline.
- Bar Graph: You can display your data in Bars (default) or Stacked Bars.
- Bars: Shows each data series as separate side-by-side vertical bars.
- Stacked Bars: Layer different data series on top of each other within the same bar, helping you see the total combined value as well as the contribution of each part.

Style
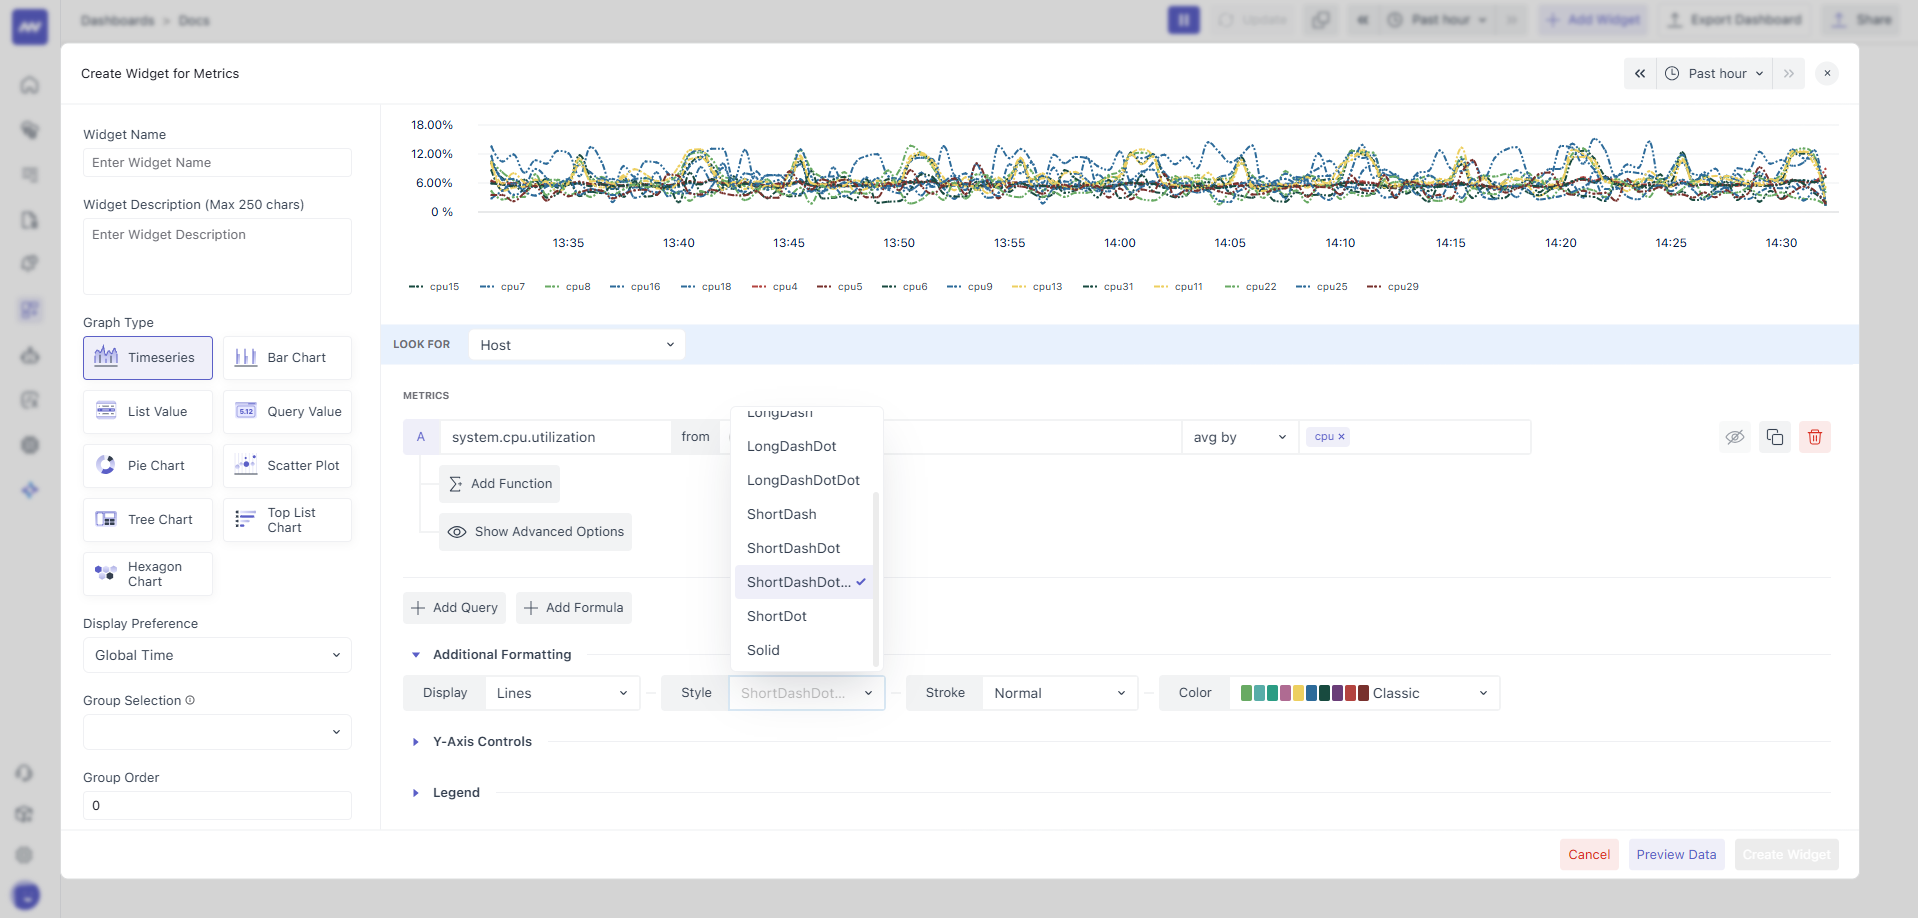
When using the Lines display type in your timeseries graph, you can customize the appearance of the line by choosing one of the following styles:
- Dash
- DashDot
- Dot
- LongDash
- LongDashDot
- LongDashDotDot
- ShortDash
- ShortDashDot
- ShortDashDotDot
- ShortDot
- Solid (default)
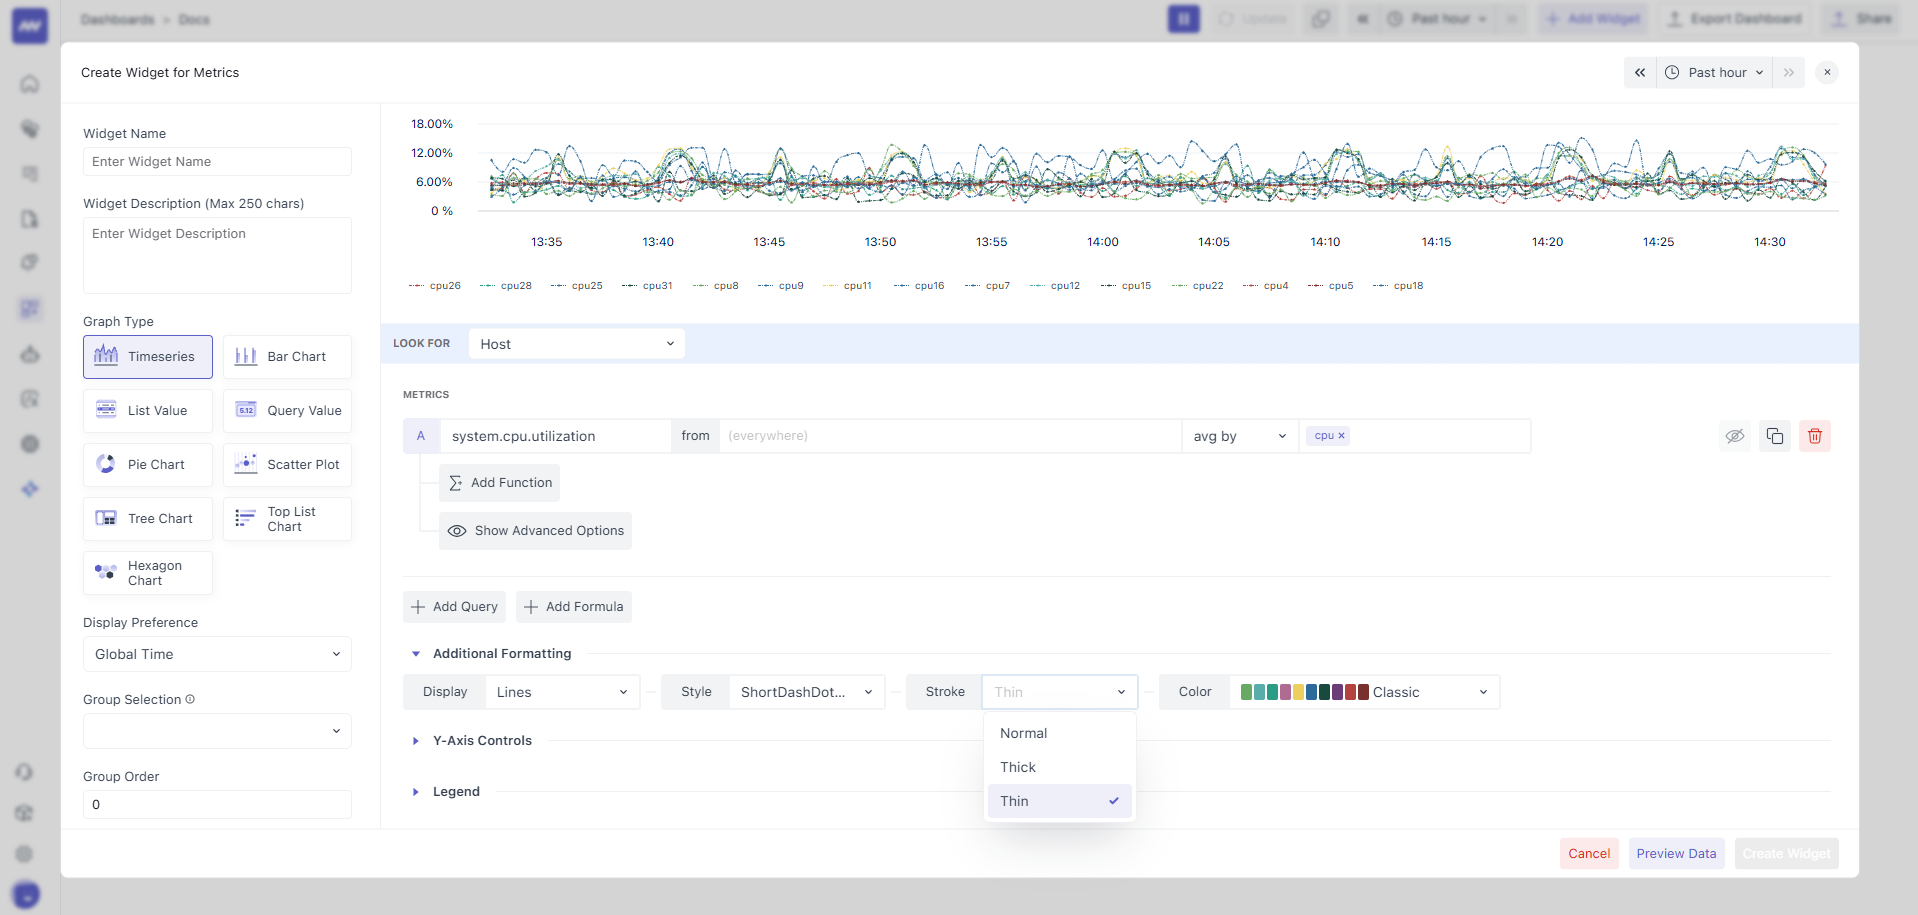
Stroke
You can adjust how thick or thin the line appears in your graph by changing the stroke width. The available options are: Normal (Default), Thick, or Thin.
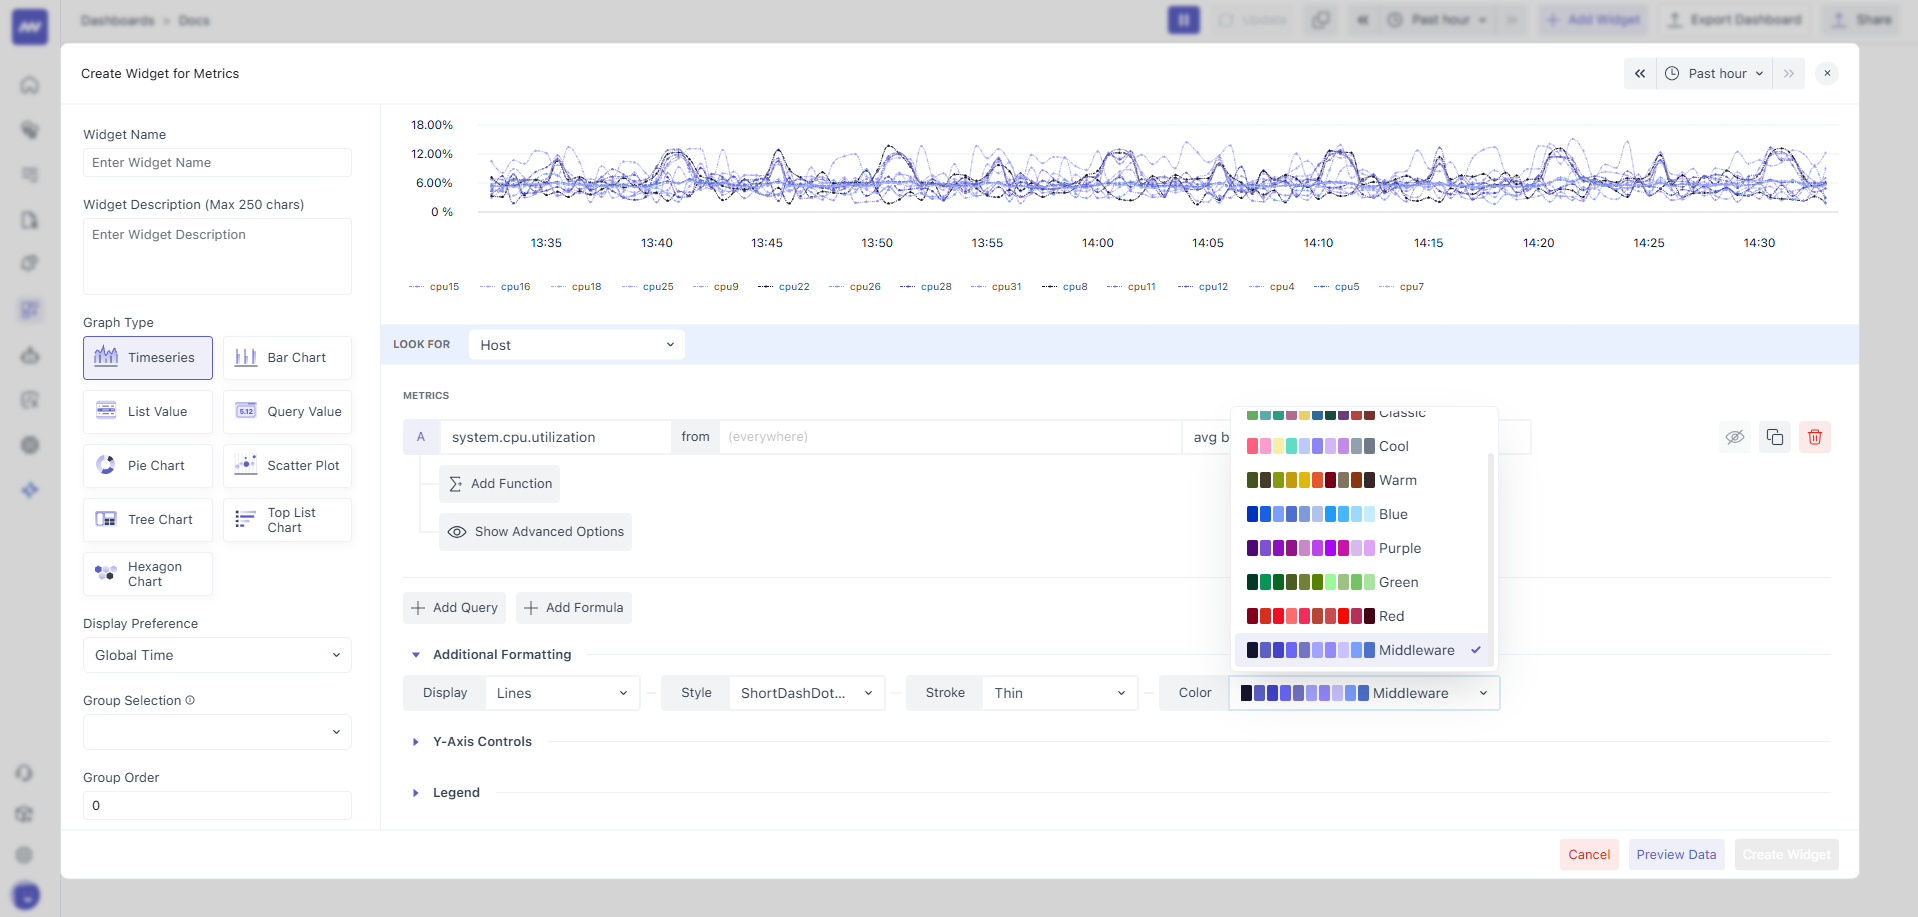
Color
You can change the set of colors your graph uses by selecting a different color palette. This palette controls the colors applied to the lines, areas, bars, or other visual elements in your graph.
6.2 Y-Axis Controls
In the timeseries or bar graph, you can configure the Y-axis as per your needs and data.
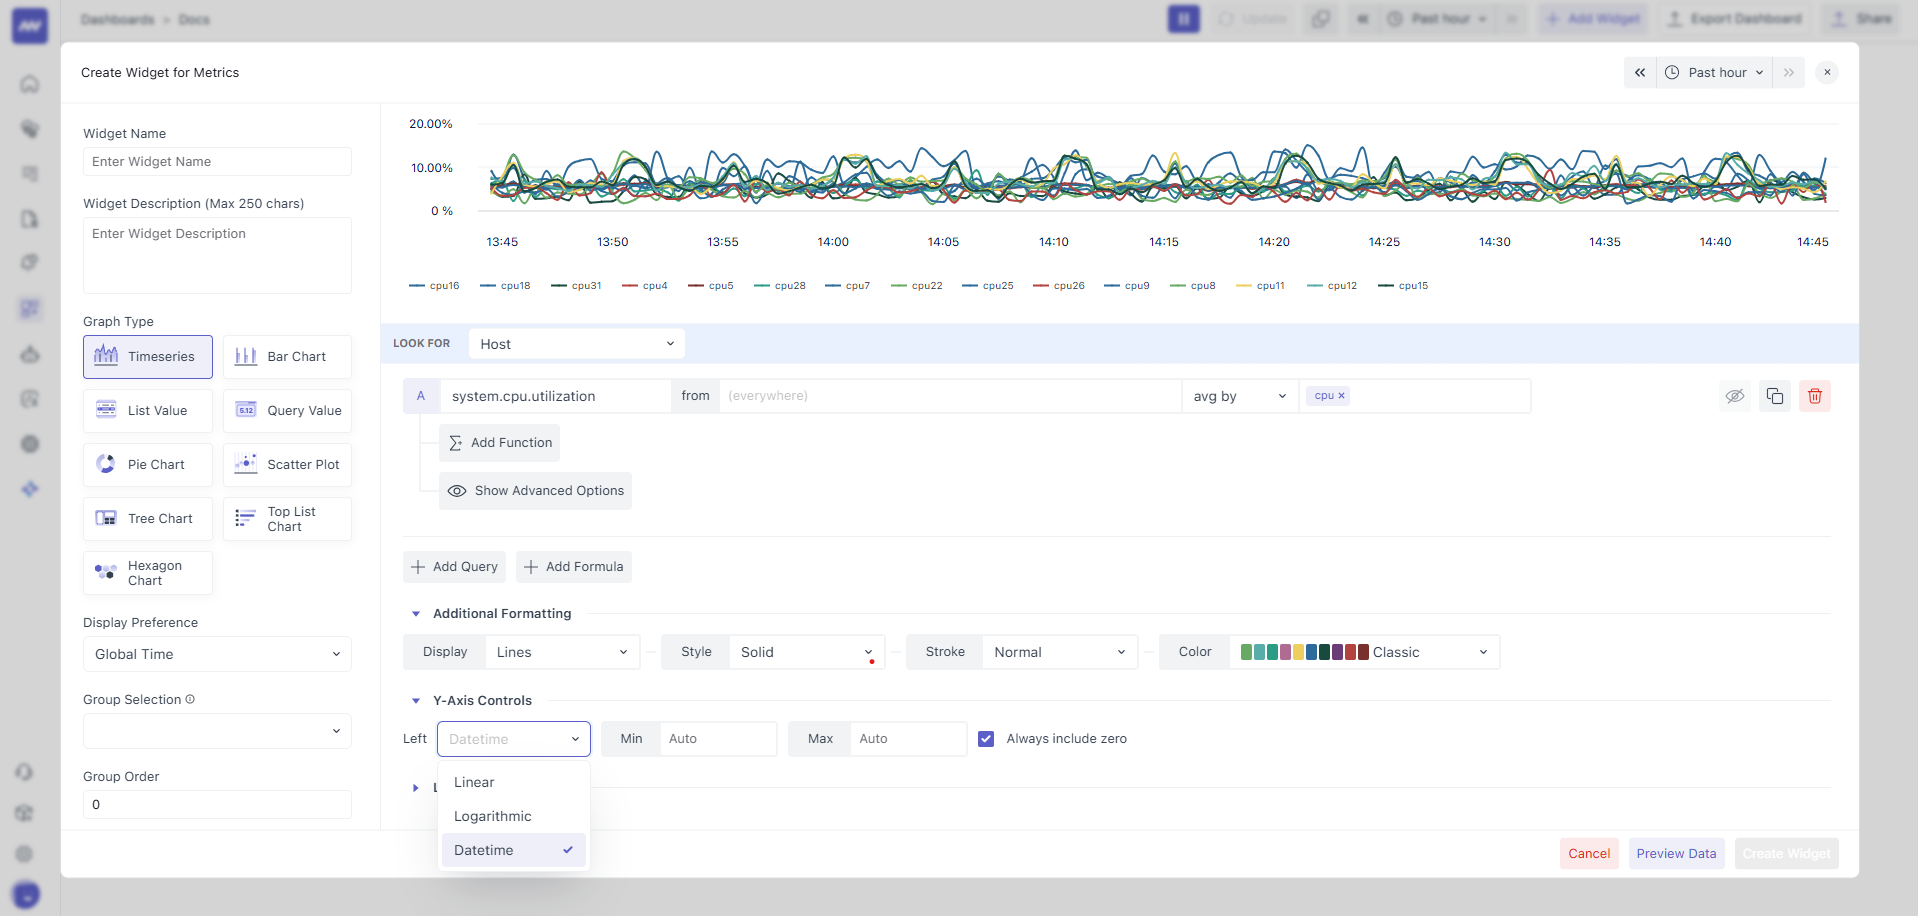
Scale Type
Choose how values on the Y-axis of your graph are scaled. The available scale types are:
- Linear (Default): Values increase in equal steps. Useful for most metrics. Example: 10, 20, 30, 40
- Logarithmic: Each step increases by a fixed factor (not a fixed difference). Good for data that spans wide ranges, like exponential growth or multiplicative change. Example: 0.1, 1, 10, 100, and so on.
- Datetime: Y-axis values represent time periods, useful if your metric is duration or timestamp-based. Example: 0.1 secs, 1 min, 10 mins, etc.
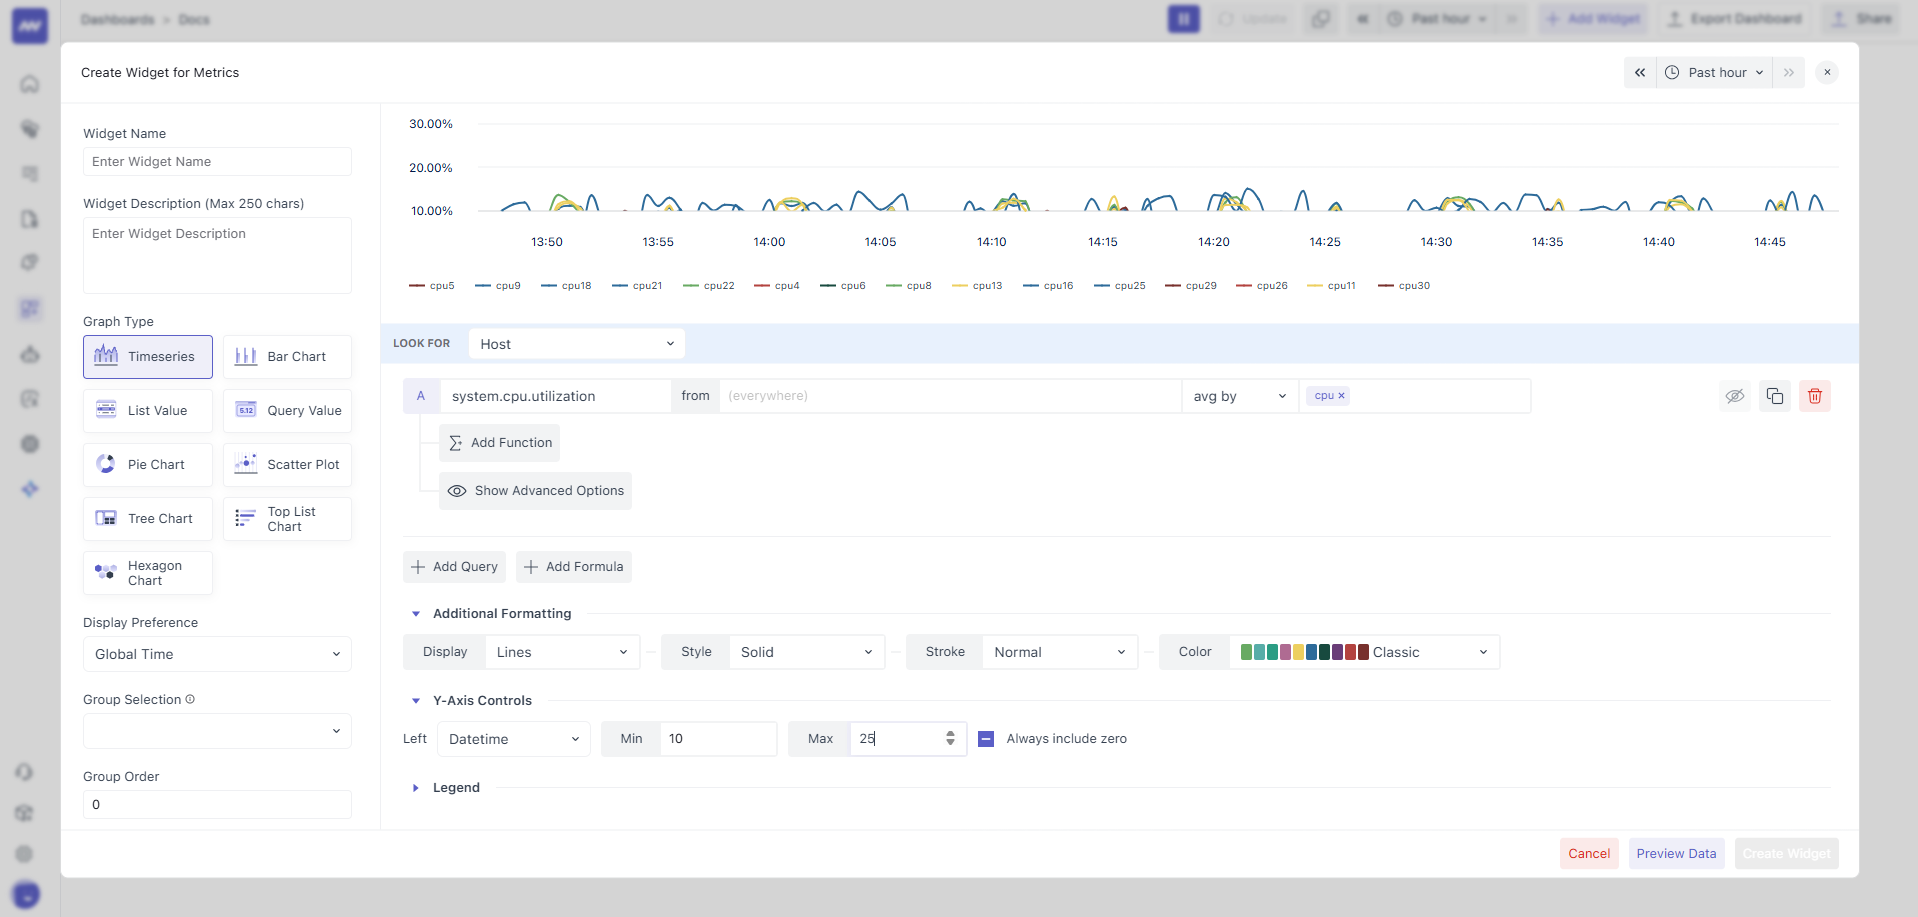
Min/Max
You can set the minimum and/or maximum value for the Y-axis in your graph. By default, the Y-axis range is set to Auto, adjusting automatically to fit your data.
Even if you set a minimum or maximum, the graph may sometimes show values slightly outside your range to display data accurately and avoid distortion.
Always include zero
If you have not specified a minimum value, you can select the Always Include Zero checkbox. This will force the Y-axis to start at zero, making it easier to compare values relative to a zero baseline.
6.3 Legend
By default, your graph displays legends at the bottom-left corner that help you identify different groups of data. Legends are especially useful when you have multiple data groups and need to quickly understand what each represents.
You can choose from three different legend formats:
- Compact (Default): Shows only the group name for each data series.
- Extended: Shows the group name plus detailed statistics, including minimum, maximum, average, and sum values for each group in a table format. You may need to scroll within the graph area to see the complete table.
- None: Hides the legend completely.
You can temporarily hide specific data groups by clicking on their name in the legend. This is helpful when you want to focus on certain data series or reduce visual clutter. Click the legend name again to show the data group.

Need assistance or want to learn more about Middleware? Contact our support team at [email protected] or join our Slack channel.