Notebooks
Notebooks is a lightweight space inside Logs where you can write quick notes and keep them alongside live data. It is useful when you want to document an investigation, capture observations, or build a short narrative that includes charts or tables powered by your logs. Right now, Notebooks focuses on the essentials:
- Text blocks
- Headings (H1, H2)
- Numbered and bullet lists
- Tables
- Data sources
Open Notebooks#
To open Notebooks, go to Logs → Select Notebooks from the top navigation. Here, you will find list of previously created Notebooks in addition to option for creating a new Notebook.
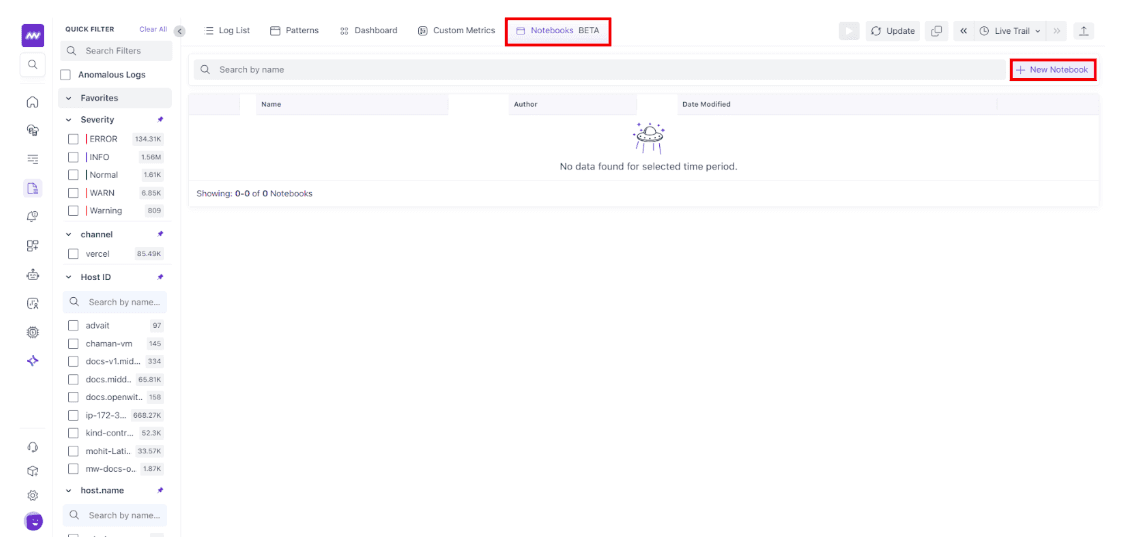
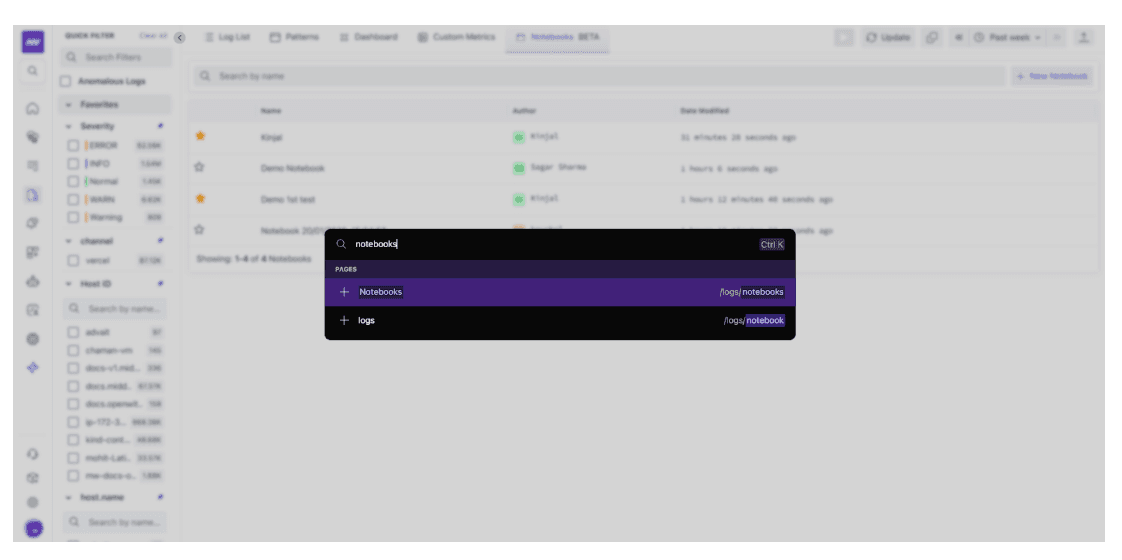
Alternatively, you can also use the Search by name input to quickly find a notebook.
Create a new Notebook#
- In Notebooks, click New Notebook
- Enter a notebook name at the top
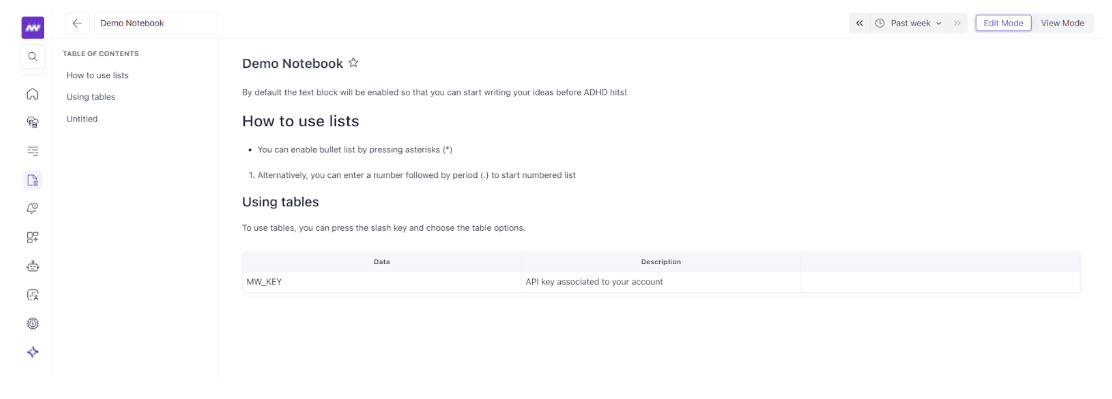
- Start writing in the first text block
As you add headings, the Table of Contents on the left updates automatically so you can jump between sections.
Manage your saved notebooks#
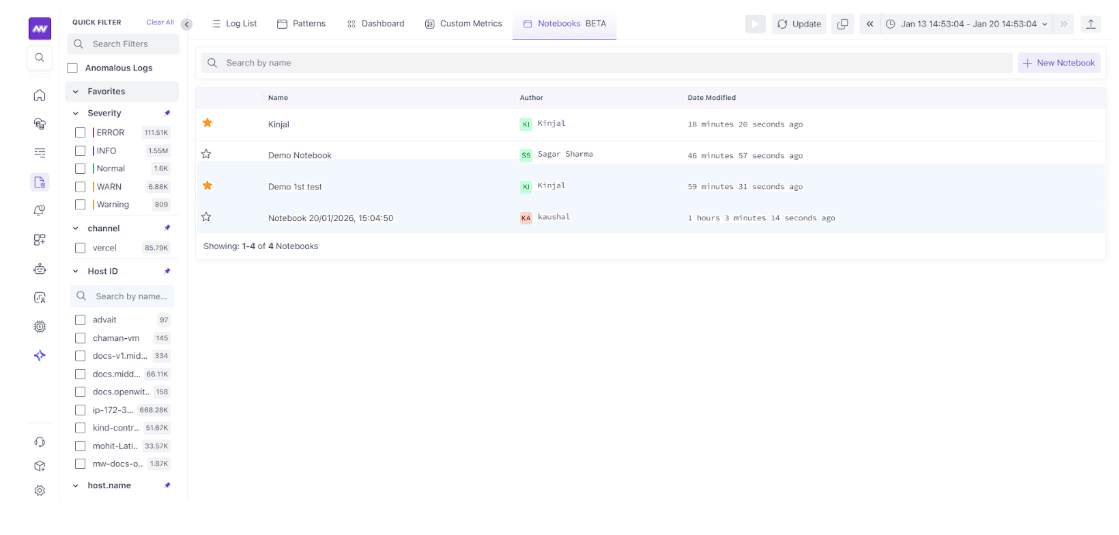
The Notebooks list helps you quickly understand what exists and who owns it:
- Name: Notebook title
- Author: Who created or last edited it
- Date Modified: When it was last updated
- Star icon: Mark a notebook as a favourite for quicker access later
Use the search bar to filter the list by notebook name.
Write and format content#
Notebooks support simple formatting so you can keep notes readable without needing heavy markdown.
Headings#
Use headings to structure your notebook and keep the Table of Contents clean.
- Use H1 for main sections
- Use H2 for sub sections
Lists#
Use lists when you are capturing steps, findings, or action items.
- Bullet list for quick points
- Numbered list for sequences or runbooks
Tables#
Tables are great for quick reference, like environment variables, endpoints, owners, or incident timelines. To insert a table, type / and choose the table option, then fill the cells.
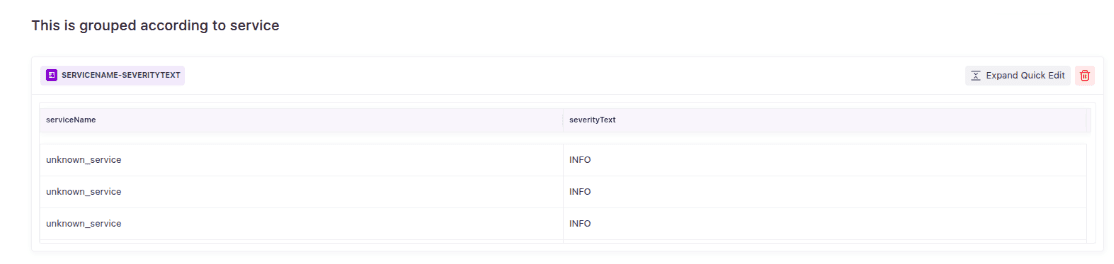
Edit Mode vs View Mode#
Notebooks support two modes so you can write and read comfortably.
A typical flow looks like this:
- Add a data source block in the notebook
- Configure the query and visualisation
- Use Expand Quick Edit when you need to tune the query or change the chart type
- Use the top right time picker to update the time range for the results
Available visualisations#
From the data source editor, you can choose the output style using Graph Type, such as:
- Timeseries
- Bar Chart
- List Value
- Query Value
- Pie Chart
- Scatter Plot
- Tree Chart
- Top List Chart
- Hexagon Chart
Pick the type that matches your goal. For example, Timeseries for trends and List Value for a quick breakdown table.
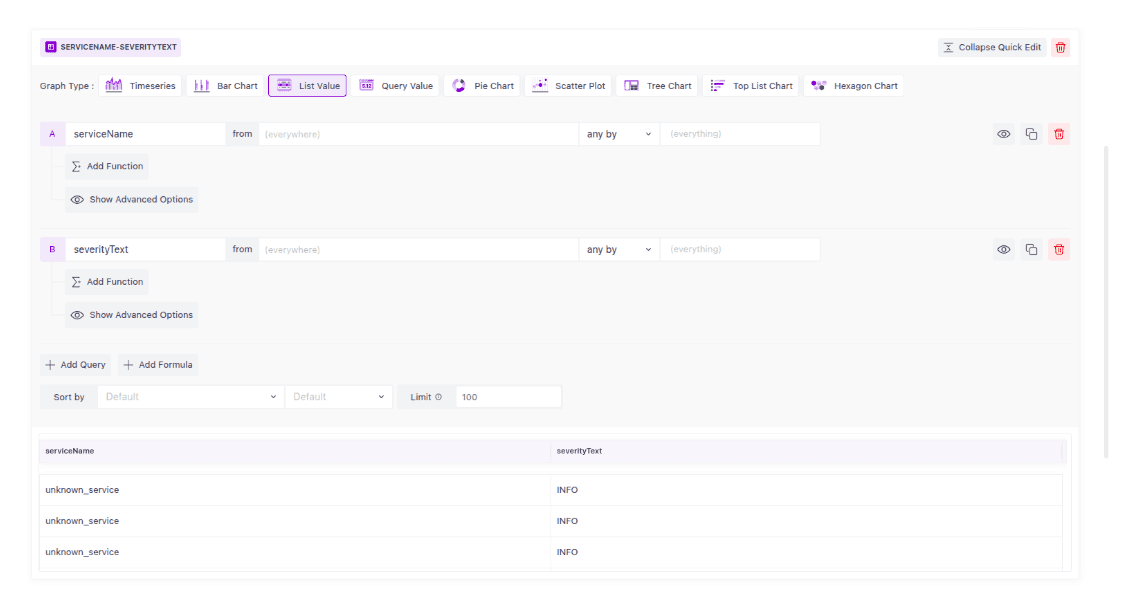
Configure a data source with Quick Edit#
Each data source block includes an Expand Quick Edit option. When expanded, you can adjust what is being queried and how it is shown. Common options you will see:
- Queries (A, B, …): Add one or multiple queries in the same block
- Field selection: Choose what you want to chart or list, like
serviceNameorseverityText - Aggregation: Options like
uniq byorany byhelp you control how results are grouped or calculated - Add Function: Apply functions to shape results further
- Add Query / Add Formula: Build multi query views or derived results
- Sort and Limit: Control ordering and how many rows appear in list outputs
- Formatting controls: Sections like Additional Formatting, Y-Axis Controls, and Legend help tune chart readability
Each query row also includes quick actions like:
- Hide or show a query
- Duplicate a query
- Delete a query
You can also delete the entire data source block from the notebook when you no longer need it.
Next Steps#
- Log Monitoring Overview
- Creating Log Filters
- Custom Metrics
- Transforming Logs into Transactions
- Creating Alerts
- Real User Monitoring (RUM)
Need assistance or want to learn more about Middleware? Contact our support team at [email protected] or join our Slack channel.