AI-Powered Dashboard Builder
Middleware’s AI dashboard builder lets you create complete dashboards or individual widgets using plain-English prompts. Instead of manually configuring the dashboard, you can describe what you want to monitor, and the AI generates a production-ready layout with relevant widgets.
Before you begin#
To generate meaningful dashboards, Middleware must already be receiving the underlying telemetry.
- Integrations must be connected (for example, Kubernetes, AWS, NGINX, Postgres).
- APM and framework dashboards require instrumentation. If the application is not instrumented and traces are not being ingested, AI cannot create accurate APM widgets for that service.
- Logs and metrics dashboards require ingestion. If logs or metrics are not coming in for the selected environment, widgets may appear with no data.
If you see empty graphs or “No data found”, first confirm data ingestion and then adjust the time range.
Create a dashboard using a prompt#
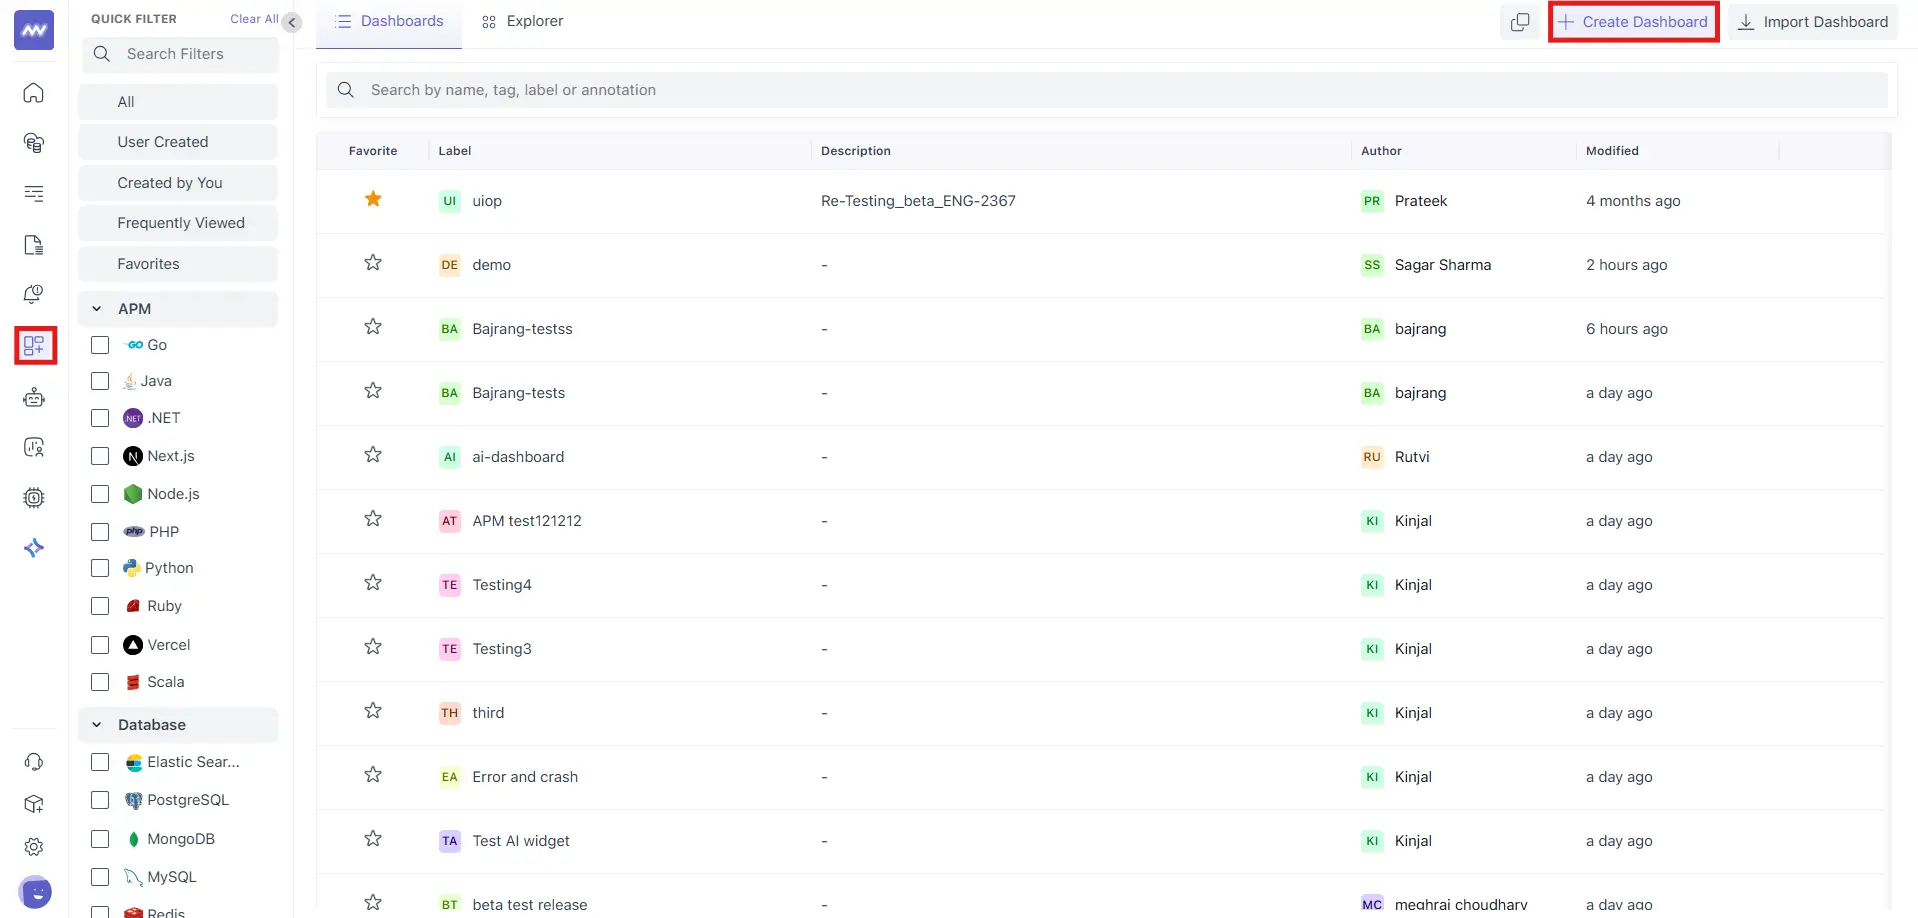
1 Go to Dashboards → Create dashboard#
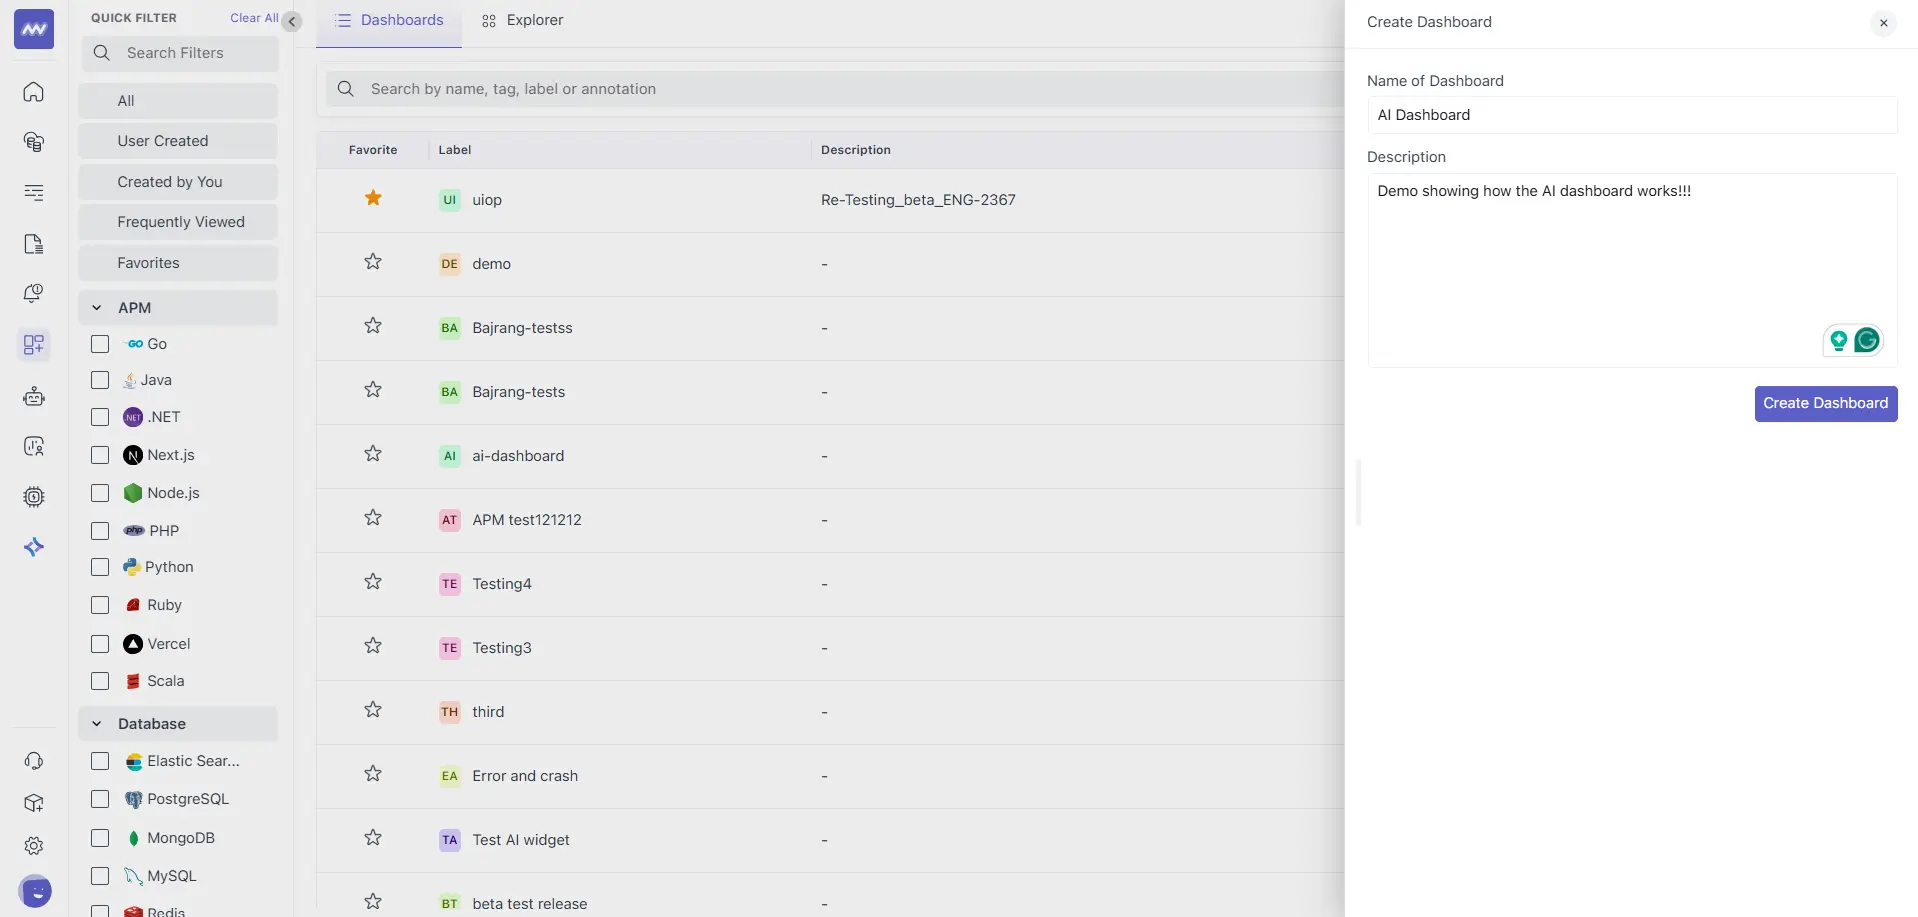
2 Now you will be asked to name the dashboard, and optionally you can provide a description as well:#
3 In the prompt box, describe your monitoring objective, for example:#
- “Create widgets that provide a clear overview of log activity, error behaviour, and anomaly patterns across all services.”
- “Create a Kubernetes health dashboard for nodes, pods, CPU, memory, and network.”
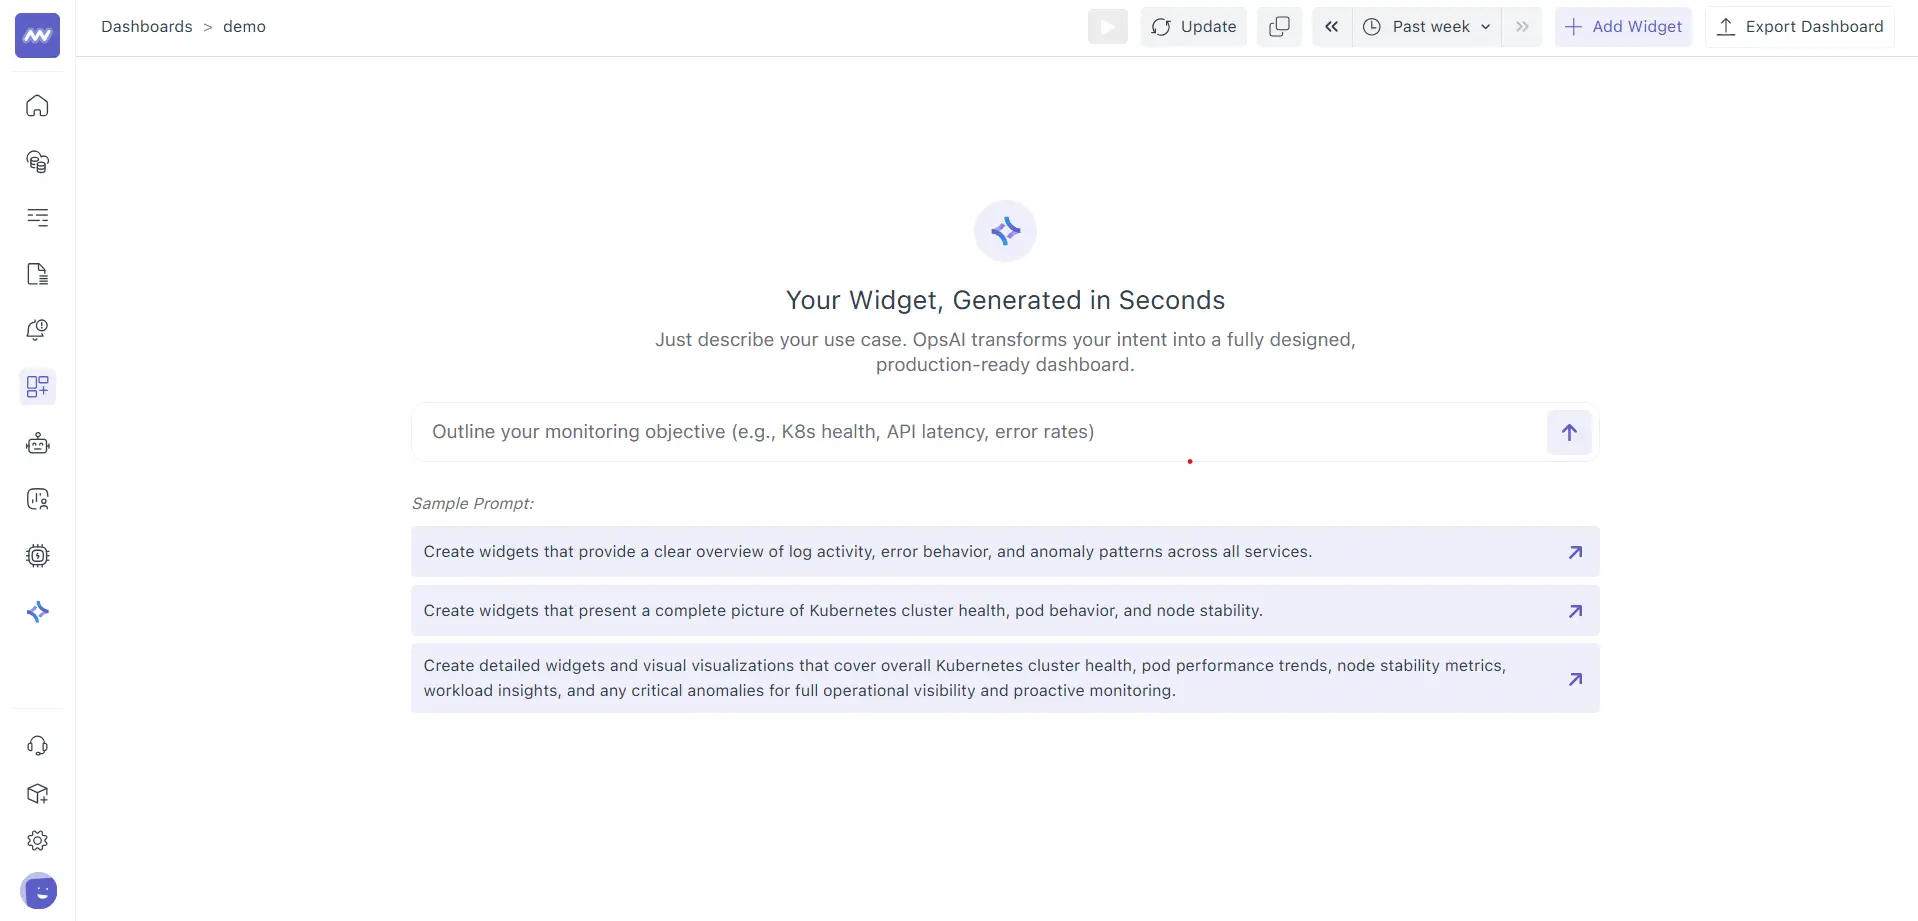
4 Submit the prompt.#
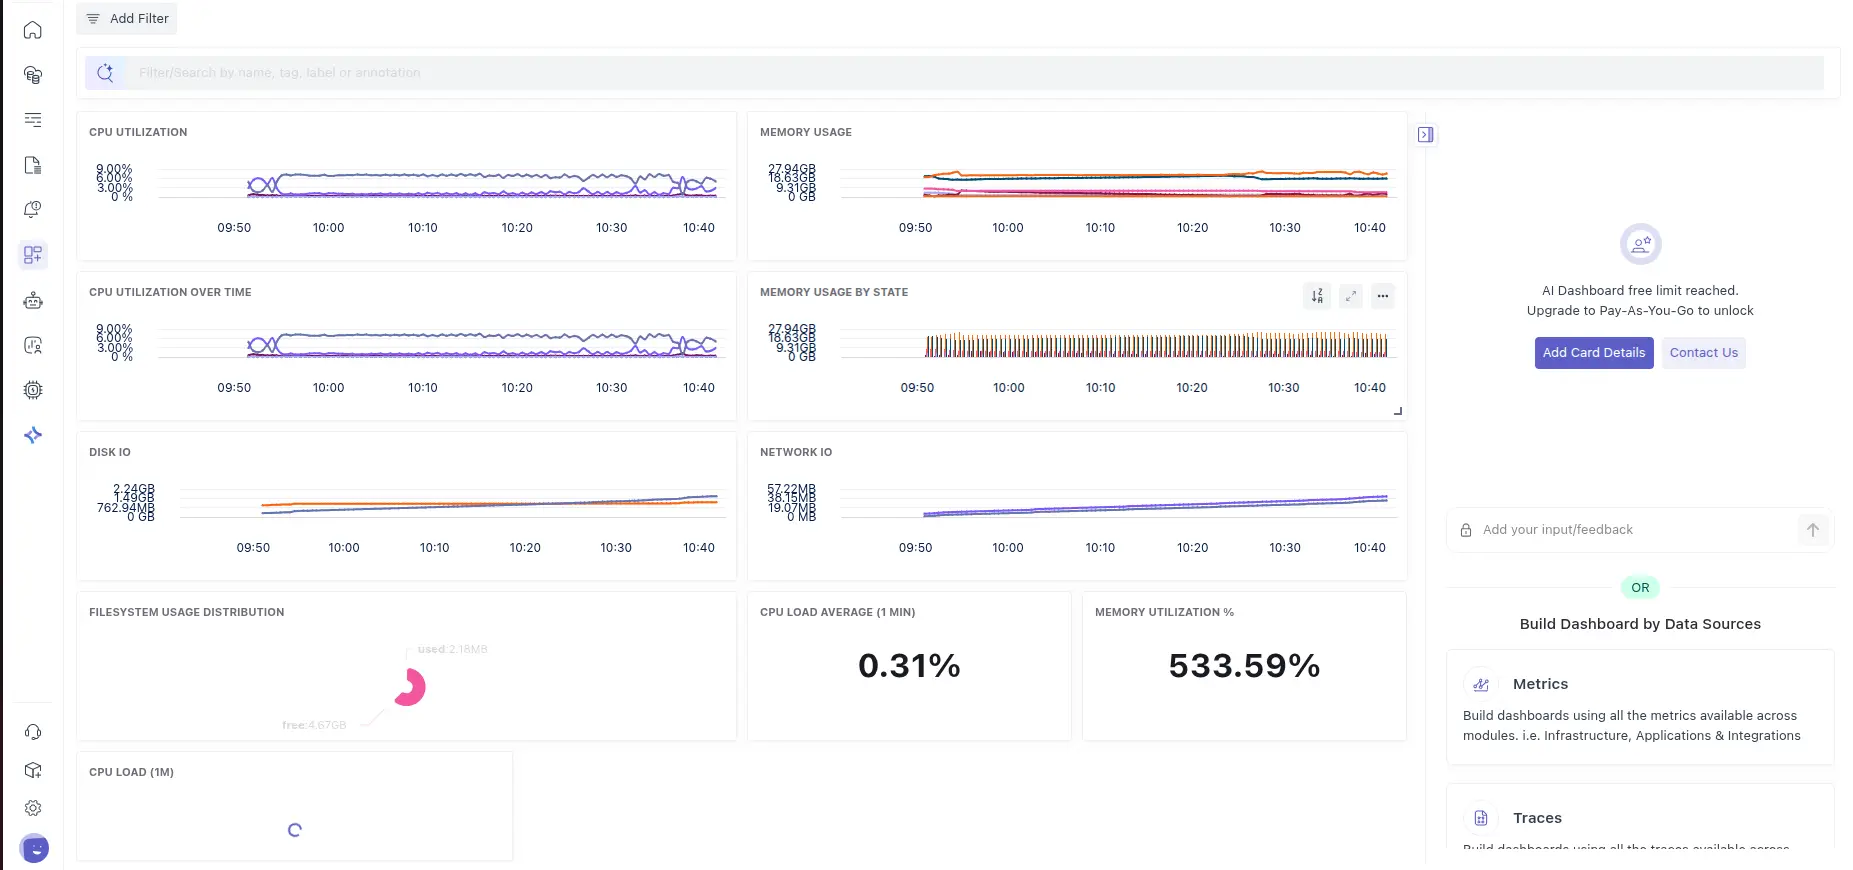
Once generated, the dashboard appears with:
- A set of widgets is laid out automatically
- An AI summary panel describing what was created and why
- Standard dashboard actions like Update, time range selection (for example, Past week), Add Widget, and Export Dashboard
Create a Specific Widget Inside an Existing Dashboard#
You can also build widgets incrementally.
- Open an existing dashboard.
- In the AI prompt panel, describe the widget you want, for example:
- “Add a widget for log volume by service.”
- “Add an errors by service widget for the last week.”
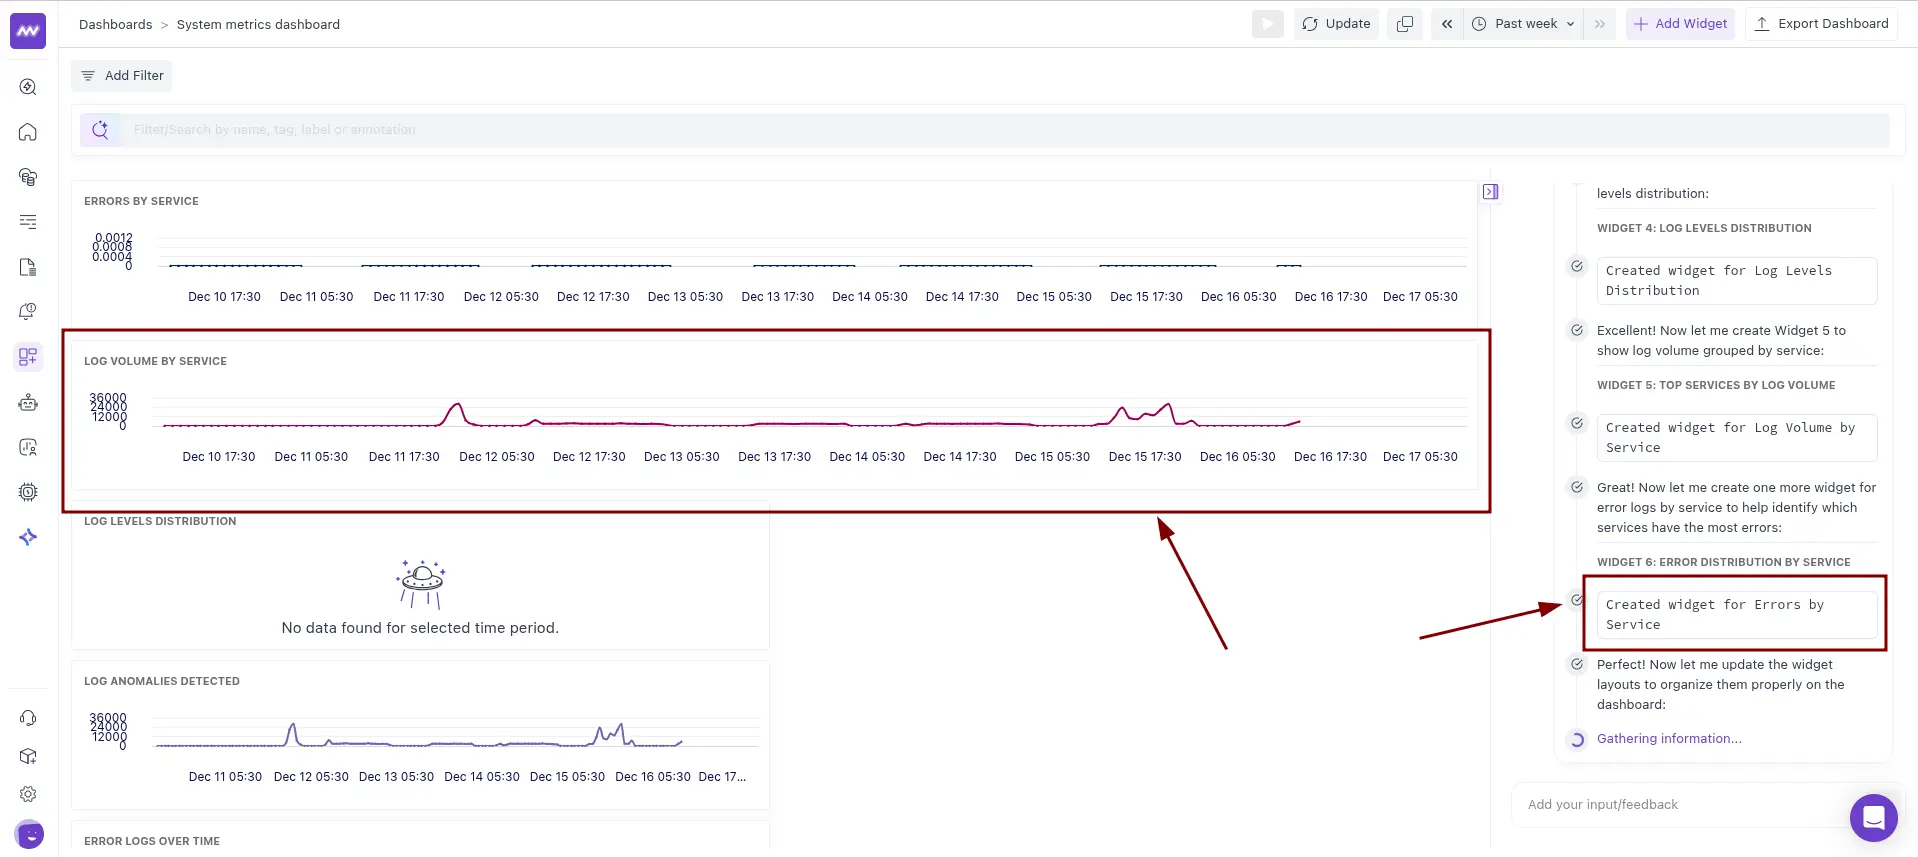
- Submit the prompt.
The new widget is added to the dashboard, and the AI panel confirms what was created, so you can continue iterating.
Filtering in AI dashboards#
Filters help you narrow the data shown across all widgets in the dashboard.
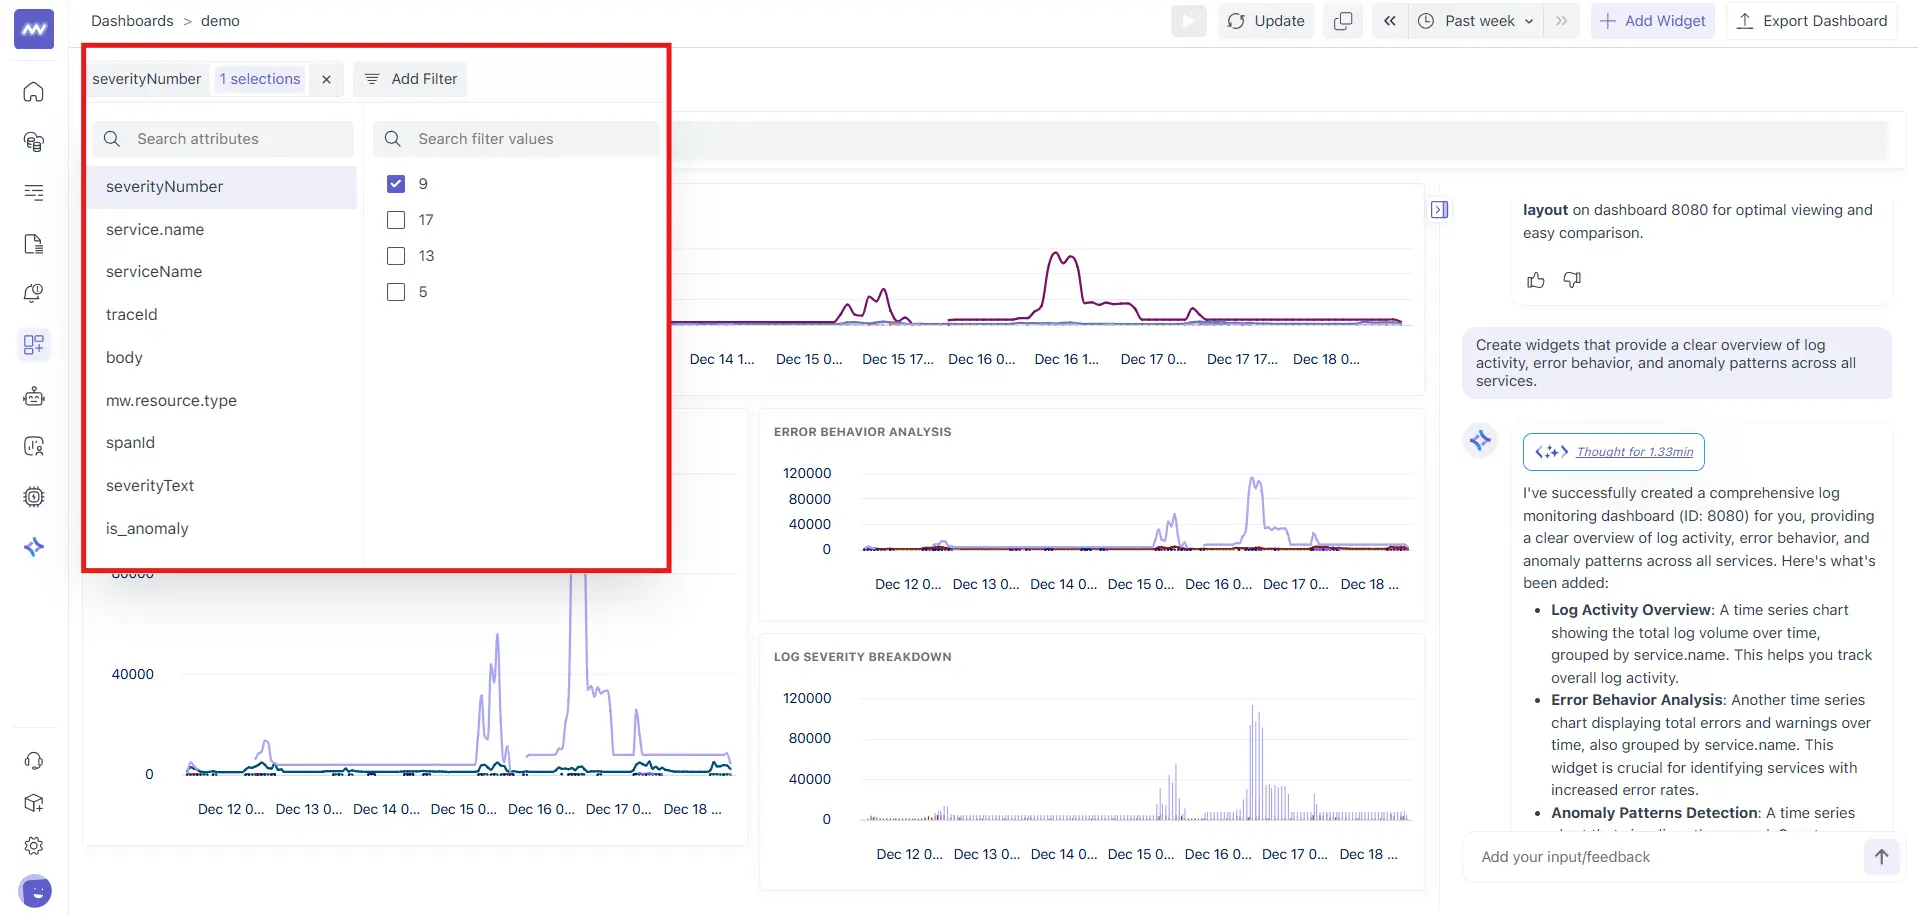
Add a filter#
- Click Add Filter.
- Choose an attribute (you can search attributes), for example:
severityNumberservice.nametraceIdspanIdseverityTextis_anomaly
- Select one or more filter values (you can search for values).
- Close the filter picker to apply.
Add Multiple Filters#
- Use Add Filter again to stack more conditions and narrow the dashboard further.
- Use the Filter/Search bar to quickly find by name, tag, label, or annotation.
If you are building a dashboard for logs, filtering by attributes like service.name and severityNumber is an easy way to isolate noisy services or focus only on high-severity events.
Need assistance or want to learn more about Middleware? Contact our support team at [email protected] or join our Slack channel.