Databases
The Databases tab lists every monitored database instance. Each instance opens a detail panel with its health overview, metrics, top queries, and logs. Open it from APM → Database → Databases.
Instance List#
Instances are grouped by engine. When more than one engine is configured, each group is a collapsible PostgreSQL or MongoDB section. Use the search bar to find an instance by name.
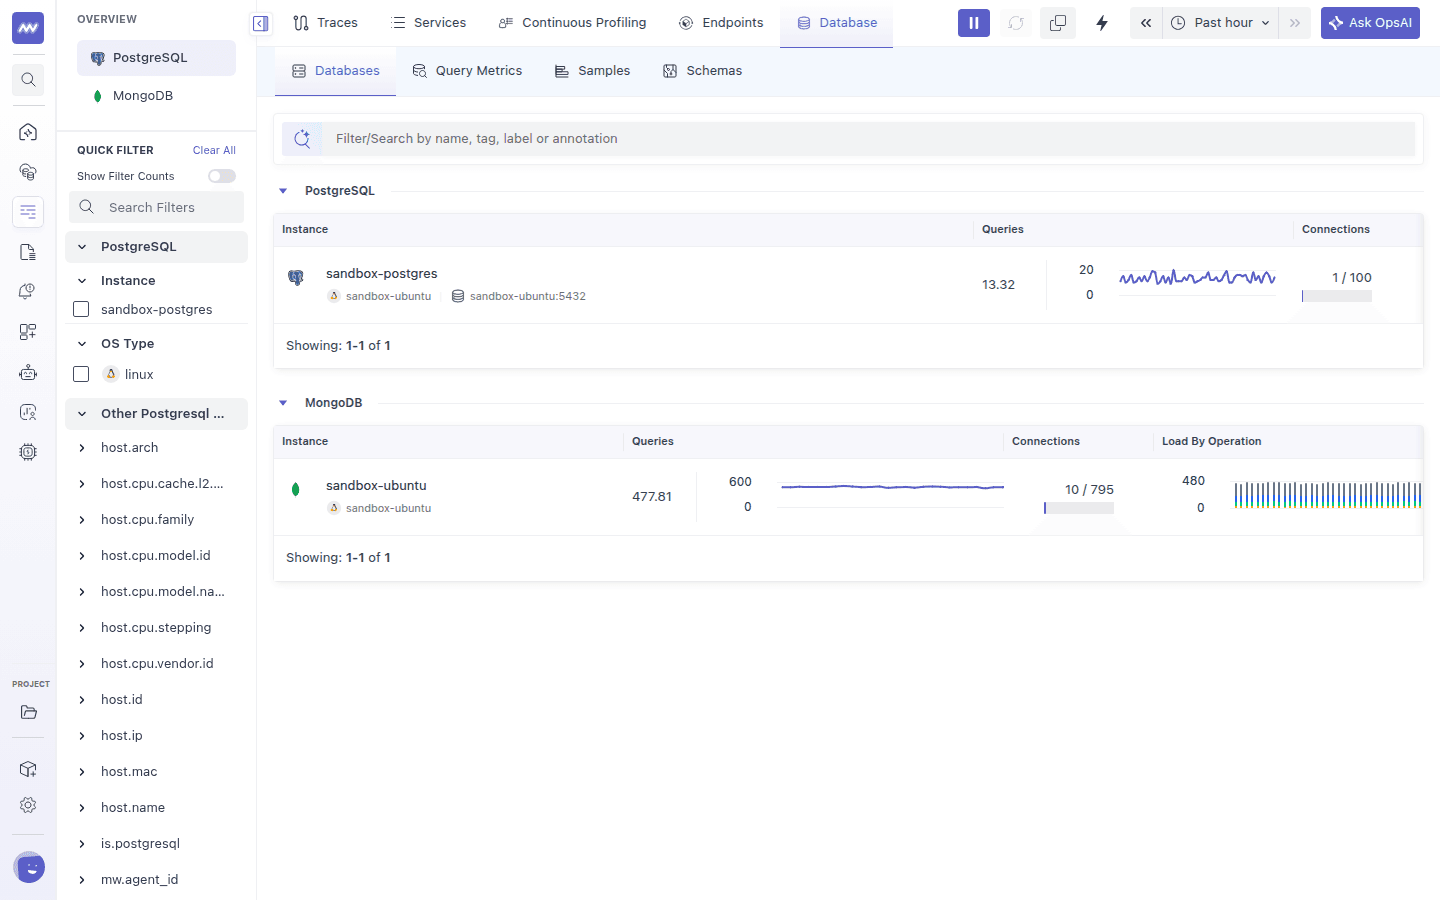
| Column | Description |
|---|---|
| Instance | Instance name, followed by its host, cloud or Kubernetes pod, and the host:port it listens on |
| Queries | Average number of query samples per interval, with a sparkline |
| Connections | Active connections compared with max_connections (Active / Max Connections) |
| Load By Wait Group | Query samples over time, stacked by wait event group |
| Column | Description |
|---|---|
| Instance | Host name of the MongoDB server, followed by its host, cloud, or Kubernetes pod |
| Queries | Average number of profiled operations per interval, with a sparkline |
| Connections | Active connections compared with the total (Active / (Active + Available)) |
| Load By Operation | Profiled operations over time, stacked by operation type (insert, query, update, command, and so on) |
Hover over a mini chart to see the values for each time bucket. Click an instance to open its detail panel.
PostgreSQL Instance Details#
The panel header shows the instance name and a time picker. The panel has four tabs: Summary, Metrics, Queries, and Logs.
Summary#
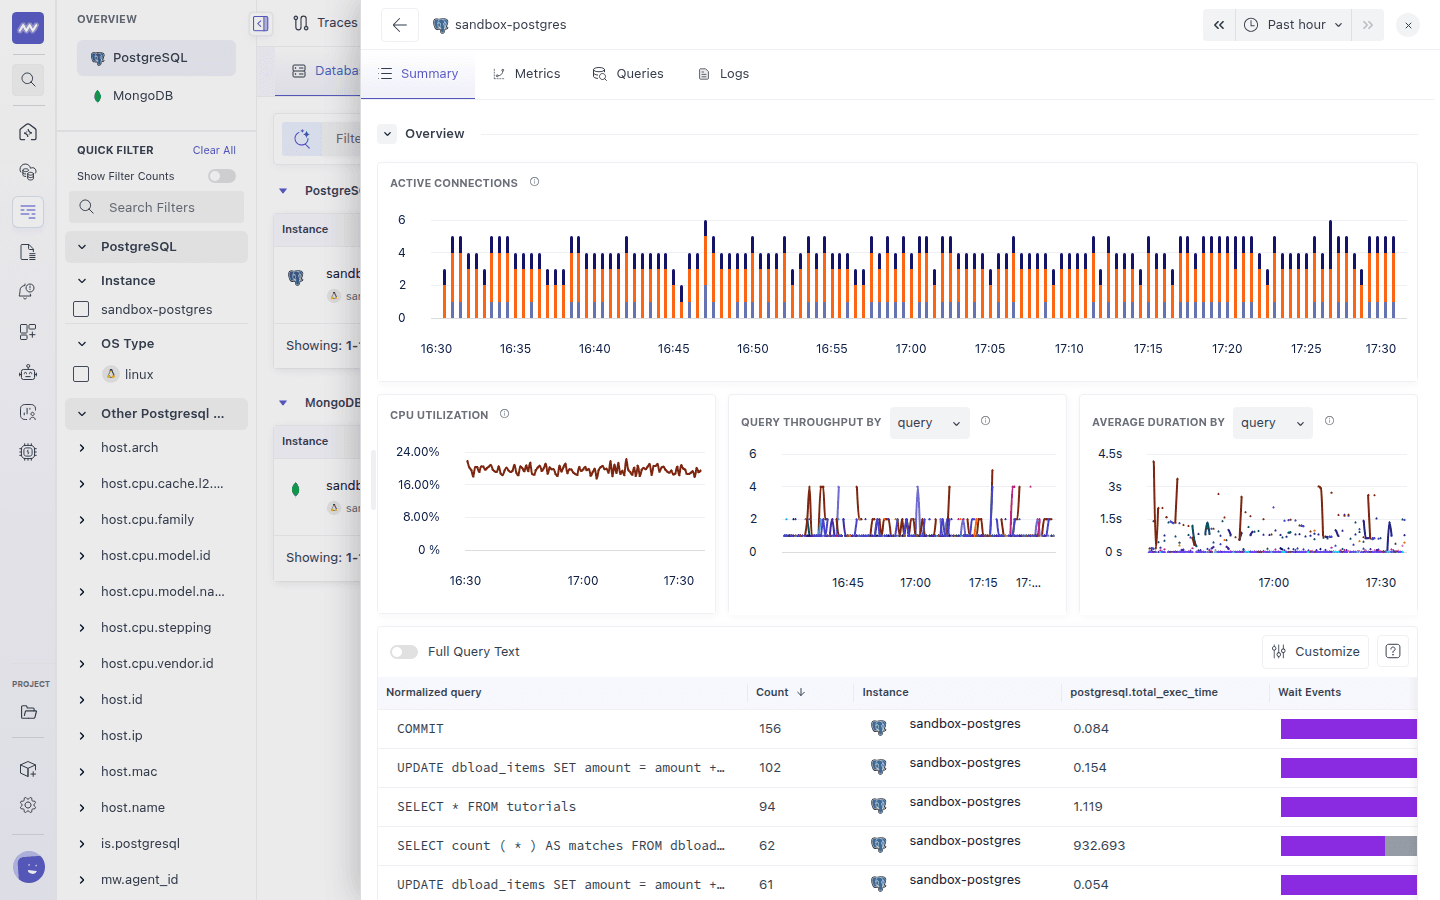
- Overview
- Active Connections: connections over time, grouped by backend state (for example
active,idle,idle in transaction) and user. - CPU Utilization: CPU usage of the database host. Shown only when the Middleware Agent also monitors that host.
- Query Throughput By: query sample count over time. Group it by
query,db,user, or all. - Average Duration By: average query execution time in milliseconds, with the same grouping options.
- The top queries for this instance, in the same format as Query Metrics.
- Active Connections: connections over time, grouped by backend state (for example
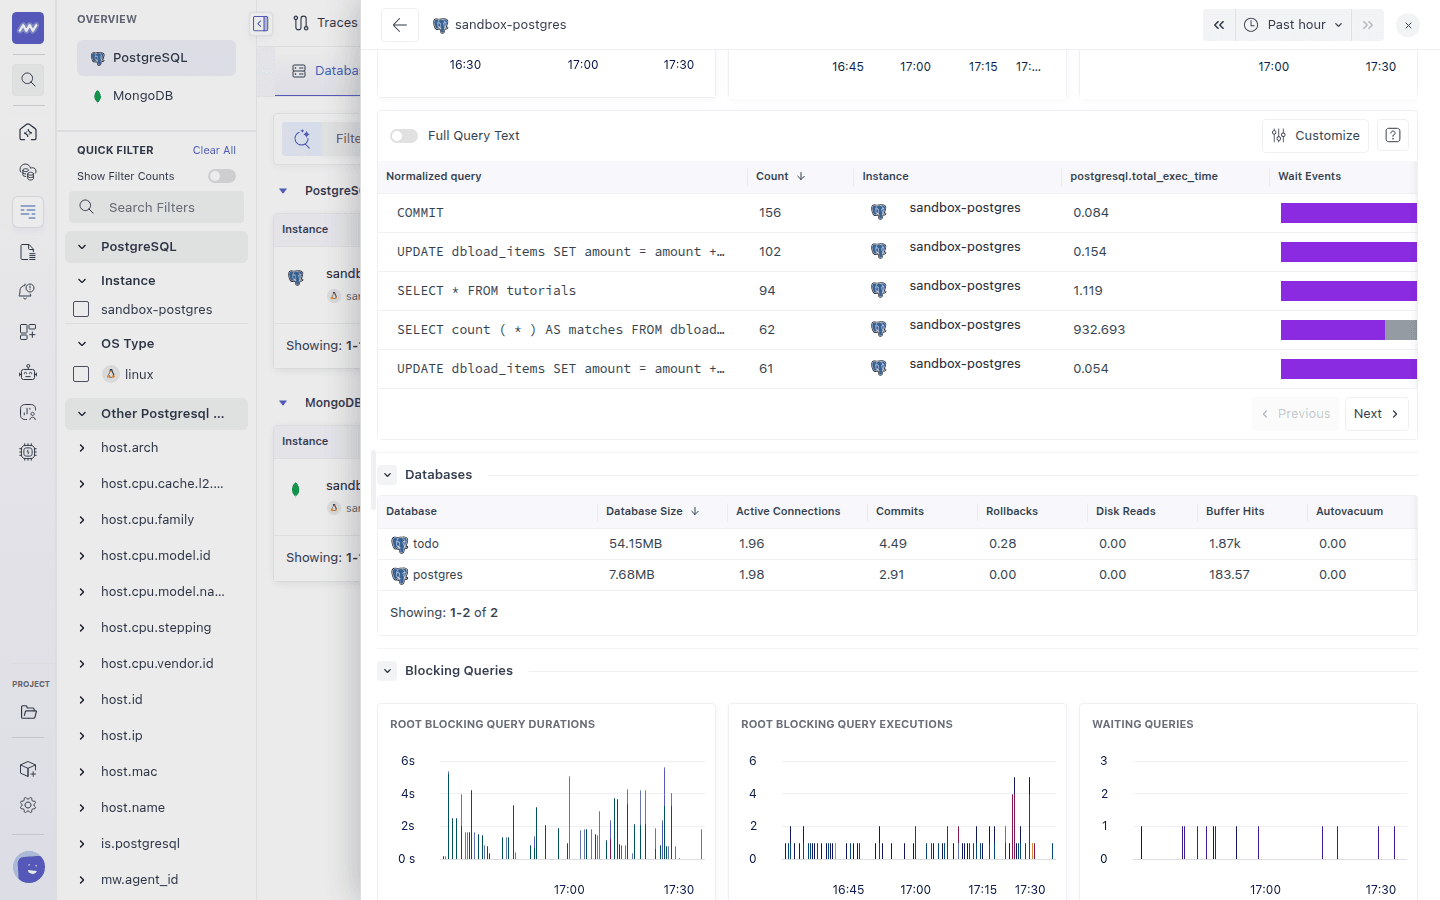
- Databases: one row per database, with Database Size, Active Connections, Commits, Rollbacks, Disk Reads, Buffer Hits, and Autovacuum counts.
- Blocking Queries: charts for Root Blocking Query Durations, Root Blocking Query Executions, and Waiting Queries. Below them, Blocking Overview and Blocking Samples list the queries that held locks. See Wait events and blocking.
- Schema: a schema explorer for this instance. See Schemas.
- Calling Services: query samples that are linked to APM services. See Connect with APM Traces.
Metrics#
Use Filter by at the top to scope every chart to one database (db:<name>) or all databases (db:*).
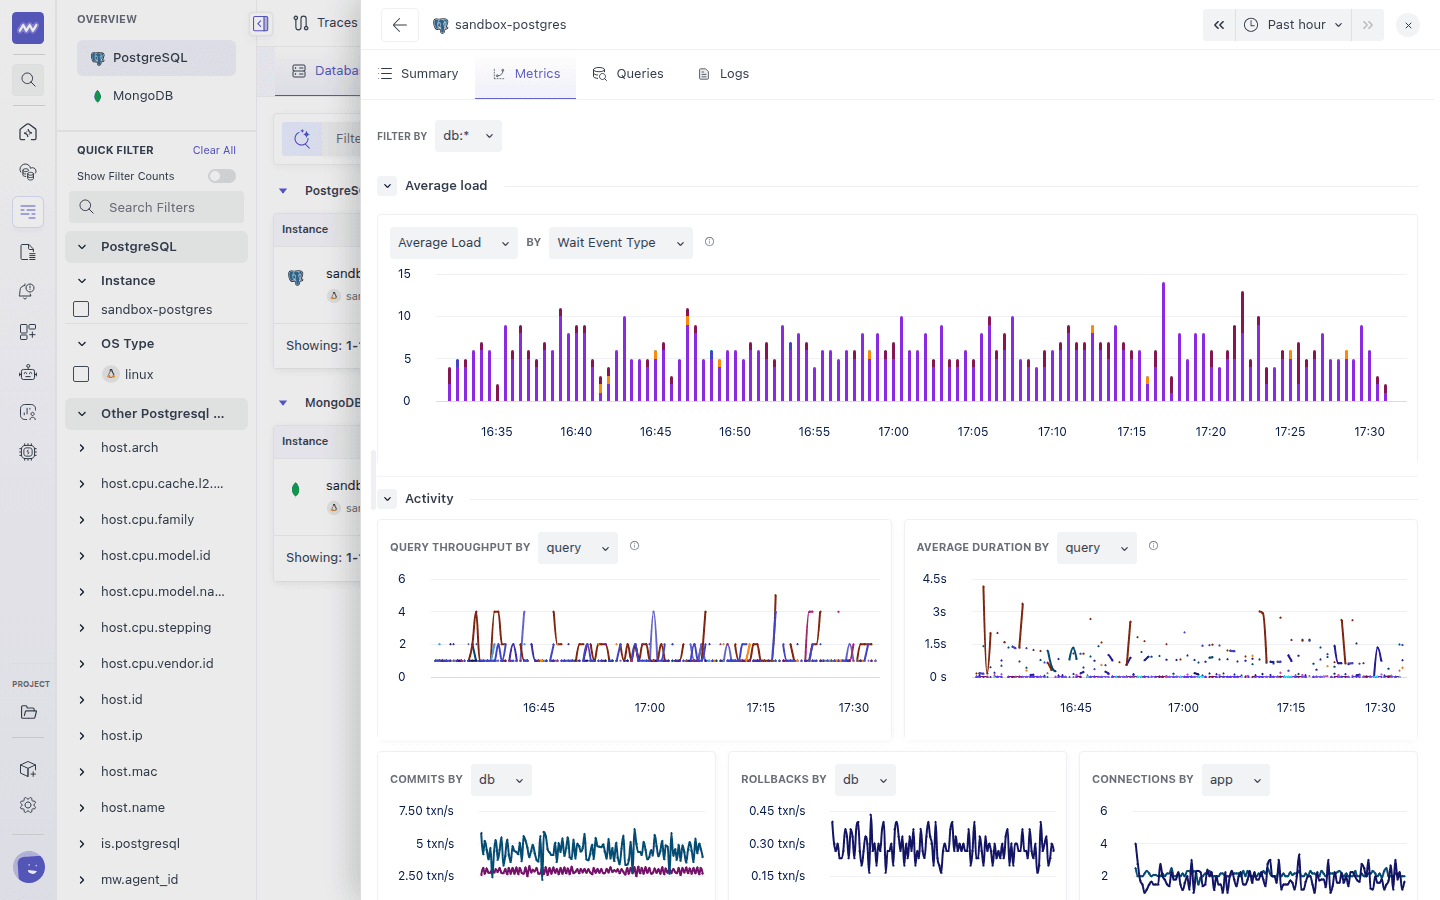
- Average load: query samples over time, stacked by the dimension you pick. Switch between Average Load and Blocking Connections, and group by Wait Event Type, Wait Event, SQL, User, Database, Client, or Application. When grouped by wait event, the colors match the wait event groups used everywhere else.
- Activity: query throughput and average duration, Commits by and Rollbacks by database (transactions per second), Connections by application, user, or database, Rows Modified by Operation Type, Max Transaction Time, and Total Transaction Time.
- Locks: Locks by Relation, Type and Mode.
- Replication: Write Ahead Log (WAL) Size.
- Indexes: index blocks hit and read per table, index scans, and index rows read per table and index.
- Blocks: shared and temporary block hits, reads, dirtied, and written blocks per query. These charts need Top Query Collection.
- Vacuum: live and dead rows per table, last autoanalyze, and heap blocks scanned.
- Functions: Function Calls.
- Objects: Database Sizes, Table Count by DB, and Table Sizes.
Queries#
The Average Load chart followed by three lists for this instance: Queries (grouped query metrics), Blocking Queries, and Query Samples. Use Search query to filter the lists, and Full Query Text to show queries without truncation.
Logs#
Log records associated with this instance, filtered to the instance name and host.
MongoDB Instance Details#
The panel has five tabs: Summary, Metrics, Queries, Samples, and Logs.
Summary#
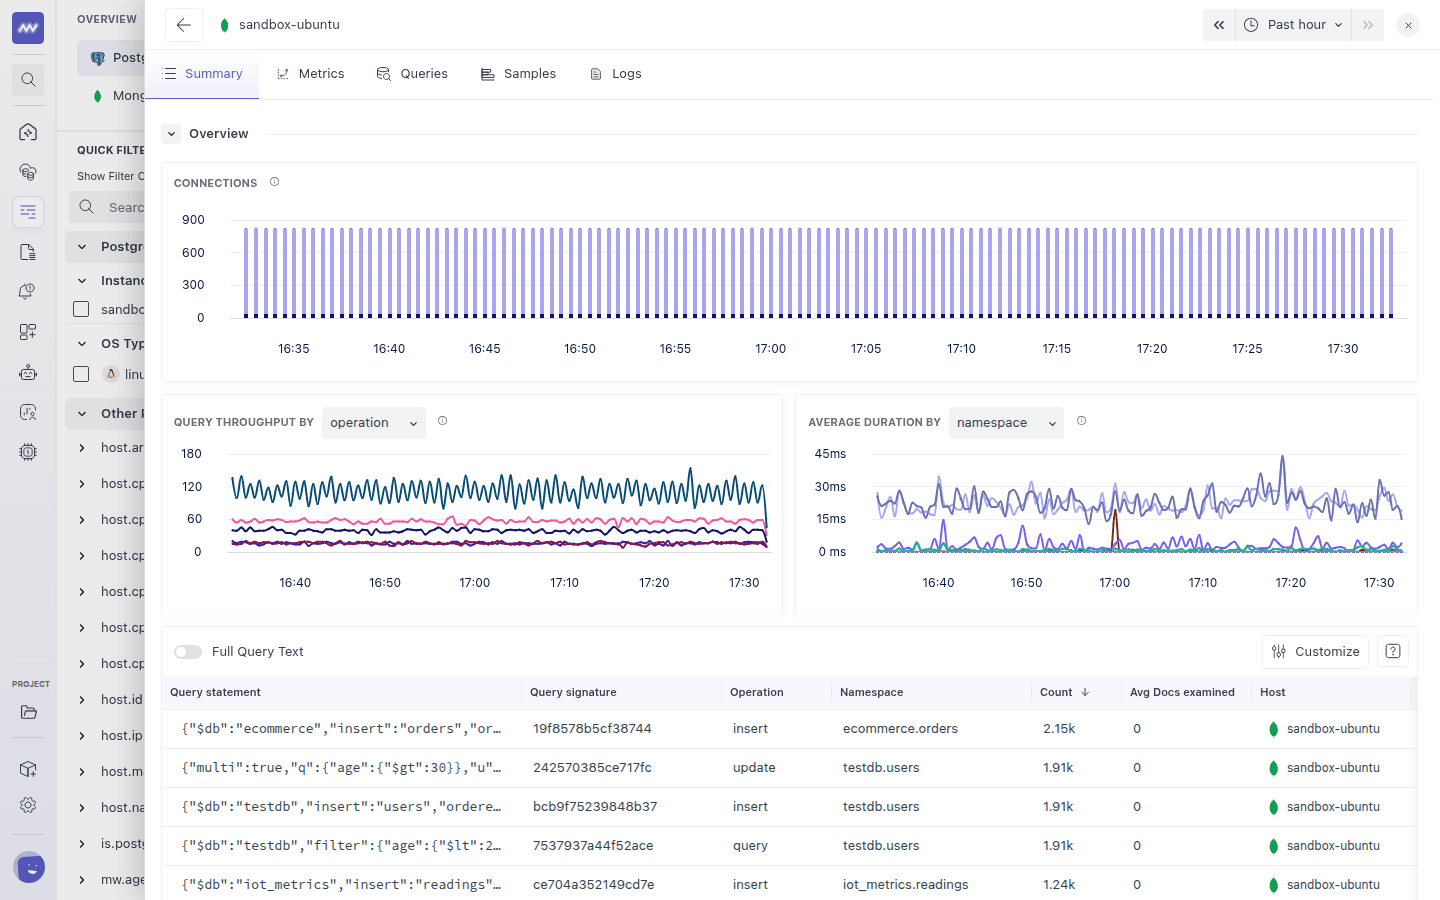
- Overview
- Connections: Active, Available, and Current connections over time.
- Query Throughput By: profiled operations over time. Group it by
operation,namespace,database, or all. - Average Duration By: average operation latency in milliseconds, with the same grouping options.
- The top operations for this instance, in the same format as Query Metrics.
- Collections: one row per collection with Database, Collection, Documents, Data Size, Storage Size, Indexes, and Avg Object Size.
Metrics#
Use Filter by to scope the charts to one database. The tab shows Average load by operation, the Collections table, and a Metrics section with these sub-tabs:
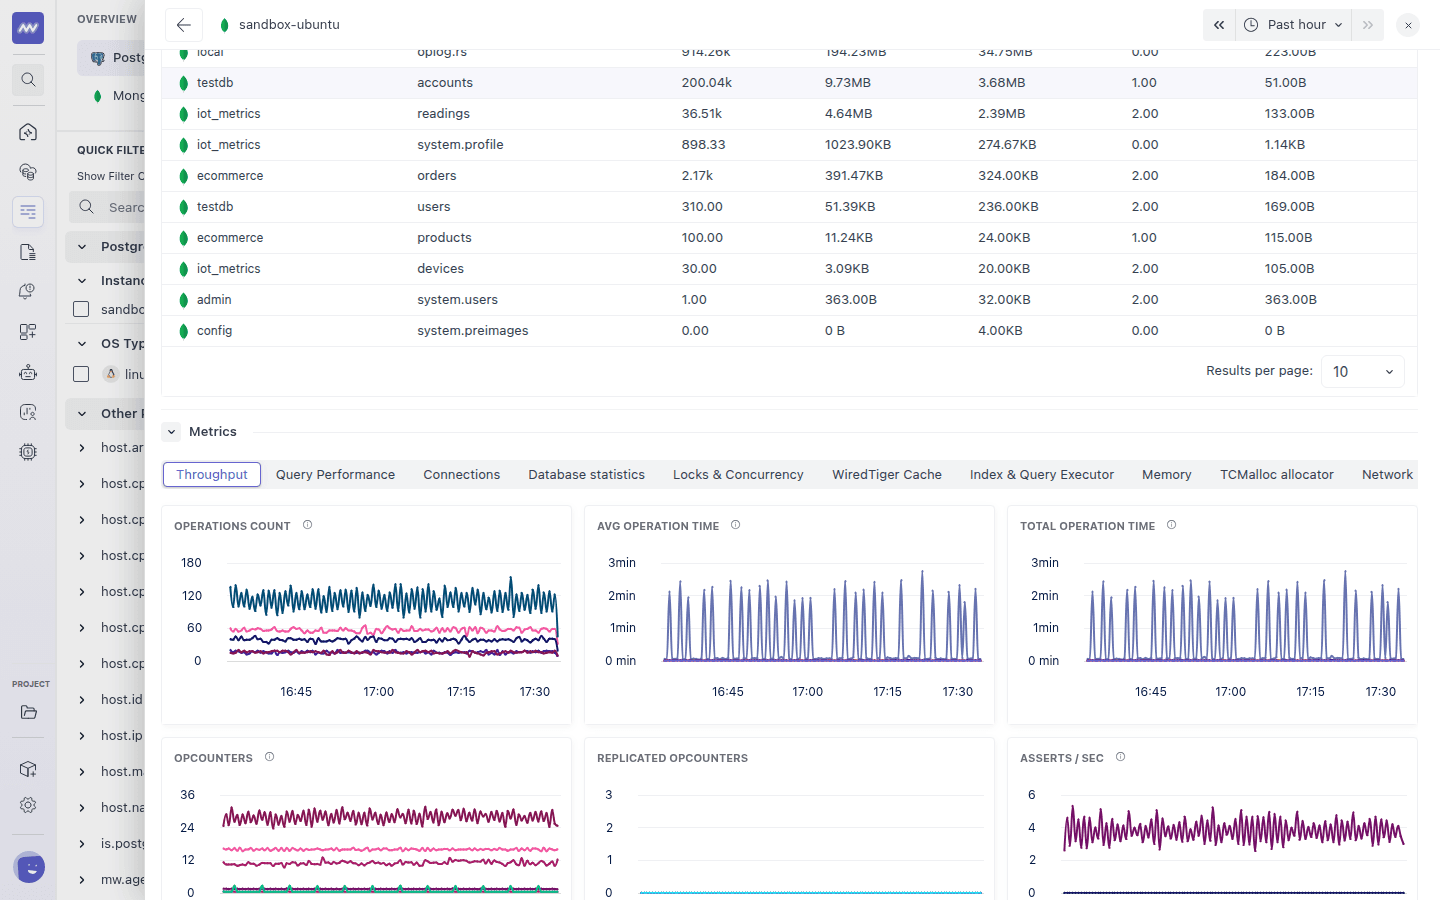
| Sub-tab | Charts |
|---|---|
| Throughput | Operations Count, Total Operation Time, Opcounters, Replicated Opcounters, Asserts / sec |
| Query Performance | Average keys examined, documents examined, keys inserted, CPU time, planning time, and response length |
| Connections | Connections by state, Rejected / Created, Connections Pool |
| Database statistics | Storage Size, Data Size, Index size, object count by database, collections and indexes count, average object size |
| Locks & Concurrency | Global lock active clients and time held, WiredTiger read and write tickets, collection lock acquires, waits, and wait time |
| WiredTiger Cache | Cache size vs max, dirty bytes, pages held in cache, cache read and write activity, pages evicted, eviction pressure |
| Index & Query Executor | Index hits and misses, index miss ratio, index accesses (total and by collection), total indexes, documents and keys scanned |
| Memory | Resident and virtual memory, page faults, heap usage |
| TCMalloc allocator | Allocated and heap, thread and central cache free, page heap |
| Network | Bytes in and out, requests rate, bytes received and transmitted, requests count |
| Replication | Replica set health, state, lag, votes, replication buffer, replication network and apply rates |
| Oplog & Journaling | Oplog size vs used, oplog window, journal commits, journaled data, and write times |
Queries and Samples#
Queries shows Average load by operation and the grouped operations for this instance. Samples lists the individual slow operations. Both have their own search bar. See Query Metrics and Query Samples for column details.
Logs#
Log records from the MongoDB host, including the slow operation records collected from the profiler.
Need assistance or want to learn more about Middleware? Get in touch with us via our Contact Us or join our Slack channel.