Elasticsearch Integration
Prerequisites#
- Middleware Host Agent installed on the machine that will collect metrics. See the Installation Guide.
- Elastic superuser privileges to allow stats access. Elastic provides a built-in superuser role and an elastic superuser account; follow Elastic guidance to create users/roles with the minimum necessary privileges.
Setup#
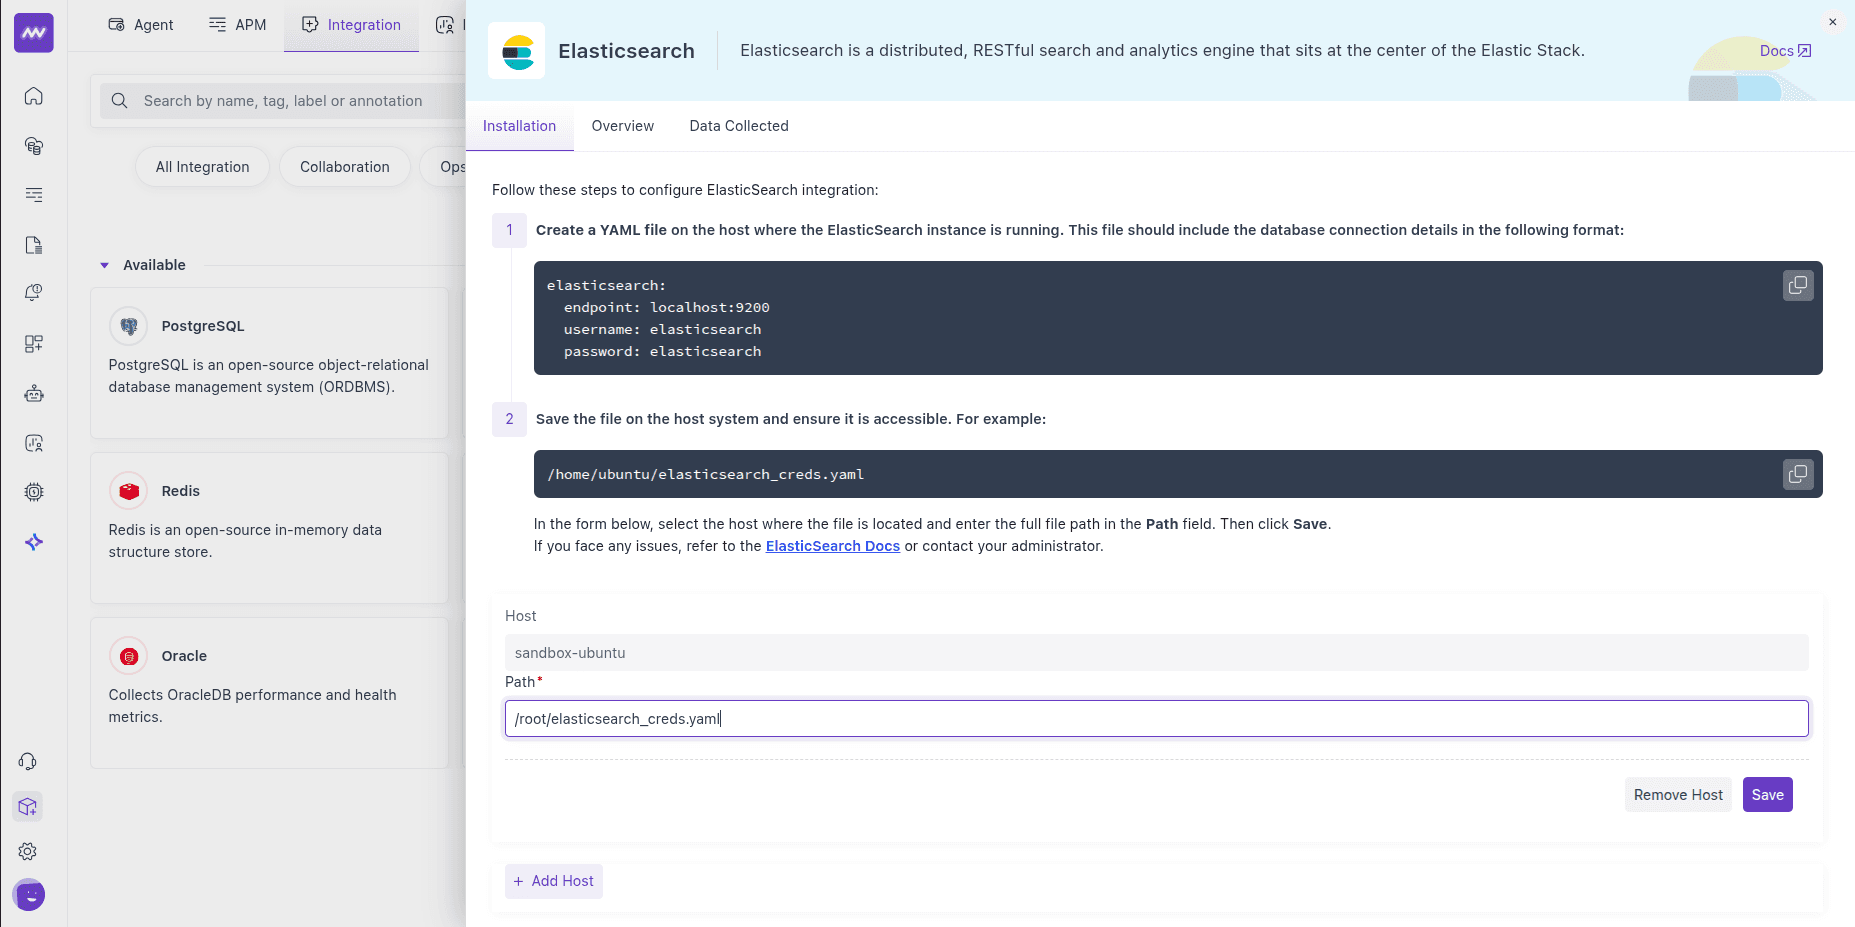
1 Create database credentials#
Create a YAML file with your Elasticsearch endpoint and (if enabled) credentials. If your cluster is not password-protected, omit username and password. Example: /home/ubuntu/elasticsearch-creds.yaml
1elasticsearch:
2  endpoint: http://localhost:9200
3  username: YOUR_USERNAME
4  password: YOUR_PASSWORD
Docker Agent: place the YAML inside /var/log on the Agent host. Docker Agents might not support dynamic volume binding. Quick verify (from the Agent host):
1# If auth is enabled, add: -u USER:PASS
2curl -s http://<es-host>:9200/_cluster/health?pretty
3curl -s http://<es-host>:9200/_nodes/stats?filter_path=nodes.*.jvm,cluster_name | head
These endpoints confirm reachability/permissions and return cluster health and node statistics.
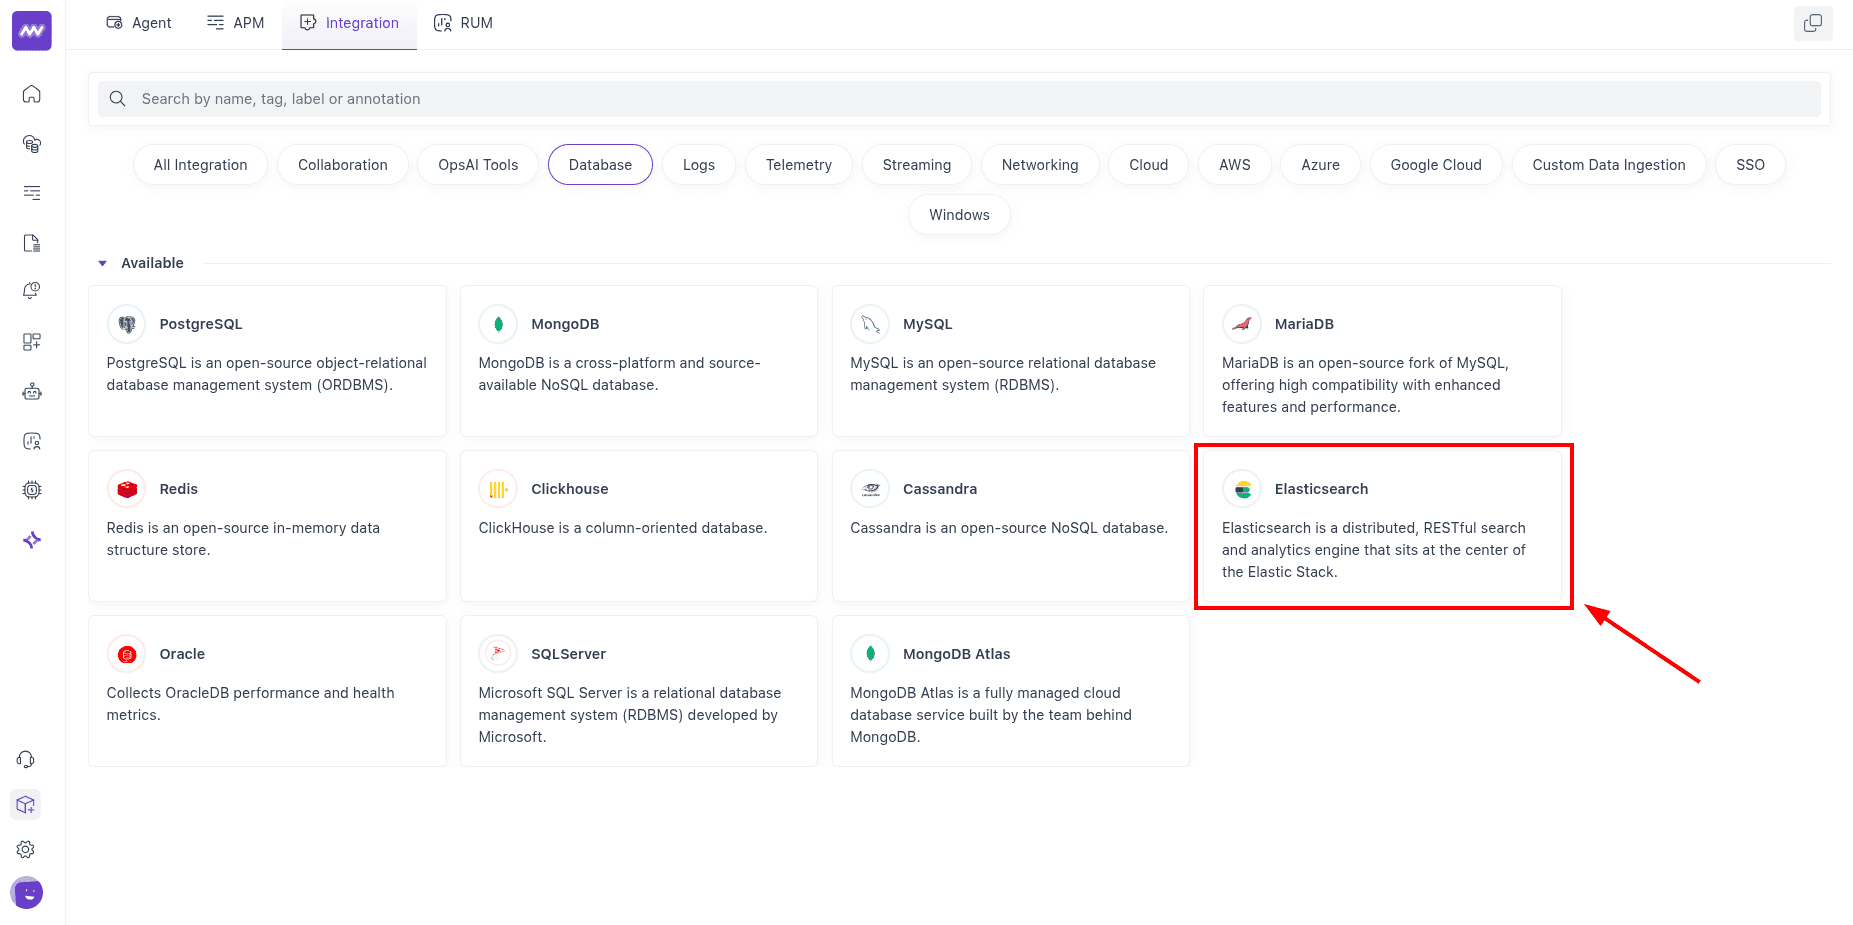
2 Access Integrations#
In Middleware, go to Installations → All Integrations → Elasticsearch (the original page mistakenly references MySQL—use Elasticsearch here).
3 Enable Integration#
Select the host (where the Host Agent is running), provide the credential file path from Step 1, and Save.
Visualize Your Data#
- Default Elasticsearch dashboard: Open Dashboard Builder → Elasticsearch – Metrics (Runtime) for ready-to-use graphs.
- Create widgets: In a dashboard, choose Add New Widget → elasticsearch to build custom charts (e.g., disk I/O per node, CPU, JVM heap, shard sizes, indexing pressure).
Alerts#
Create alerts on any Elasticsearch metric. Choose Database as the detection method and Elasticsearch as the database type; pick a metric and set conditions (e.g., high indexing_pressure, low disk available, rising thread_pool.tasks.queued).
Metrics Collected#
| Metric | Description |
|---|---|
elasticsearch.breaker.memory.estimated | Estimated memory used for the operation |
elasticsearch.breaker.memory.limit | Memory limit for circuit breaker |
elasticsearch.breaker.tripped | Number of times the circuit breaker prevented an OOM. |
elasticsearch.node.cache.memory.usage | Cache size in bytes on a node. |
elasticsearch.node.cache.evictions | Cache evictions on a node. |
elasticsearch.node.cache.count | Total query cache misses across shards on selected nodes. |
elasticsearch.node.fs.disk.available | Disk space available to the JVM across all file stores. |
elasticsearch.node.fs.disk.free | Unallocated disk space across all file stores. |
elasticsearch.node.fs.disk.total | Total disk space across all file stores. |
elasticsearch.node.disk.io.read | Total KB read across file stores (per node). |
elasticsearch.node.disk.io.write | Total KB written across file stores (per node). |
elasticsearch.node.cluster.io | Bytes sent/received for internal cluster communication. |
elasticsearch.node.cluster.connections | Open TCP connections for internal cluster comms. |
elasticsearch.node.http.connections | HTTP connections to the node. |
elasticsearch.node.operations.completed | Operations completed by a node. |
elasticsearch.node.operations.time | Time spent on operations by a node. |
elasticsearch.node.shards.size | Size of shards assigned to this node |
elasticsearch.node.shards.data_set.size | Total data set size of shards on this node. |
elasticsearch.node.shards.reserved.size | Predicted growth of shard stores on this node. |
elasticsearch.node.translog.operations | Transaction log operations. |
elasticsearch.node.translog.size | Transaction log size. |
elasticsearch.node.translog.uncommitted.size | Uncommitted translog size. |
elasticsearch.node.thread_pool.threads | Threads in the thread pool. |
elasticsearch.node.thread_pool.tasks.queued | Queued tasks in the thread pool. |
elasticsearch.node.thread_pool.tasks.finished | Tasks finished by the thread pool. |
elasticsearch.node.documents | Documents on the node. |
elasticsearch.node.open_files | Open file descriptors held by the node. |
jvm.classes.loaded | Loaded JVM classes. |
jvm.gc.collections.count | Total garbage collections. |
jvm.gc.collections.elapsed | Accumulated GC time. |
jvm.memory.heap.max | Max heap memory |
jvm.memory.heap.used | Current heap usage. |
jvm.memory.heap.committed | Committed heap memory. |
jvm.memory.nonheap.used | Current non-heap memory usage |
jvm.memory.nonheap.committed | Amount of memory that is guaranteed to be available for non-heap purposes |
jvm.memory.pool.max | Maximum amount of memory can be used for the memory pool |
jvm.memory.pool.used | Current memory pool memory usage |
jvm.threads.count | Current number of threads |
elasticsearch.cluster.pending_tasks | Number of cluster-level changes that have not yet been executed |
elasticsearch.cluster.in_flight_fetch | Number of unfinished fetches |
elasticsearch.cluster.shards | Number of shards in the cluster |
elasticsearch.cluster.data_nodes | Number of data nodes in the cluster |
elasticsearch.cluster.nodes | Total number of nodes in the cluster |
elasticsearch.cluster.health | The health status of the cluster |
elasticsearch.os.cpu.usage | Recent CPU usage for the whole system, or -1 if not supported |
elasticsearch.os.cpu.load_avg.1m | 1-minute system load average. |
elasticsearch.os.cpu.load_avg.5m | 5-minute system load average. |
elasticsearch.os.cpu.load_avg.15m | 15-minute system load average. |
elasticsearch.os.memory | Physical memory amount. |
elasticsearch.memory.indexing_pressure | Bytes consumed by indexing requests (stage-specific). |
elasticsearch.indexing_pressure.memory.total.primary_rejections | Cumulative primary-stage indexing rejections. |
elasticsearch.indexing_pressure.memory.total.replica_rejections | Replica-stage indexing rejections. |
elasticsearch.indexing_pressure.memory.limit | Configured memory limit, in bytes, for the indexing requests |
elasticsearch.cluster.state_queue | Number of cluster states in queue |
elasticsearch.cluster.published_states.full | Number of published cluster states |
elasticsearch.cluster.published_states.differences | Number of differences between published cluster states |
elasticsearch.cluster.state_update.count | Cluster state updates that changed state. |
elasticsearch.cluster.state_update.time | Time spent updating cluster state. |
elasticsearch.cluster.indices.cache.evictions | Number of evictions from the cache for indices in the cluster |
elasticsearch.node.ingest.documents | Total documents ingested during the lifetime of this node |
elasticsearch.node.ingest.documents.current | Total documents currently being ingested |
elasticsearch.node.ingest.operations.failed | Total failed ingest operations during the lifetime of this node |
elasticsearch.node.pipeline.ingest.documents.preprocessed | Number of documents preprocessed by the ingest pipeline |
elasticsearch.node.pipeline.ingest.operations.failed | Total failed operations for the ingest pipeline |
elasticsearch.node.pipeline.ingest.documents.current | Total documents currently being ingested by a pipeline |
elasticsearch.node.script.compilations | Total inline script compilations performed by the node |
elasticsearch.node.script.cache_evictions | Total times the script cache has evicted old data |
elasticsearch.node.script.compilation_limit_triggered | Times script compile circuit breaker limited compilations. |
elasticsearch.node.segments.memory | Size of memory for segment object of a node |
elasticsearch.index.operations.completed | Number of operations completed for an index |
elasticsearch.index.operations.time | Time spent on operations for an index |
elasticsearch.index.shards.size | Size of the shards assigned to this index |
elasticsearch.process.cpu.usage | CPU usage in percent |
elasticsearch.node.operations.current | Number of query operations currently running |
elasticsearch.index.documents | Number of documents for an index |
elasticsearch.process.memory.virtual | JVM process virtual memory size. |
elasticsearch.process.cpu.time | JVM process CPU time. |
Troubleshooting#
Integrations menu is missing
- Your user likely lacks Installation permissions. Ask an admin to grant the Installation permission in Settings.
Endpoint unreachable from the Host Agent From the Agent host, run:
1curl -s http://<es-host>:9200/_cluster/health?pretty- If this fails, fix DNS/firewall/routing or use the correct scheme/port (e.g.,
https://behind proxies or Elastic Cloud). The health API should return a JSON status (green/yellow/red).
Authentication/authorization errors (401/403)
- Confirm the YAML creds are correct and have sufficient privileges. Elastic’s superuser role has full access, but Elastic recommends creating narrowly-scoped roles where possible.
To verify what your user can do, call:
1curl -s -u USER:PASS http://<es-host>:9200/_security/user/_privileges- (Returns the logged-in user’s privileges.)
Docker Agent can’t read the credentials file
- Ensure the file is inside
/var/logon the Agent host when using the Middleware Docker Agent (dynamic volume binding may not be supported). Update the integration to point to that path.
Metrics look partial or stale Check the _nodes/stats endpoint directly to ensure the cluster is returning JVM/OS/thread pool stats:
1curl -s http://<es-host>:9200/_nodes/stats?filter_path=nodes.*.os,nodes.*.jvm,nodes.*.thread_pool | head- If output is limited, review your user’s privileges or cluster settings.
Need assistance or want to learn more about Middleware? Contact our support team at [email protected] or join our Slack channel.