Correlation with Data
Correlate what a real user did in the browser with the exact backend work your services performed, and the log line(s) those services emitted using one continuous context. This page walks you through a RUM session → the backend trace → the attached logs, explaining what each panel means and how to read it confidently.
What you get
- A single request “thread” across browser, services, and logs (via
<trace_id>/<span_id>). - Visual timing (flame graph) to spot where time is actually spent.
- Request/response and headers to validate behaviour and caching.
- Log details to confirm status, payload sizes, and errors.
Prerequisites#
- RUM SDK initialised with browser tracing enabled, so network events (XHR/Fetch) carry trace context.
- Backend services instrumented for tracing and configured to propagate W3C Trace Context (
traceparent/tracestate) through gateways/queues. - Logging is configured to enrich log events with
<trace_id>and<span_id>(so the Logs tab can stitch them automatically).
Short Answer: it’s close, but we can make the “what” and the “how” completely unmistakable by adding two small, explicit sections at the top. Below are drop-in blocks you can paste into your page. They keep your placeholders and reference your screenshots.
What is “correlation” in RUM?#
Correlation means stitching a single user action in the browser (a RUM event such as an XHR/Fetch) to the exact backend trace that handled it and to the log entries those services emitted so that you can follow one request end-to-end.
Middleware achieves this by propagating and storing shared identifiers, primarily <trace_id> and <span_id>, across RUM, tracing, and logging. When these IDs match, you are looking at the same request across all three data types.
How Middleware stitches RUM → Traces → Logs#
- Browser (RUM SDK)
- Auto-instruments XHR/Fetch and starts/joins a distributed trace.
- Attaches W3C Trace Context headers (
traceparent,tracestate) carrying<trace_id>/<span_id>on the network request. - Captures browser timings and attributes (e.g.,
resource.duration,http.url,browser.name) as well as the session ID (session.id). - Sends the RUM event with these fields to Middleware.
- Edge / Service (Tracing)
- Your tracing library extracts the incoming context from
traceparent. - It continues the same trace and creates server spans (e.g.,
app-api-v2span), preserving<trace_id>and generating child<span_id>values. - Spans are sent to the Middleware’s trace store.
- Your tracing library extracts the incoming context from
- Service Logging (Logs)
- Your logger is enriched to include
<trace_id>/<span_id>on every relevant log event (request logs, errors, DB warnings, etc.). - Logs are shipped to Middleware and indexed by these IDs.
- Your logger is enriched to include
- Index & Link
- Middleware indexes RUM events, traces, and logs on
<trace_id>(and also onsession.id/time). - From a RUM event, the UI can unambiguously fetch the trace and the logs that share the duplicate IDs.
- Middleware indexes RUM events, traces, and logs on
Start from the RUM Session (front end)#
Open RUM → Sessions and select a session that interests you (e.g., a user reporting slowness). In the left pane, choose Events. Filter for Type: xhr and click the network event (e.g., GET /api/v1/account/init).
You’re selecting the exact browser request that the user’s page fired. From here, Middleware pivots you to the backend view for this very request.
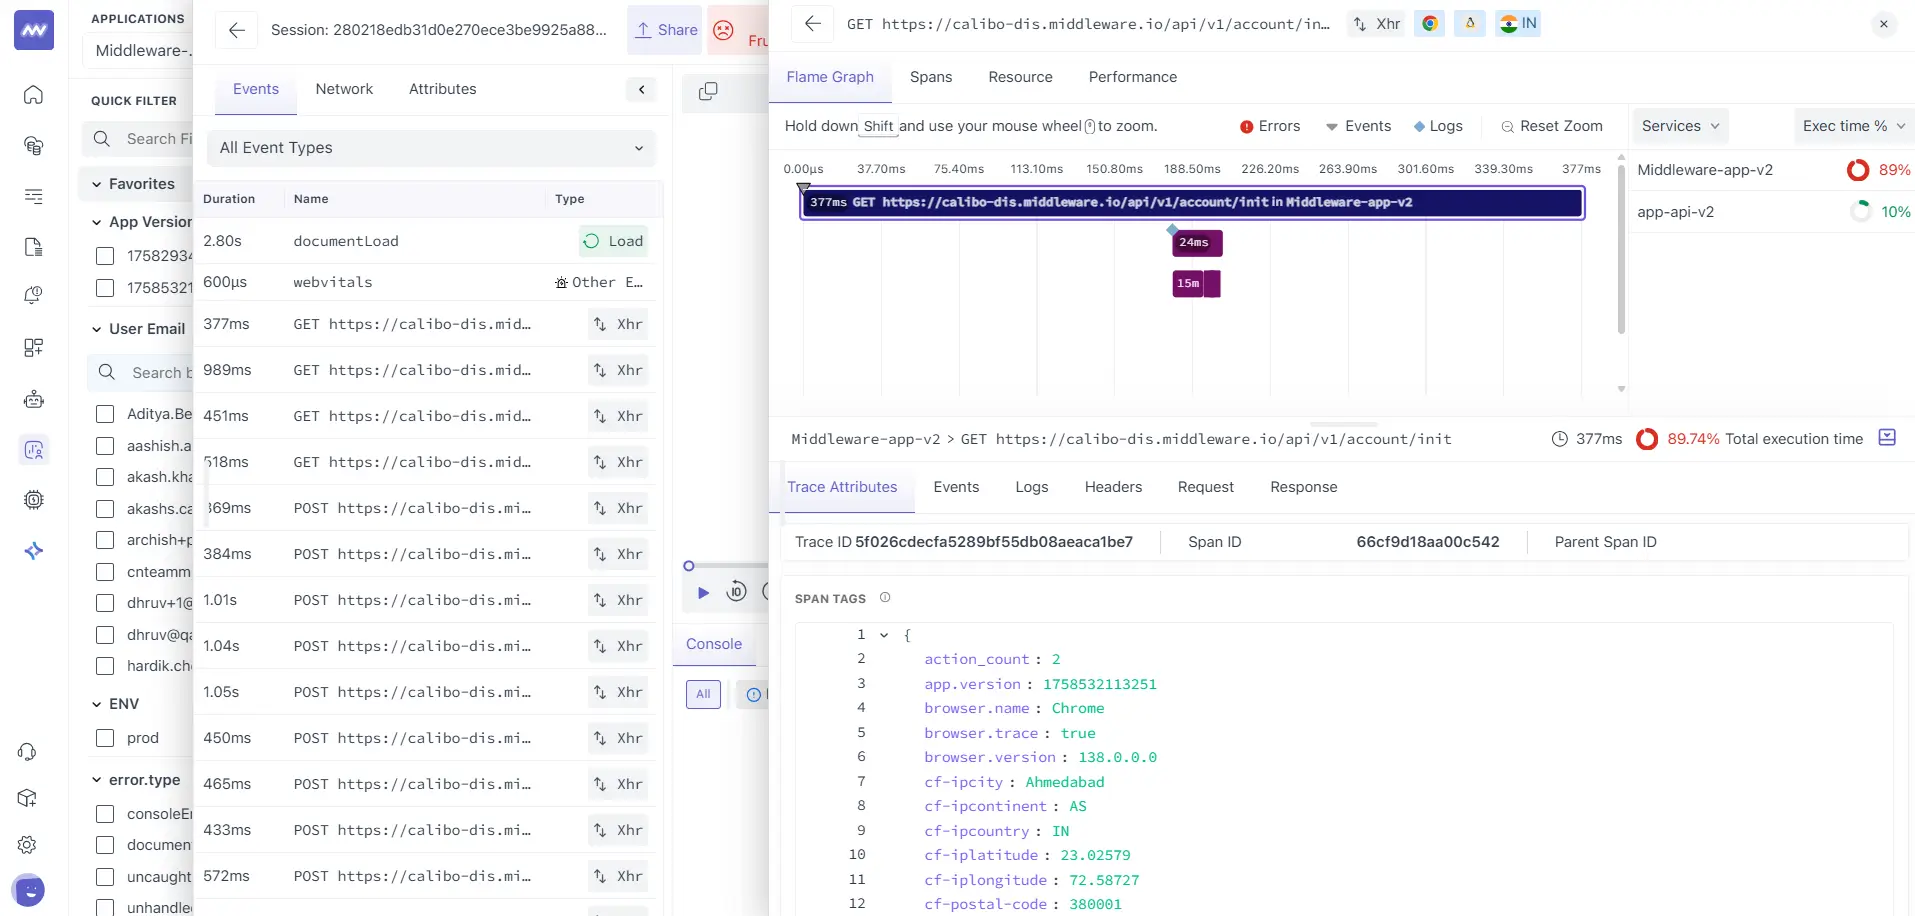
What you see on the right:
- Flame Graph (top): stacked spans across services that handled this request.
- Services panel / Exec time % (right): Which service took the most time.
- Tabs (bottom): Trace Attributes, Events, Logs, Headers, Request, Response.
Why it matters:
- This is already filtered to the same request your browser made. No manual search across products; you’re looking at one stitched timeline.
Read the Trace (How to Interpret the Panels)#
1. The Flame Graph#
- Each bar is a span; its width is duration.
- Bars stack to show parent/child work (e.g., frontend gateway →
app-api-v2→ DB). - Zoom and hover to see where the latency sits. Long, wide bars are hot spots.
How to use it
- If the top bar is the HTTP handler and a child DB call dominates, you’ve found the bottleneck.
- If most of the time is spent before any server span, it’s likely due to network/TTFB/CDN issues.
2. Service Breakdown (Exec time %)#
- A quick at-a-glance ranking of which service is responsible for most of the end-to-end time.
3. Trace Attributes (context you’ll rely on)#
Open the Trace Attributes tab (it’s usually selected). You’ll see a merged view of browser and server attributes. Typical high-value fields:
| Attribute | Meaning | Example |
|---|---|---|
event.type | Browser event type | xhr |
ttp.method, http.url, http.status_code | Core request data | GET https://<host>/api/v1/account/init → 200 |
traceId, spanId | Correlation keys across RUM, trace, and logs | <trace_id>, <span_id> |
browser.trace | Browser tracing enabled | true |
resource.duration | Browser-observed total resource time | 369.3 ms |
resource.first_byte.duration | Time to first byte from server/CDN | 366.5 ms |
resource.download.duration | Time to read the response | 2.8 ms |
resource.size / resource.transfer_size | Uncompressed vs on-wire size | 14708 B / 5716 B |
http.response_content_length | Server-reported length | 5416 B |
project.name, mw.agent_id | Project/agent identity | <project_name>, <agent_id> |
browser.name/version, os | Client environment | Chrome 138, Linux |
cf-*, email, name | (Optional) geo/user fields | <city>, <country>, <email>, <user_name> |
Anchor the correlation on IDs: Write down <trace_id> and <span_id> from here; you’ll confirm them again in the Logs view. If they match, you’re unquestionably looking at the same request from browser → services → logs.
Jump to Logs (same request, same IDs)#
Click the Logs tab in the same right-hand inspector. You’ll see log entries scoped to this trace/span, no extra filters needed.
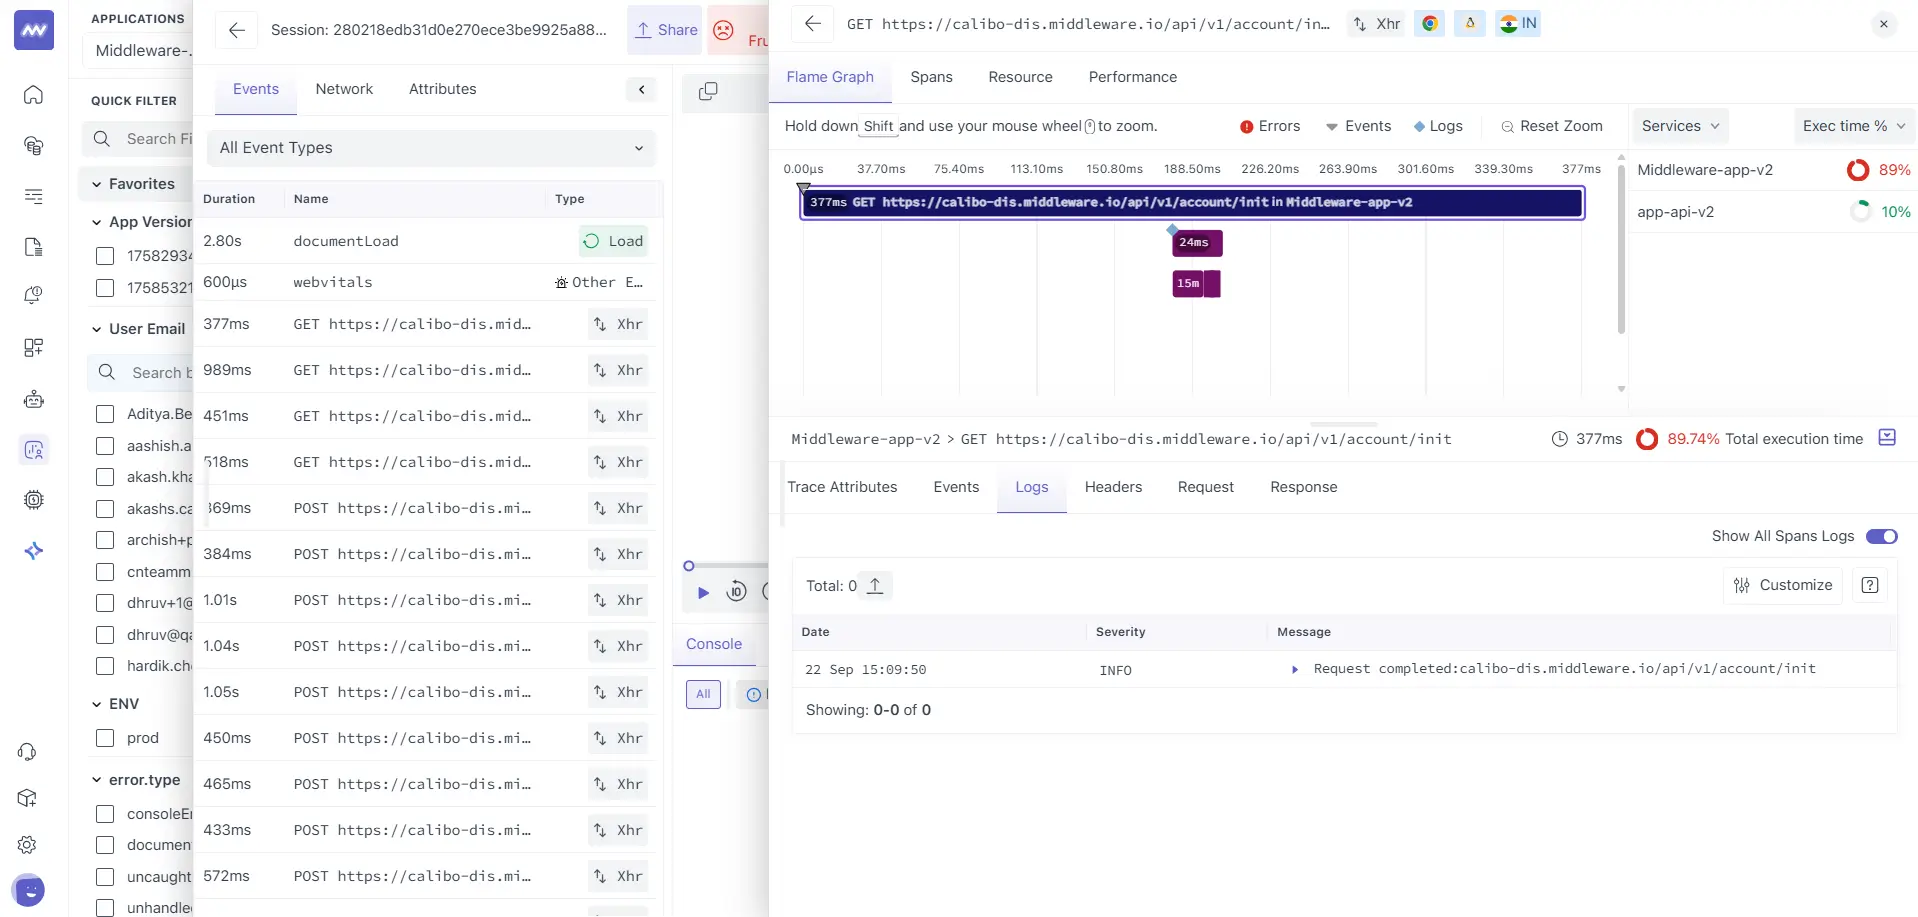
Open a log row to inspect its structured fields.
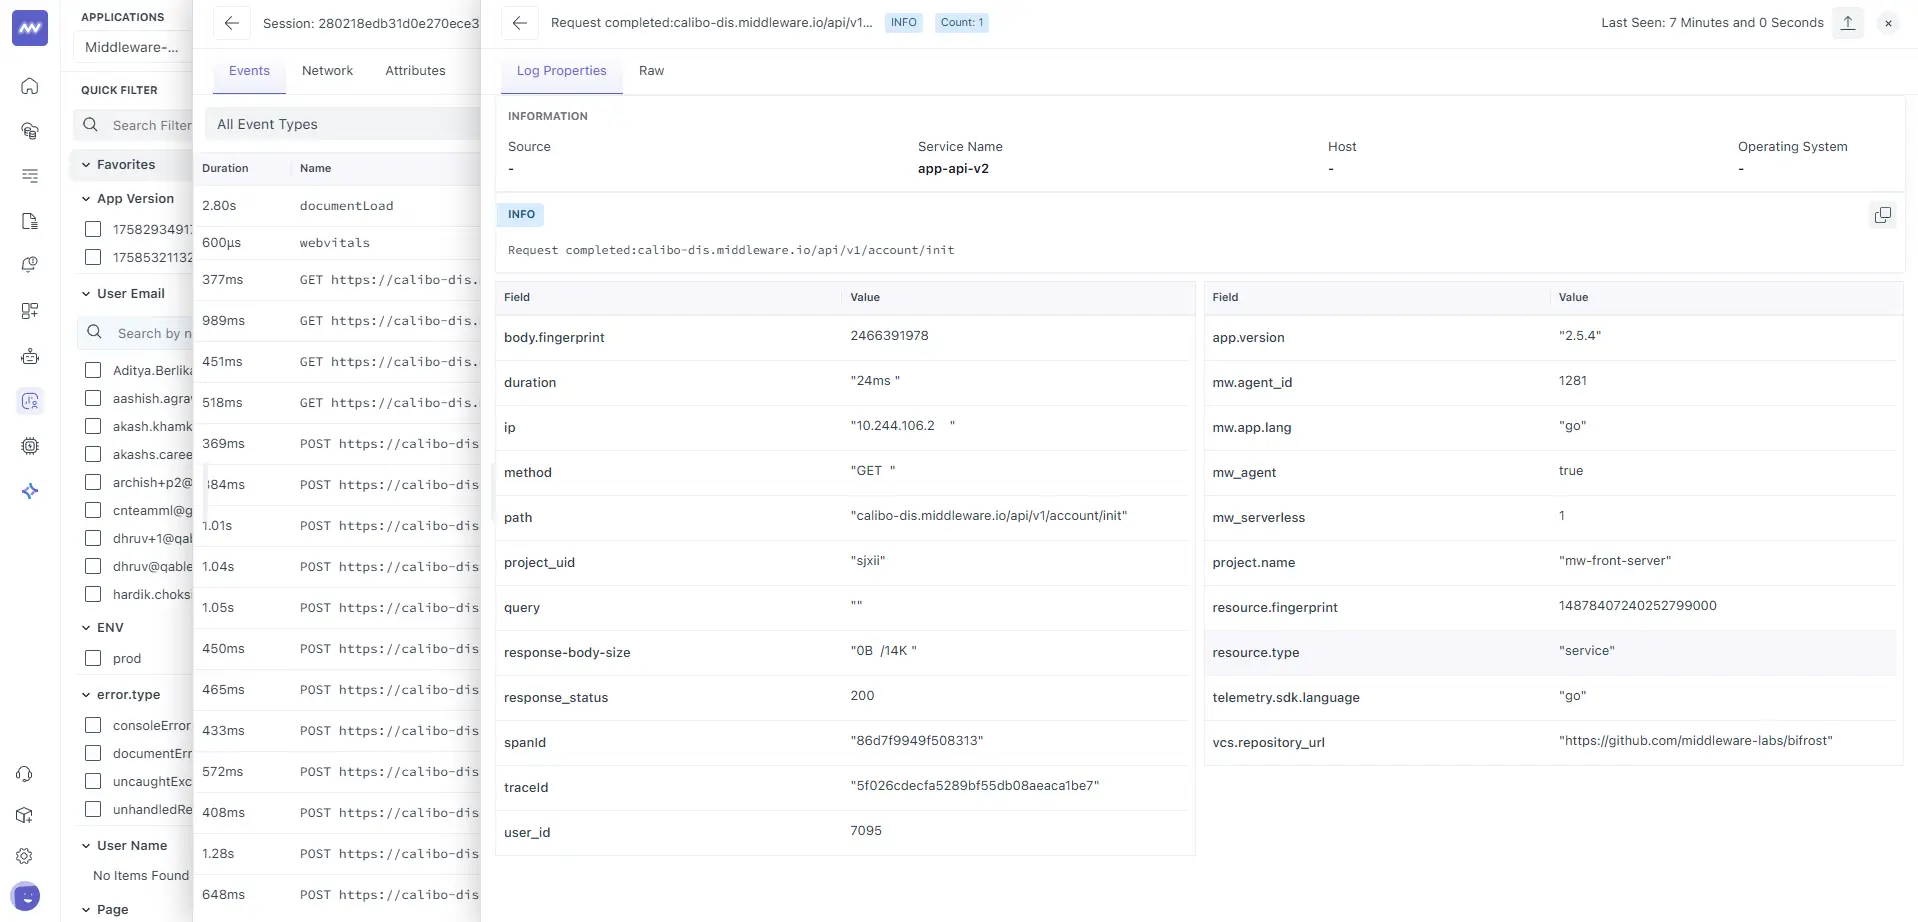
Key fields you’ll read here:
| Field | Why it matters | Example |
|---|---|---|
service.name | Which service emitted the log | app-api-v2 |
method, path, response_status | Confirms HTTP behaviour | GET, /api/v1/account/init, 200 |
duration | Service-reported time | 24 ms |
traceId / spanId | Must match the Trace view | <trace_id> / <span_id> |
response-body-size | What the service sent | 0 B / 14 K |
ip, user_id | Origin context (if logged) | <ip>, <user_id> |
project.name, mw_agent, telemetry.sdk.language | Runtime & agent metadata | <project_name>, true, go |
Sanity check: If the traceId here doesn’t match the Trace Attributes, your gateway/worker likely started a new trace. Ensure trace context headers are forwarded end-to-end.
Validate Payloads and Headers#
Use the Request, Response, and Headers tabs to confirm:
- Auth headers present/valid; cache headers as expected.
- Response status/text and content length match what the browser saw.
- Mismatch examples to look for:
- Server
durationis small butresource.first_byte.durationis large → network/CDN or queueing before your app. - Response length differs between server and browser fields → compression or proxy mutation (expected with HTTP/2 + gzip/brotli).
- Server
Field Glossary (front-end timings)#
These fields are reported by the browser and help you understand “time outside your code”:
resource.connect.duration: TCP connect time.resource.ssl.duration: TLS handshake time.resource.first_byte.duration: Time until first byte (server + network + intermediaries).resource.download.duration: Time to read response from socket.resource.duration: Sum of the above (roughly connect → download).
Tip: Compare resource.first_byte.duration with the service log duration. If first_byte ≫ service duration, most latency happened before your application code returned (CDN, WAF, upstream, or network).
Troubleshooting Correlation#
- No logs under the trace
- Ensure your logger attaches
<trace_id>/<span_id>and that log ingestion is enabled for the service. - Check sampling and log levels; the event might be filtered out.
- Ensure your logger attaches
- IDs don’t match between trace and logs
- A proxy/queue/async worker can start a new trace. Forward
traceparentheaders and bind server spans to incoming context.
- A proxy/queue/async worker can start a new trace. Forward
- The browser shows a long TTFB, but the service time is small
- Investigate CDN/WAF, upstreams, or network segments. Use headers (age, via, server-timing) to attribute the gap.
- No
browser.trace- Verify RUM init options; ensure CSP/ad-blockers aren’t disabling XHR/fetch instrumentation.
Need assistance or want to learn more about Middleware? Contact our support team at [email protected] or join our Slack channel.