Data Explorer Synthetic Monitoring
The Synthetic Monitoring Data Explorer is where you examine the health and performance of your HTTP checks. Use this page to answer three questions quickly: Is the endpoint up? How fast is it from each location? What exactly failed when it wasn’t?
Tests list#
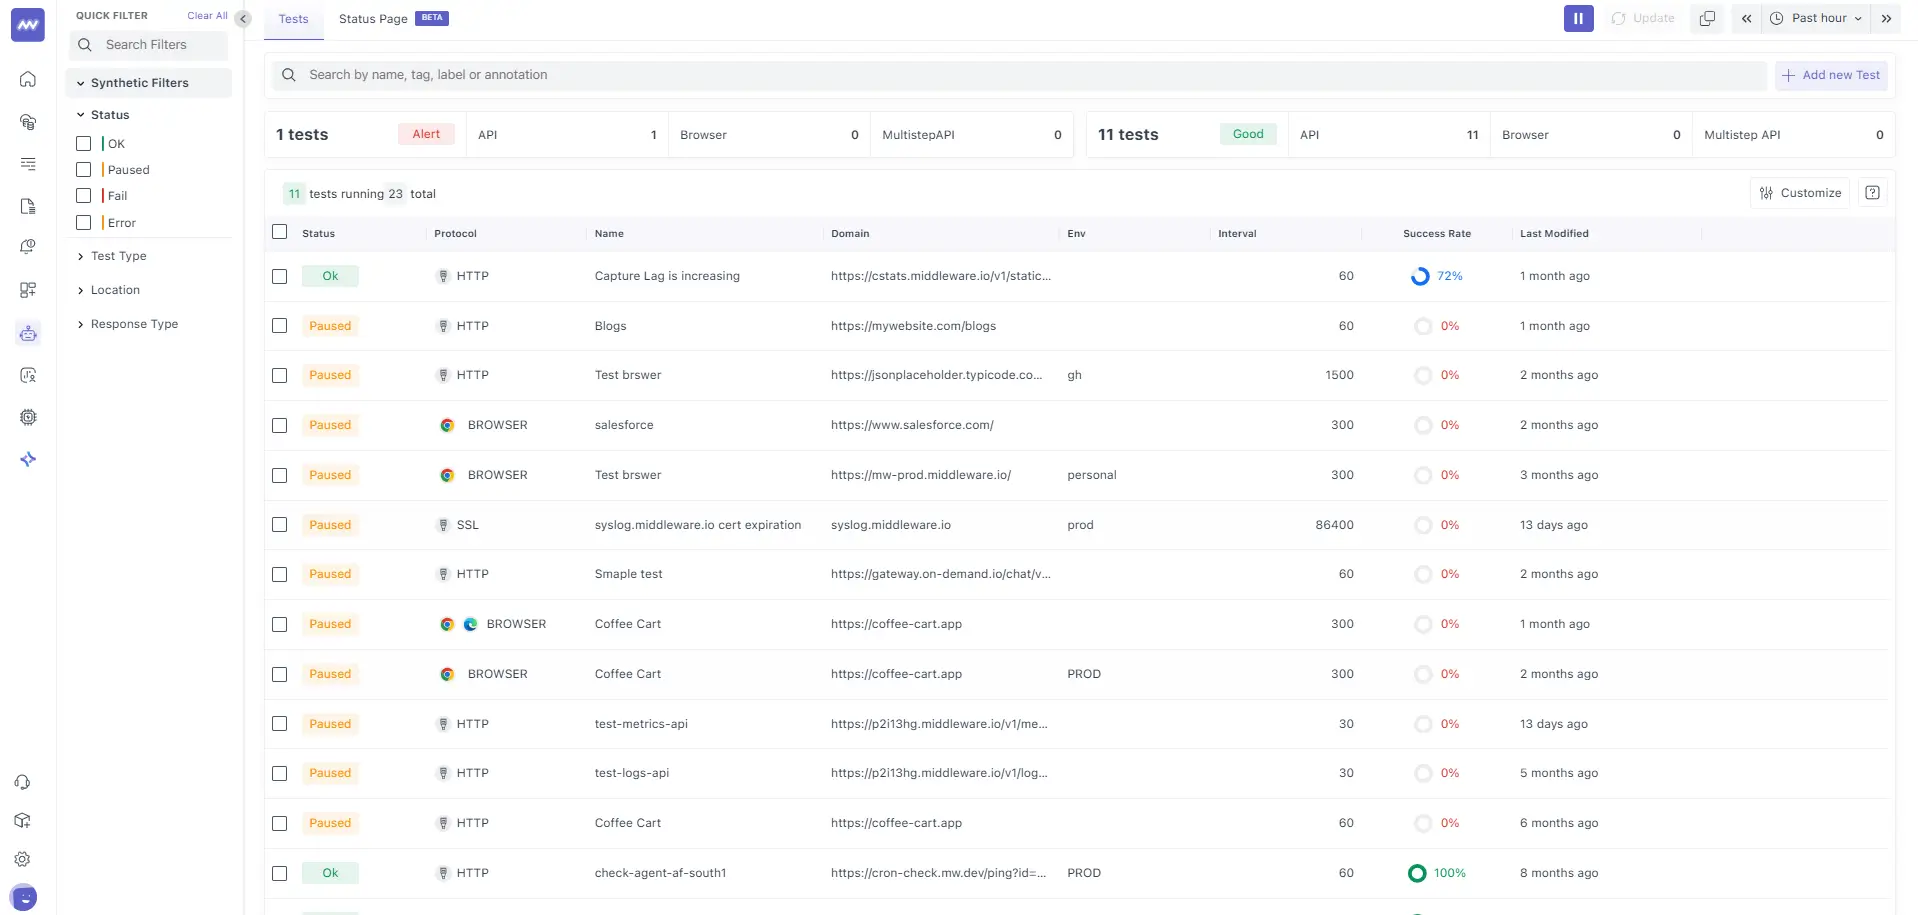
This view is your starting point. It lists every synthetic test and summarises its current reliability for the selected time window. From here, you can filter the estate, spot outliers, and jump into a specific test for deeper analysis.
Key elements
- Quick Filters (left rail): Filter by overall Status (OK, Paused, Fail, Error), Test Type (HTTP/Browser/SSL), Location, and Response Type.
- Search Bar: Find tests by name, tag, label, or annotation.
- Time Range & Refresh: The picker (e.g., Past hour) controls all metrics on this page; auto-refresh can be paused.
- Actions: Add a new Test to create a check; Customize to choose columns.
- Table Columns: Protocol, Name, Domain/Server, Env, Interval (run cadence in seconds), Success Rate (pass % within the time range), and Last Modified.
Test Overview#
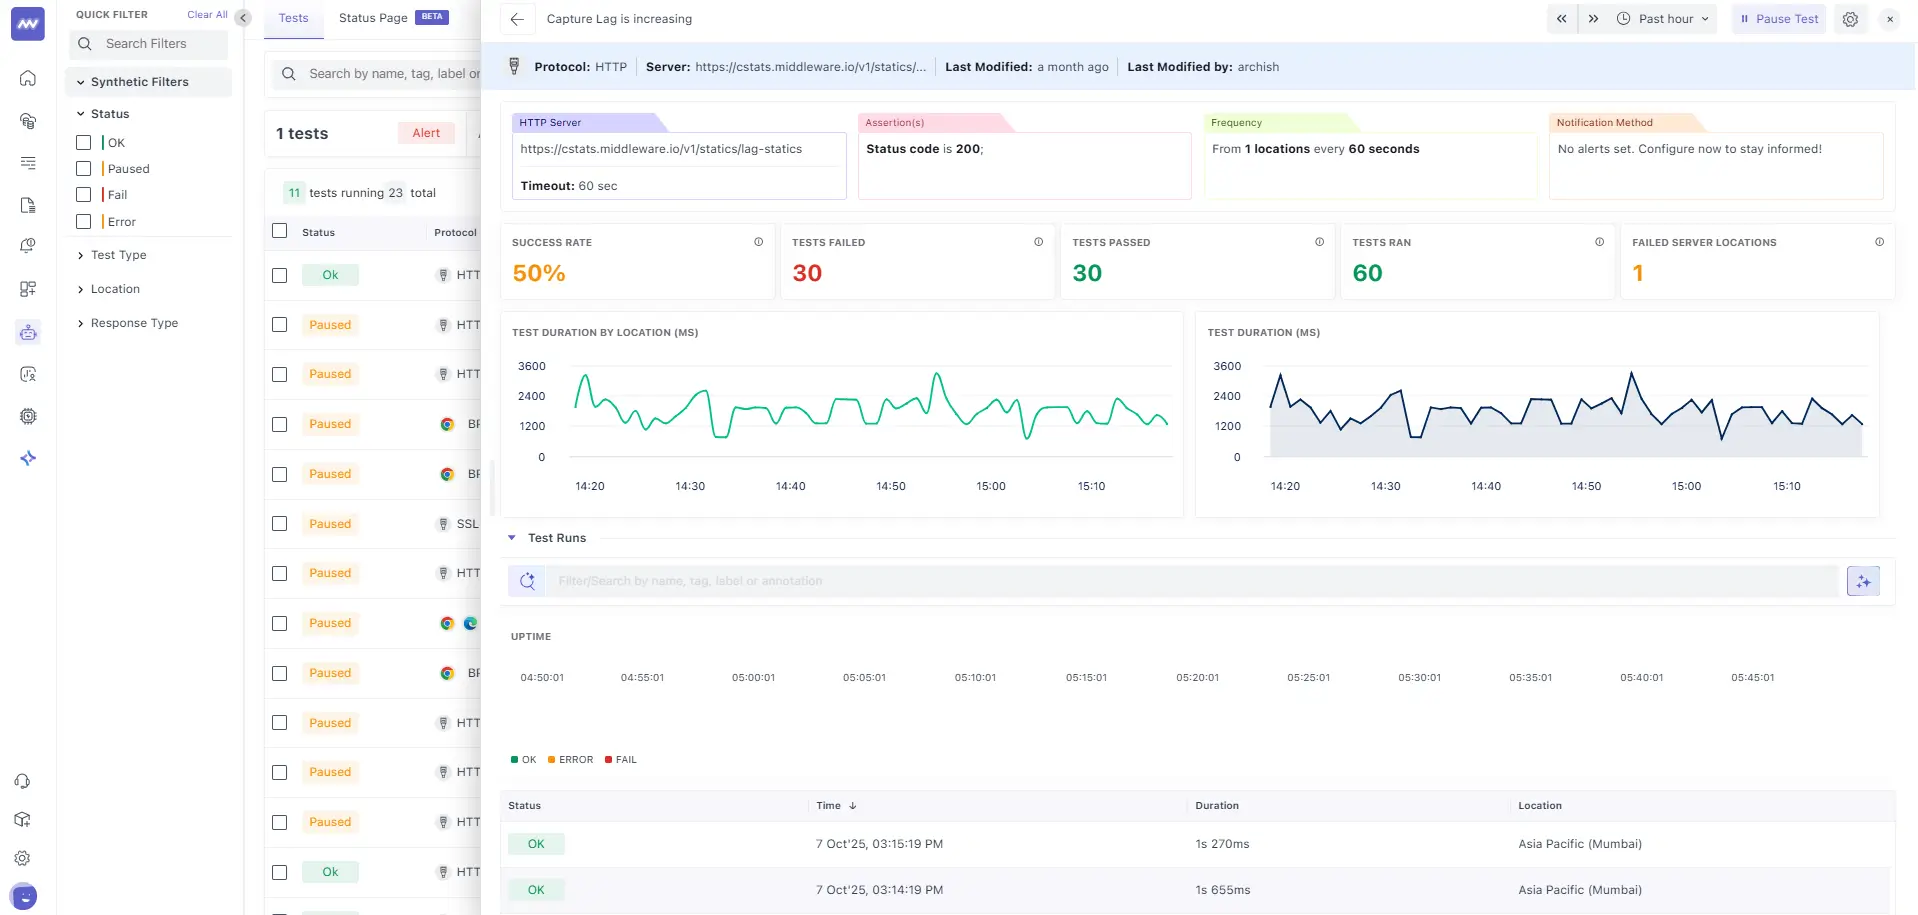
Once you open a test, the overview aggregates both configuration and observed health over the chosen time window. This page confirms what the test is doing, how often it runs, where it runs from, and how often it succeeds.
Header summary:
- Protocol and Server identify the runner and target endpoint.
- Last Modified states when and by whom the config last changed.
- HTTP Server repeats the full URL and the Timeout (e.g., 60 s).
- Assertion(s) list the checks that determine pass/fail (e.g., Status code is 200).
- Frequency tells you the schedule (e.g., From 1 location every 60 seconds).
- Notification Method indicates whether alerts are configured.
Health cards & charts:
- Success Rate, Tests Failed/Passed, Tests Ran: Reliability and volume for the window (e.g., 30/60 passed ⇒ 50%).
- Failed Server Locations: Number of probe locations that saw any failure.
- Test Duration by Location (ms): Time-series per location to expose regional variance.
- Test Duration (ms): Aggregate duration over time to reveal performance drift.
Recent Executions (timeline of runs)#
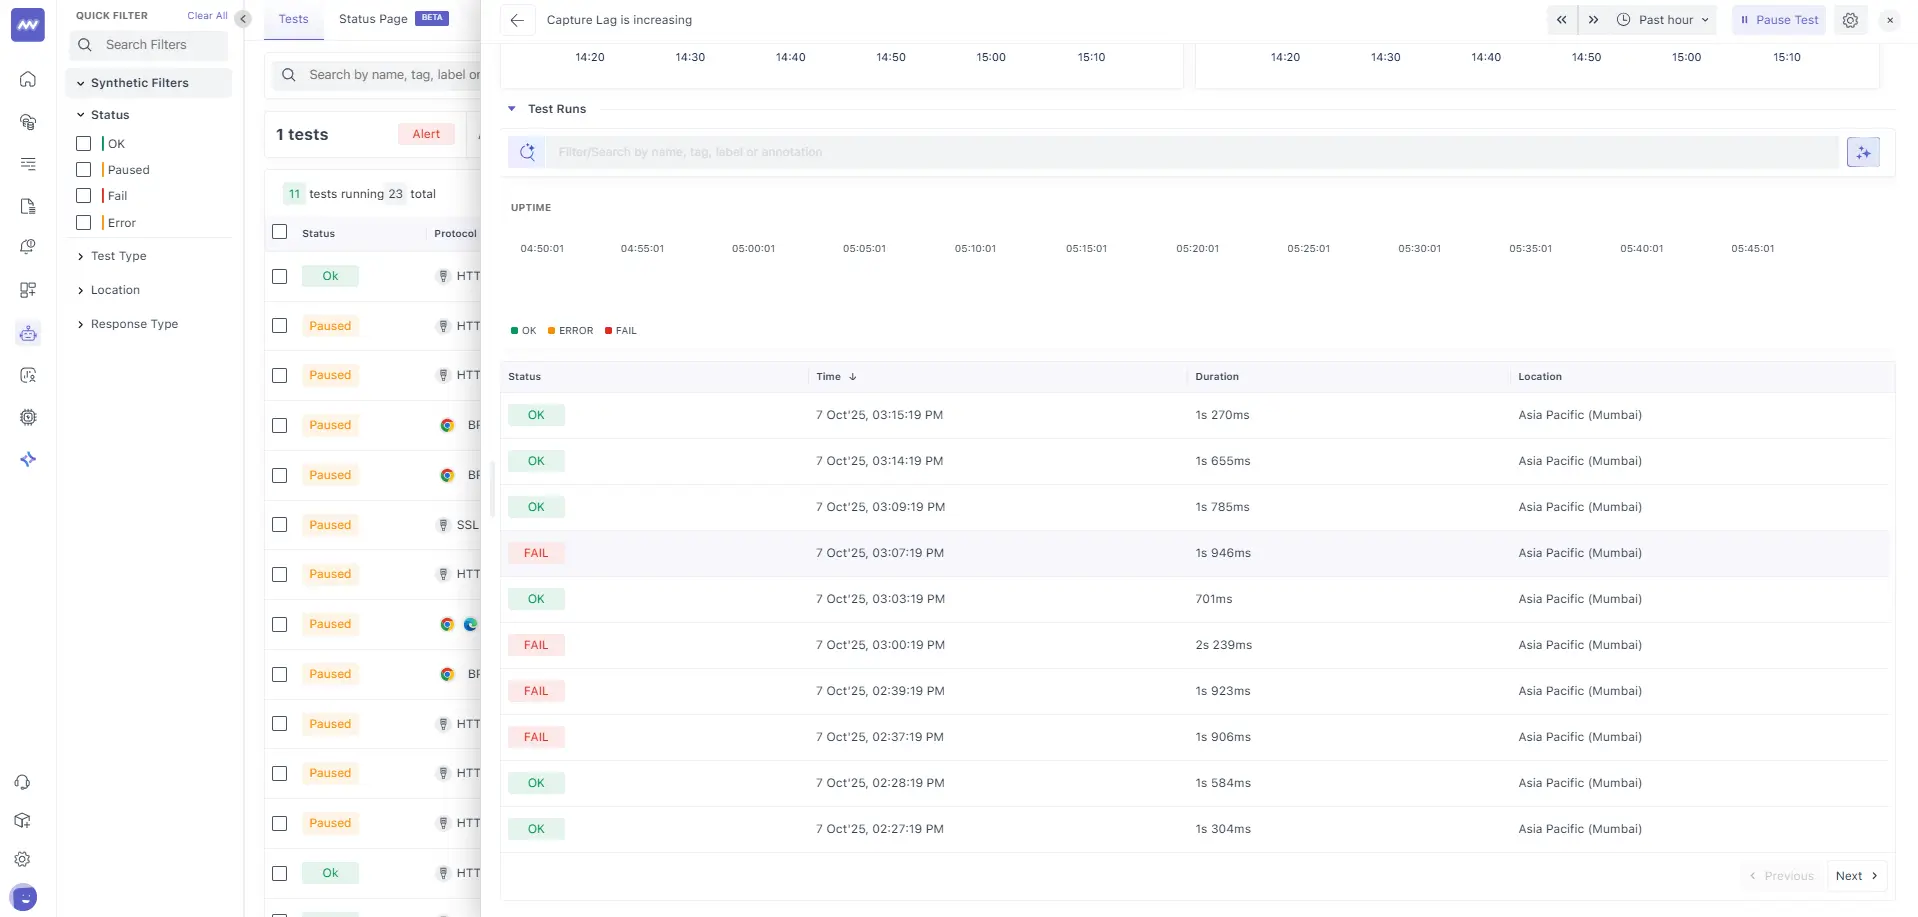
The runs timeline focuses on recency. It’s designed to answer, “What just happened?” and “Is the issue intermittent or sustained?” Each row represents one execution with its outcome, exact timestamp, duration, and probe location.
What to look for
- Alternating OK/FAIL rows: Indicates intermittent behaviour (e.g., flapping dependency or threshold-sensitive assertion).
- Duration swings: If durations jump from ~700 ms to ~1.9 s while outcomes flip, investigate server load or third-party latency.
- Location column: Failures isolated to a single region point to network or CDN issues; multi-region failures point to origin/backend.
Click any row to open the precise run and see which phase or assertion caused the result.
Single Run Detail#
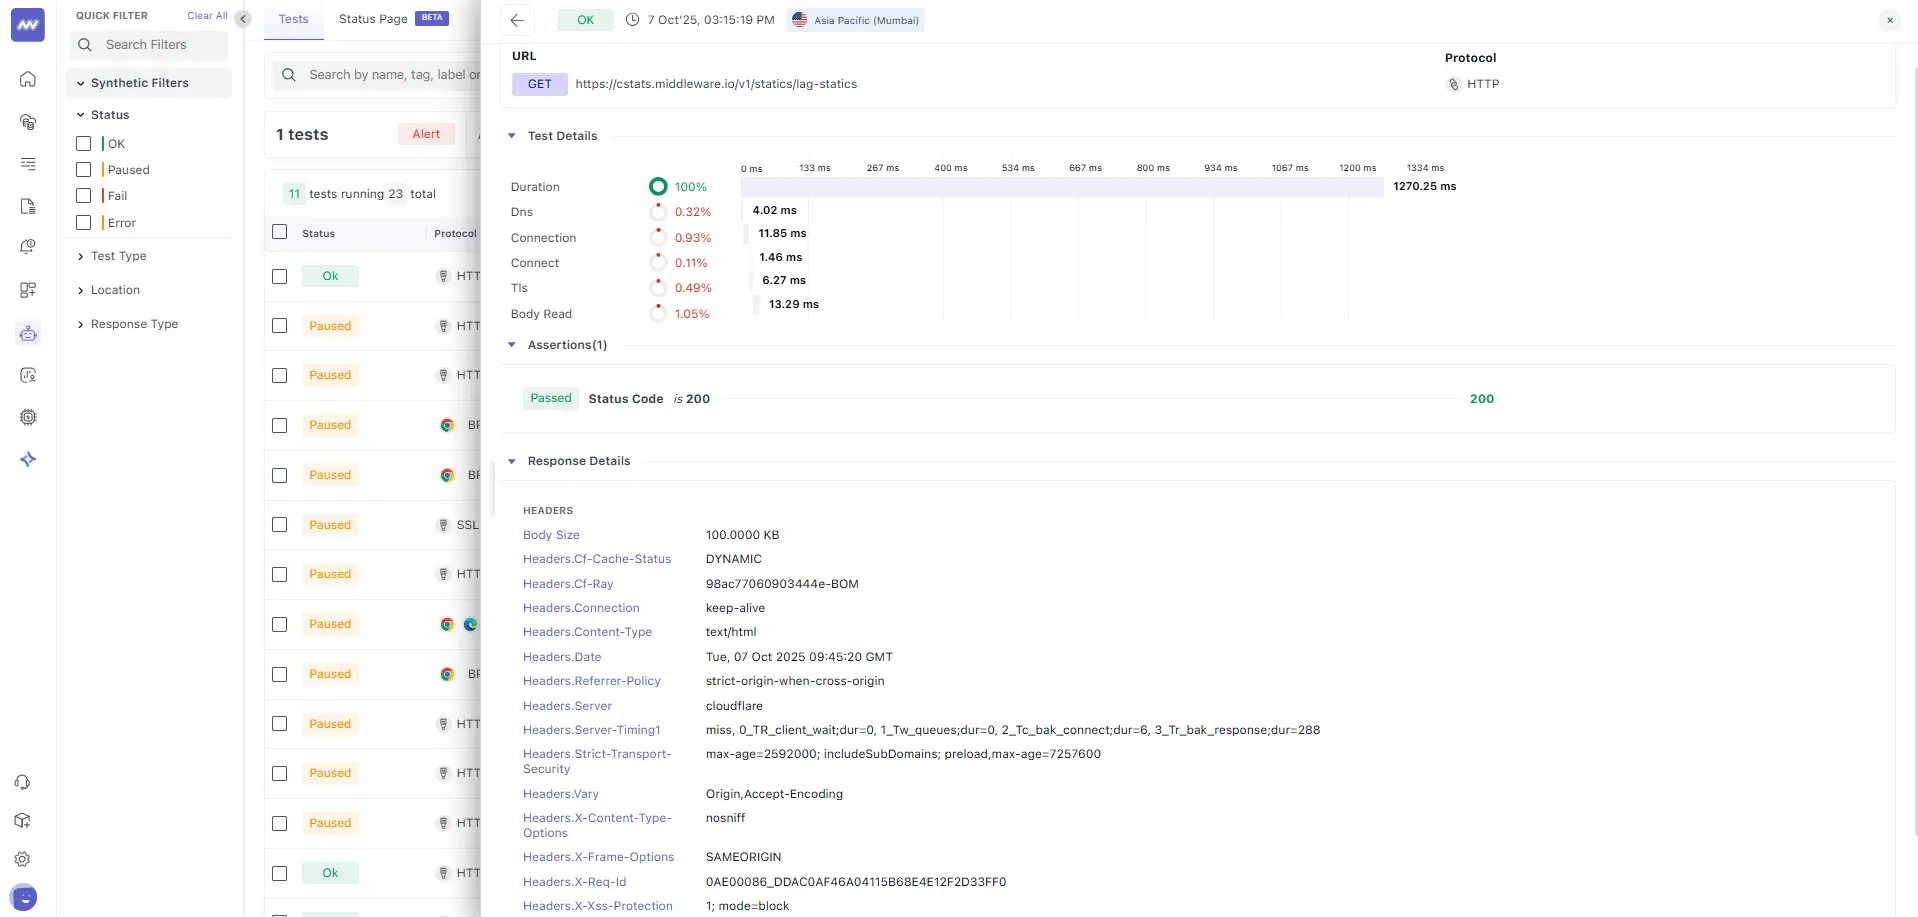
This drawer captures everything about one execution: where it ran, how long each network phase took, which assertions ran, and what the server returned in headers. It’s the primary surface for root-cause hints.
Run header The header shows the request (GET https://…/v1/statics/lag-statics), overall status (OK/FAIL/ERROR), timestamp, probe location (e.g., Asia Pacific — Mumbai), and runner (HTTP).
Timing waterfall (Test Details):
This breakdown explains where time accrues within the total Duration (e.g., 1270.25 ms).
- DNS: Hostname resolution (e.g., 4.02 ms).
- Connect / Connection: TCP setup and connection preparation (e.g., 1.46 ms connect; 11.85 ms connection).
- TLS: HTTPS handshake (e.g., 6.27 ms).
- Body Read: Time to download the payload (e.g., 13.29 ms).
The remaining portion of Duration is effectively server time / TTFB, which is the wait between establishing the connection and receiving the first byte. If handshake and read are tiny but the total is ~1.2–1.3 s, the bottleneck is the application/origin, not the network.
Assertions: Each configured check is evaluated and reported with a pass/fail label. A failing status/assertion here explains FAIL outcomes immediately (e.g., non-200 status, missing header, body pattern not found, or latency over SLA).
Response Headers#
Headers provide operational context for this exact run:
- Cache/CDN:
Cf-Cache-Status: DYNAMIC, Server: cloudflare(helps validate caching behaviour). - Security:
Strict-Transport-Security,X-Content-Type-Options,X-Frame-Options,X-XSS-Protection. - Content & transfer:
Content-Type,Content-Length/Body Size,Connection: keep-alive. - Traceability: IDs like
Cf-RayorX-Request-Idto correlate with backend logs.
Use headers to confirm security posture, cacheability, and routing, and to align this probe with server-side telemetry.
Field Reference and Interpretation#
This reference clarifies how values are calculated and how to act on them.
Success Rate: Percentage of runs that passed within the selected time range. With 60-second cadence and a one-hour window from one location, you expect about 60 runs.
Tests Ran / Passed / Failed: Volume counters for the same window. Sudden drops in Ran usually mean the test was paused or the probe location was temporarily unavailable.
Failed Server Locations: Count of probe locations that saw at least one failure. A value of 1 isolates the issue to a region; higher values suggest origin-side problems.
Duration: End-to-end time from request start through body download.
Think of it as: DNS + Connect + TLS + Server processing/TTFB + Body Read Only some phases are displayed explicitly; the gap is server processing.
Timeout: Upper bound for a run. Exceeding it marks the run as FAIL (timeout). Only increase this after confirming the endpoint is intentionally slow.
Assertions: Deterministic checks on the response (status, header presence/value, substring/regex in body, payload size, latency thresholds). Keep them specific but robust to content noise.
Need assistance or want to learn more about Middleware? Contact our support team at [email protected] or join our Slack channel.