SAP HANA Integration
The SAP HANA integration ingests performance and health metrics from your SAP HANA database(s) into Middleware, letting you track service and schema memory usage, connections, blocked transactions, volume I/O, replication backlog, license limits, and backup status.
Prerequisites#
- An SAP HANA 2 instance.
- Middleware Host Agent or Kubernetes Agent
v1.21.3or later, installed where it can reach your SAP HANA instance. See Installing the Agent - Network access from the agent to the SQL port of each database you want to monitor.
- A monitoring user with
CATALOG READplusSELECTaccess to theSYS.M_*monitoring views. Steps 1 to 3 below create one.
- The agent host must be running Linux.
- Multitenant (MDC) systems: each tenant database has its own
SYSschema and its own users and roles. The monitoring user is not shared across tenants — repeat Steps 1 through 4 against every tenant database you want to monitor.
Setup#
1 Create the Monitoring User#
Connect to the database you want to monitor and create a restricted user:
1CREATE RESTRICTED USER otel_monitoring_user PASSWORD "<PASSWORD>" NO FORCE_FIRST_PASSWORD_CHANGE;Here,
NO FORCE_FIRST_PASSWORD_CHANGEis required. By default SAP HANA forces a password change on first login. An unattended agent cannot perform that change, so without this clause every connection attempt fails.- A restricted user is used deliberately: it has no data-access privileges of its own and receives only the read permissions granted in Step 3.
Keep the double quotes around the password. An unquoted password is converted to upper case by SAP HANA, which will not match what you configure in the agent.
Password character restrictions. The agent passes the password to SAP HANA inside a connection URL, and that URL is percent-decoded before use. Choose a password that avoids the characters below, or authentication will fail.
- Avoid:
/?#%<>[]{}|\^`"and spaces. - Safe:
@and:are handled correctly and may be used. %is the most dangerous of these because it fails silently. A sequence such as%41is decoded to a different character (%41becomesA), so the agent authenticates with a password that is not the one you set. The connection simply fails to authenticate, with no error identifying the password as the cause.
Also confirm the password meets your system's policy. The defaults are a minimum of 8 characters containing upper case, lower case, and a digit (minimal_password_length = 8, password_layout = Aa1). Your SAP HANA administrator can change both.
2 Enable Client Connections#
A restricted user can only connect over HTTP/HTTPS until client connect is enabled. Grant SQL connectivity:
1ALTER USER otel_monitoring_user ENABLE CLIENT CONNECT;
2GRANT RESTRICTED_USER_JDBC_ACCESS TO otel_monitoring_user;
Here,
ENABLE CLIENT CONNECTallows the user to open a SQL connection at all.RESTRICTED_USER_JDBC_ACCESSis what the agent needs. This was confirmed against a SAP HANA 2 tenant: with this role alone, the agent authenticated and collected metrics.
If your organisation's policy also expects the ODBC access role, granting it as well is harmless for a read-only monitoring user:
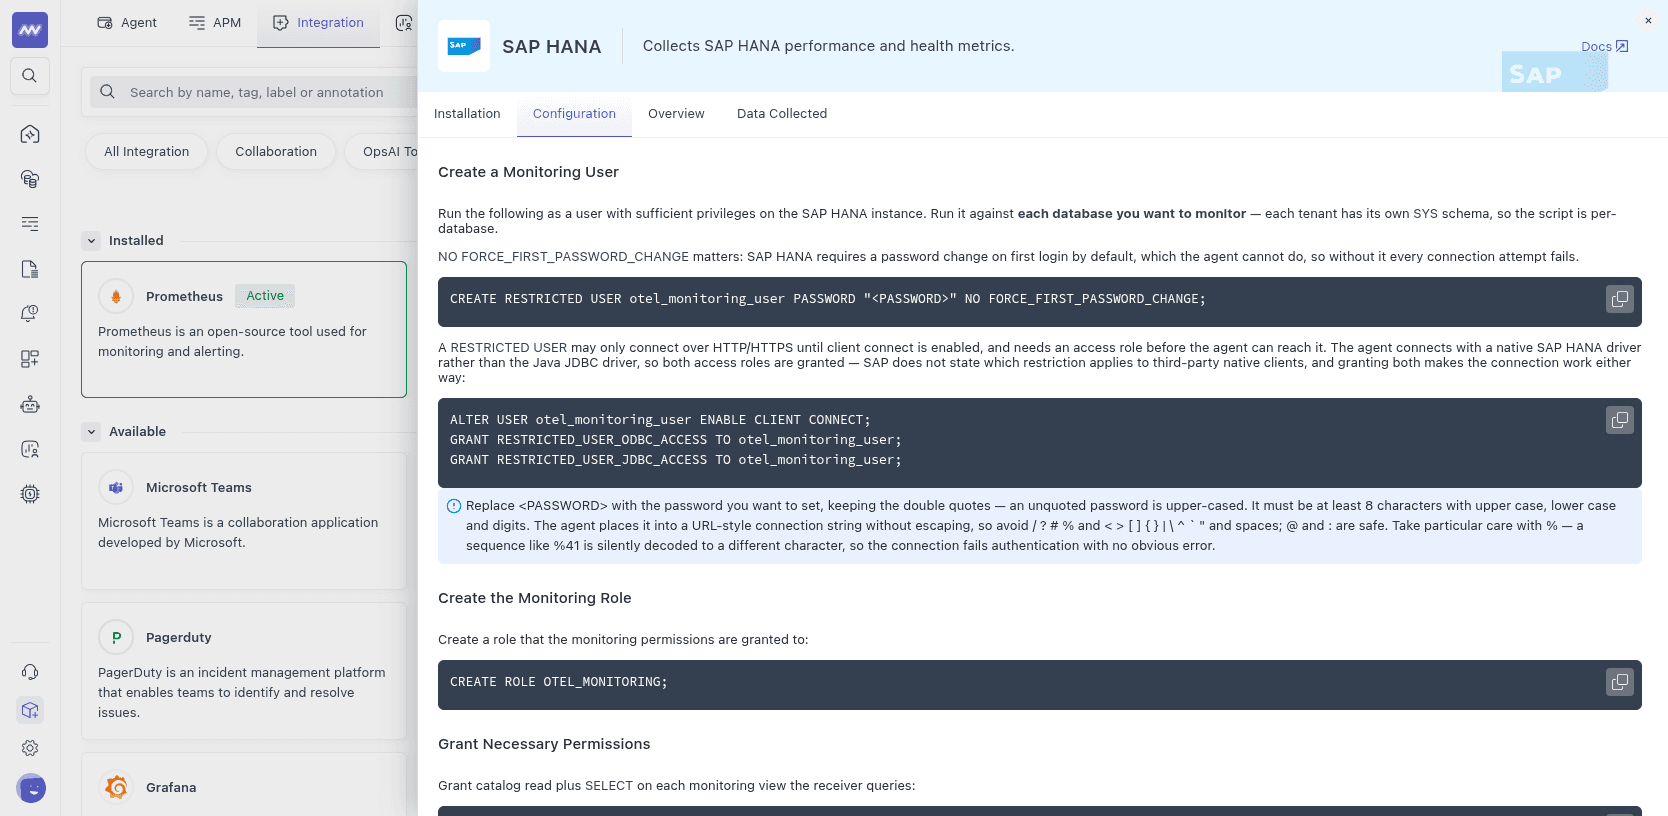
1GRANT RESTRICTED_USER_ODBC_ACCESS TO otel_monitoring_user;You can copy these commands directly from the Configuration tab of the SAP HANA integration in Middleware:
3 Create the Monitoring Role and Grant Permissions#
Create a role with read access to the monitoring views the integration queries, then assign it to the user:
1CREATE ROLE OTEL_MONITORING;
2GRANT CATALOG READ TO OTEL_MONITORING;
3GRANT SELECT ON SYS.M_BACKUP_CATALOG TO OTEL_MONITORING;
4GRANT SELECT ON SYS.M_BLOCKED_TRANSACTIONS TO OTEL_MONITORING;
5GRANT SELECT ON SYS.M_CONNECTIONS TO OTEL_MONITORING;
6GRANT SELECT ON SYS.M_CS_ALL_COLUMNS TO OTEL_MONITORING;
7GRANT SELECT ON SYS.M_CS_TABLES TO OTEL_MONITORING;
8GRANT SELECT ON SYS.M_DATABASE TO OTEL_MONITORING;
9GRANT SELECT ON SYS.M_DISKS TO OTEL_MONITORING;
10GRANT SELECT ON SYS.M_HOST_RESOURCE_UTILIZATION TO OTEL_MONITORING;
11GRANT SELECT ON SYS.M_LICENSES TO OTEL_MONITORING;
12GRANT SELECT ON SYS.M_RS_TABLES TO OTEL_MONITORING;
13GRANT SELECT ON SYS.M_SERVICE_COMPONENT_MEMORY TO OTEL_MONITORING;
14GRANT SELECT ON SYS.M_SERVICE_MEMORY TO OTEL_MONITORING;
15GRANT SELECT ON SYS.M_SERVICE_REPLICATION TO OTEL_MONITORING;
16GRANT SELECT ON SYS.M_SERVICE_STATISTICS TO OTEL_MONITORING;
17GRANT SELECT ON SYS.M_SERVICE_THREADS TO OTEL_MONITORING;
18GRANT SELECT ON SYS.M_SERVICES TO OTEL_MONITORING;
19GRANT SELECT ON SYS.M_VOLUME_IO_TOTAL_STATISTICS TO OTEL_MONITORING;
20GRANT SELECT ON SYS.M_WORKLOAD TO OTEL_MONITORING;
21GRANT SELECT ON _SYS_STATISTICS.STATISTICS_CURRENT_ALERTS TO OTEL_MONITORING;
22GRANT OTEL_MONITORING TO otel_monitoring_user;
Here,
- Each
GRANT SELECTcorresponds to a monitoring view the integration reads. Grant all of them — removing one silently drops the metrics sourced from that view. CATALOG READallows the user to read system catalog metadata.- These are read-only permissions on system views. No permission to read application data is granted.
4 Identify the SQL Port#
The agent connects to one specific database per configured endpoint, selected entirely by port — there is no database-name setting. You therefore need the SQL port of each database you want to monitor.
Query the ports rather than assuming them. Connect to SYSTEMDB as an existing administrator-level user and run:
1SELECT DATABASE_NAME, SERVICE_NAME, SQL_PORT FROM SYS_DATABASES.M_SERVICES WHERE SQL_PORT > 0;Here,
- Run this once, and only from
SYSTEMDB. TheSYS_DATABASESschema is a cross-database catalog that exists only on aSYSTEMDBconnection; running it against a tenant fails with an object-not-found error. - Do not run this as
otel_monitoring_user. That user is created per tenant and cannot querySYS_DATABASESfrom any connection. - Each tenant's SQL port is the one reported for its
indexserver. Note the port of each database you want to monitor and use it in the next step.
Point the agent at each tenant's own port. The agent reads only the plain SYS.* views of whichever database it connects to, so an endpoint aimed at SYSTEMDB collects the nameserver's own near-empty metrics rather than your tenant's workload. It connects and reports success either way, which makes this easy to miss.
The tenant port is also the only option. Interactive clients such as hdbsql can connect to the SYSTEMDB entry port and name a tenant to be redirected to it; the agent cannot, because it builds a bare connection string with no database-name parameter. Connect to each tenant's port directly.
Use the ports this query returns, not ports derived from the naming convention. SAP HANA generally allocates SQL ports as 3NN13 for SYSTEMDB and 3NN15 upward for tenants, where NN is the instance number — but the actual allocation varies by build and by the order in which tenants were created. On a verified HANA Express instance 90, for example, SYSTEMDB reported 39017, the tenant was on 39041, and 39015 was not in use at all. Pointing the agent at a guessed port produces a connection failure that looks like a network or credentials problem.
5 Open the Integration in Middleware#
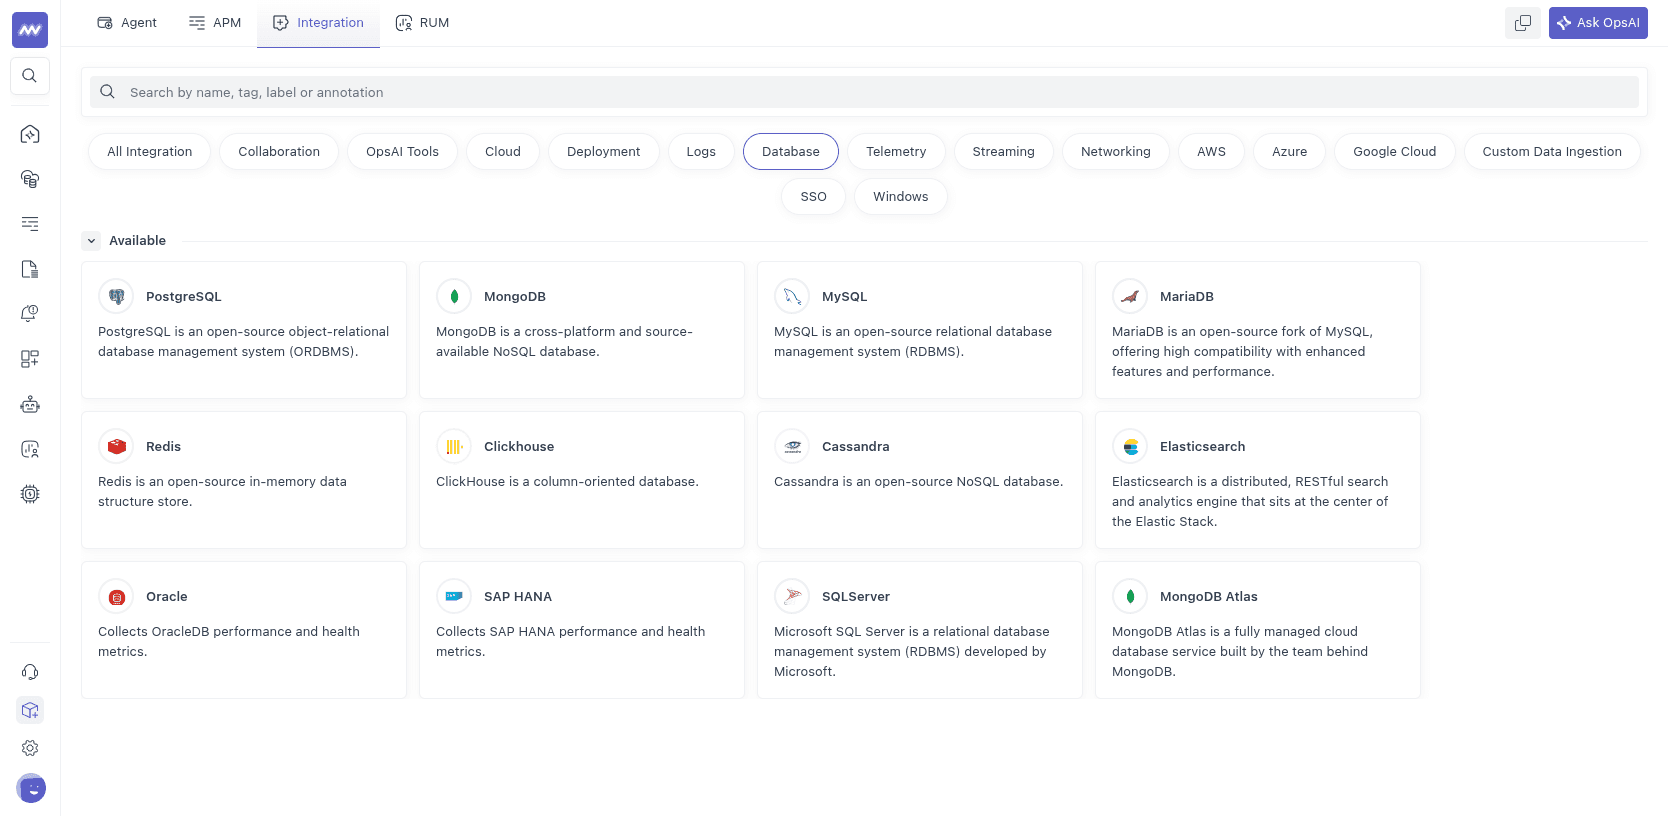
In Middleware, go to Installations → All Integrations, filter by the Database category, and select SAP HANA.
6 Configure the Connection#
On the Installation tab, select the host where the agent runs, then complete the form:
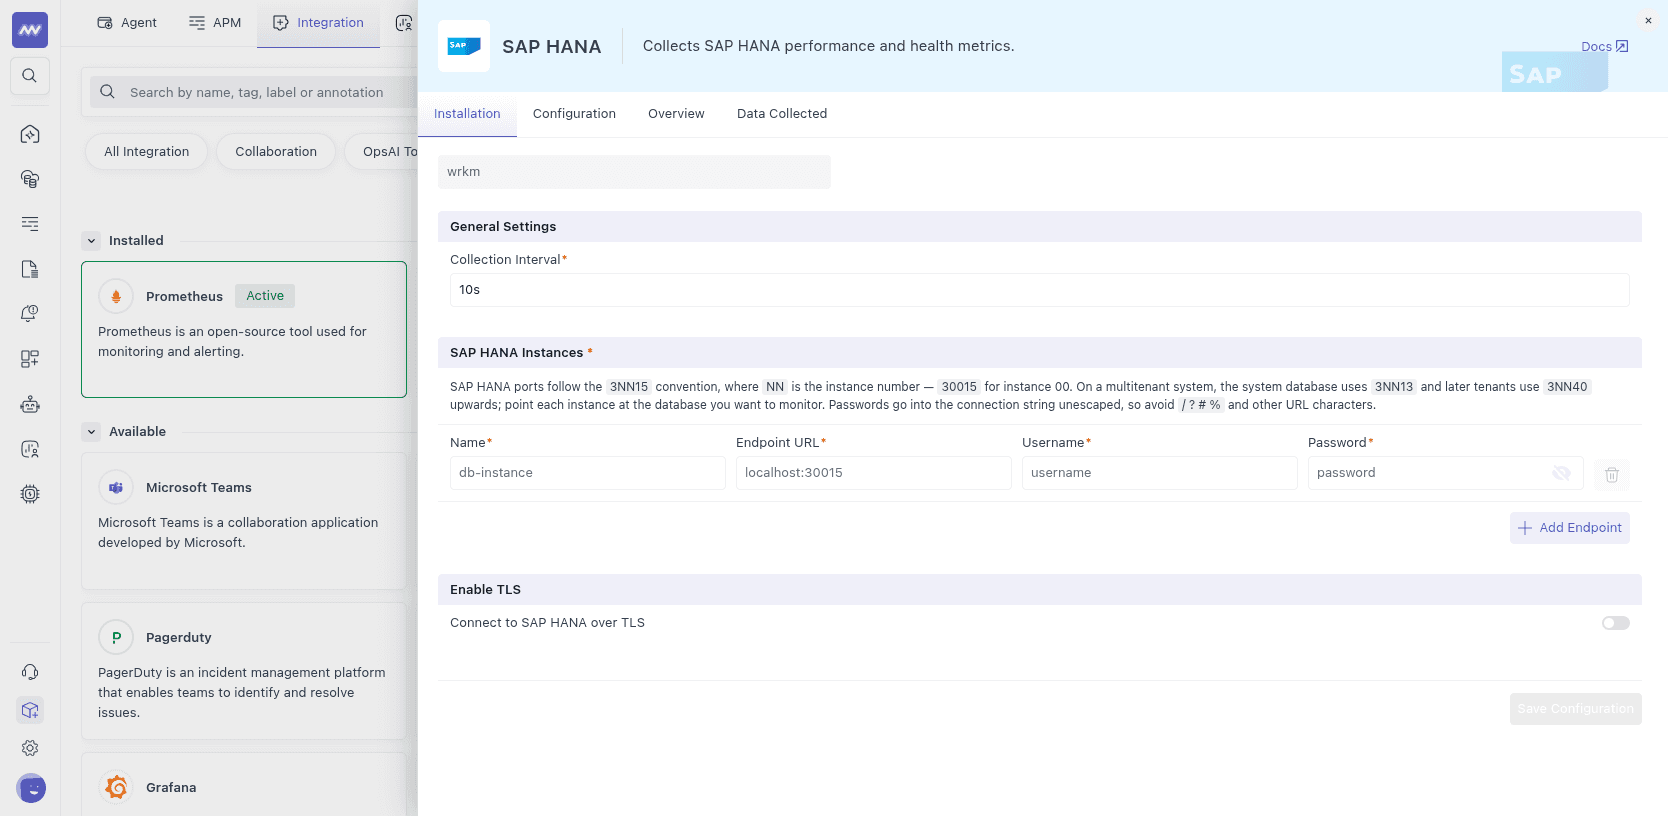
- Collection Interval: how often metrics are scraped. Defaults to
10s. - SAP HANA Instances — one row per database you want to monitor:
- Name: a label for this instance (for example
db-instance). - Endpoint URL:
host:portof the database, using the port identified in Step 4 (for examplehana01.acme.local:30015). - Username: the monitoring user from Step 1 (
otel_monitoring_user). - Password: that user's password, entered without the surrounding double quotes used in the SQL statement.
- Name: a label for this instance (for example
- Enable TLS (optional): turn this on to connect over TLS and supply the certificate details.
Use Add Endpoint to monitor more than one database or tenant. Each endpoint is collected independently, so a multitenant system needs one row per tenant.
7 Save and Enable the Integration#
Click Save Configuration. Once saved, the agent begins collecting metrics on its next scrape.
Visualize Your Data#
The Data Collected tab of the SAP HANA integration lists the metrics this integration reports. Use it to confirm data is arriving after setup.
The metrics listed below are then available to build dashboards and alerts on, in the same way as any other metric in Middleware.
Metrics Collected#
Every metric carries the db.system and saphana.host resource attributes. The Attributes column lists the additional dimensions each metric is broken down by.
Some metrics only appear when the underlying feature is in use. On a system with no system replication configured, saphana.replication.* reports nothing; saphana.license.* is empty on licenses that expose no usage limits; and saphana.backup.latest and saphana.transaction.blocked stay absent until a backup has run or lock contention has occurred. Missing metrics in these groups usually mean the feature is unused, not that the integration is misconfigured.
Alerts and Uptime#
| Metric | Unit | Description | Attributes |
|---|---|---|---|
saphana.alert.count | {alerts} | Number of current alerts. | rating |
saphana.uptime | s | The uptime of the database. | database, system |
Backup#
| Metric | Unit | Description | Attributes |
|---|---|---|---|
saphana.backup.latest | s | The age of the latest backup by start time. | — |
Host CPU and Memory#
| Metric | Unit | Description | Attributes |
|---|---|---|---|
saphana.cpu.used | ms | Total CPU time spent. | type |
saphana.host.memory.current | By | The amount of physical memory on the host. | state |
saphana.host.swap.current | By | The amount of swap space on the host. | state |
Connections and Transactions#
| Metric | Unit | Description | Attributes |
|---|---|---|---|
saphana.connection.count | {connections} | The number of current connections. | status |
saphana.transaction.count | {transactions} | The number of transactions. | type |
saphana.transaction.blocked | {transactions} | The number of transactions waiting for a lock. | — |
Disk and Volume I/O#
| Metric | Unit | Description | Attributes |
|---|---|---|---|
saphana.disk.size.current | By | The disk size. | path, state, usage_type |
saphana.volume.operation.count | {operations} | The number of operations executed. | path, type, usage_type |
saphana.volume.operation.size | By | The size of operations executed. | path, type, usage_type |
saphana.volume.operation.time | ms | The time spent executing operations. | path, type, usage_type |
Instance Memory#
| Metric | Unit | Description | Attributes |
|---|---|---|---|
saphana.instance.code_size | By | The instance code size, including shared libraries of SAP HANA processes. | — |
saphana.instance.memory.current | By | The size of the memory pool for all SAP HANA processes. | state |
saphana.instance.memory.shared.allocated | By | The shared memory size of SAP HANA processes. | — |
saphana.instance.memory.used.peak | By | The peak memory from the memory pool used by SAP HANA processes since the instance started (this is a sample-based value). | — |
License#
| Metric | Unit | Description | Attributes |
|---|---|---|---|
saphana.license.expiration.time | s | The amount of time remaining before license expiration. | product, system |
saphana.license.limit | {licenses} | The allowed product usage as specified by the license (for example, main memory). | product, system |
saphana.license.peak | {licenses} | The peak product usage value during last 13 months, measured periodically. | product, system |
Network#
| Metric | Unit | Description | Attributes |
|---|---|---|---|
saphana.network.request.average_time | ms | The average response time calculated over recent requests. | — |
saphana.network.request.count | {requests} | The number of active and pending service requests. | state |
saphana.network.request.finished.count | {requests} | The number of service requests that have completed. | type |
Replication#
| Metric | Unit | Description | Attributes |
|---|---|---|---|
saphana.replication.average_time | us | The average amount of time consumed replicating a log. | mode, port, primary, secondary |
saphana.replication.backlog.size | By | The current replication backlog size. | mode, port, primary, secondary |
saphana.replication.backlog.time | us | The current replication backlog. | mode, port, primary, secondary |
Store Memory#
| Metric | Unit | Description | Attributes |
|---|---|---|---|
saphana.column.memory.used | By | The memory used in all columns. | subtype, type |
saphana.row_store.memory.used | By | The used memory for all row tables. | type |
saphana.component.memory.used | By | The memory used in components. | component |
Schemas#
| Metric | Unit | Description | Attributes |
|---|---|---|---|
saphana.schema.memory.used.current | By | The memory size for all tables in schema. | schema, type |
saphana.schema.memory.used.max | By | The estimated maximum memory consumption for all fully loaded tables in schema (data for open transactions is not included). | schema |
saphana.schema.operation.count | {operations} | The number of operations done on all tables in schema. | schema, type |
saphana.schema.record.compressed.count | {records} | The number of entries in main during the last optimize compression run for all tables in schema. | schema |
saphana.schema.record.count | {records} | The number of records for all tables in schema. | schema, type |
Services#
| Metric | Unit | Description | Attributes |
|---|---|---|---|
saphana.service.count | {services} | The number of services in a given status. | status |
saphana.service.thread.count | {threads} | The number of service threads in a given status. | status |
saphana.service.code_size | By | The service code size, including shared libraries. | service |
saphana.service.stack_size | By | The service stack size. | service |
saphana.service.memory.used | By | The used memory from the operating system perspective. | service, type |
saphana.service.memory.limit | By | The configured maximum memory pool size. | service |
saphana.service.memory.effective_limit | By | The effective maximum memory pool size, calculated considering the pool sizes of other processes. | service |
saphana.service.memory.heap.current | By | The size of the heap portion of the memory pool. | service, state |
saphana.service.memory.shared.current | By | The size of the shared portion of the memory pool. | service, state |
saphana.service.memory.compactors.allocated | By | The part of the memory pool that can potentially (if unpinned) be freed during a memory shortage. | service |
saphana.service.memory.compactors.freeable | By | The memory that can be freed during a memory shortage. | service |
Troubleshooting#
Integrations menu not visible
Your account likely lacks Installation permissions. Ask an admin to add Installation to your role in Settings.
No metrics appear after saving
Confirm the agent version. SAP HANA configuration is only generated for agent v1.21.3 or later; an agent on v1.21.2 or earlier saves the integration successfully but never receives a collection config. Upgrade the agent and retry.
Authentication fails
- Confirm the monitoring user was created with
NO FORCE_FIRST_PASSWORD_CHANGE. Without it, SAP HANA requires a password change the agent cannot perform. - Re-check the password against the character restrictions in Step 1.
%is the most common cause because it fails silently — if the password contains%, change it to a password without it and retry before investigating anything else. - Confirm the password was entered in Middleware without the double quotes used in the
CREATE RESTRICTED USERstatement.
Connection is refused or times out
- Confirm the port matches the specific database you intend to monitor (see Step 4). Pointing at
SYSTEMDBwhen you meant a tenant, or at the first tenant when you meant a later one, connects to the wrong database or fails outright. - Check DNS, firewall rules, and security groups between the agent host and the database.
ENABLE CLIENT CONNECT errors or the user cannot connect over SQL
A restricted user cannot open a SQL connection until Step 2 is applied. Re-run the ALTER USER ... ENABLE CLIENT CONNECT statement and the RESTRICTED_USER_JDBC_ACCESS grant, then retry.
Object-not-found running the port discovery query
SYS_DATABASES exists only on a SYSTEMDB connection. Reconnect to SYSTEMDB (typically port 3NN13) as an administrator-level user, not as otel_monitoring_user.
Permission errors reading monitoring views
Re-apply the full GRANT list from Step 3 against the tenant in question, then confirm the role is assigned:
1SELECT * FROM SYS.GRANTED_ROLES WHERE GRANTEE = 'OTEL_MONITORING_USER';Metrics arrive, but the values look empty or unrelated to your workload
The endpoint is probably pointed at SYSTEMDB rather than at a tenant. The agent reports success in that case but collects the nameserver's own metrics. Re-run the port query from Step 4 and use the port reported for the tenant's indexserver.
Only some tenants report data
Each tenant database needs its own monitoring user, its own grants, and its own endpoint in the integration form. Repeat the full setup for every tenant you want to monitor.
Need assistance or want to learn more about Middleware? Get in touch with us via our Contact Us or join our Slack channel.