RUM Data Explorer
This guide explains what you see in the RUM Data Explorer and how to use every panel to answer performance and reliability questions.
Performance Monitor
The Performance Monitor is your birds‑eye view across Core Web Vitals, errors, releases, APIs, and traffic. Use the time range picker and the search/filter bar (name, tag, label, annotation) to scope data. From here, you can drill into specific tabs: Overview, Performance, Errors, Deployments, and API.
1. Overview
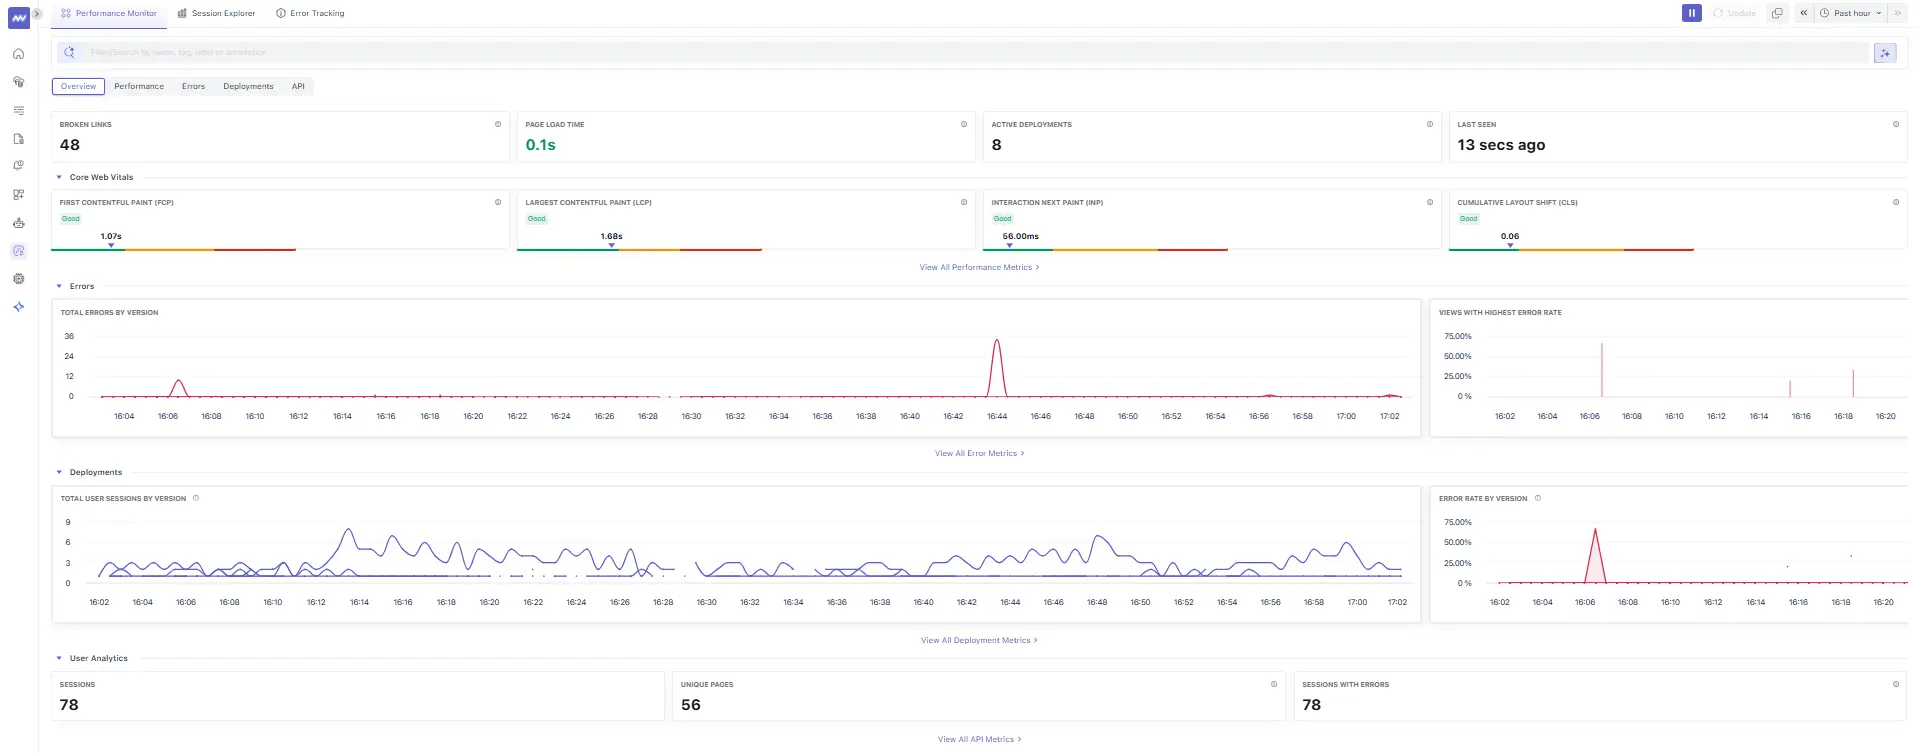
What you’re seeing
- Broken Links: Count of navigations returning 4xx/5xx. Click to list the affected pages so you can fix stale routes and sitemap issues.
- Core Web Vitals: Current health status for:
- FCP (First Contentful Paint): Time until the first content renders. The screenshot shows a Good value (~1.0–1.5s). Aim <1.8s.
- LCP (Largest Contentful Paint): Loading of the main content. Shown as Good (~1.6–1.8s). Aim <2.5s.
- INP (Interaction to Next Paint): Responsiveness after user input. Shown Good (tens of ms). Aim <200ms.
- CLS (Cumulative Layout Shift): Visual stability. Shown Good (~0.06). Aim <0.1.
- Active Deployments: Number of versions currently observed by RUM.
- Last Seen: Recency of the latest event ingested (helps catch data pipeline issues).
- Errors & Deployments charts: Quick trendlines for total errors by version and error rate by version to spot regressions.
- User Analytics: Session and page coverage to understand traffic volume and breadth.
How to use it
- If a web vital drifts into yellow/red, pivot to Performance to see which page or third‑party caused it.
- If error rate spikes, jump to Errors or Deployments to see which release/route regressed.
2. Performance
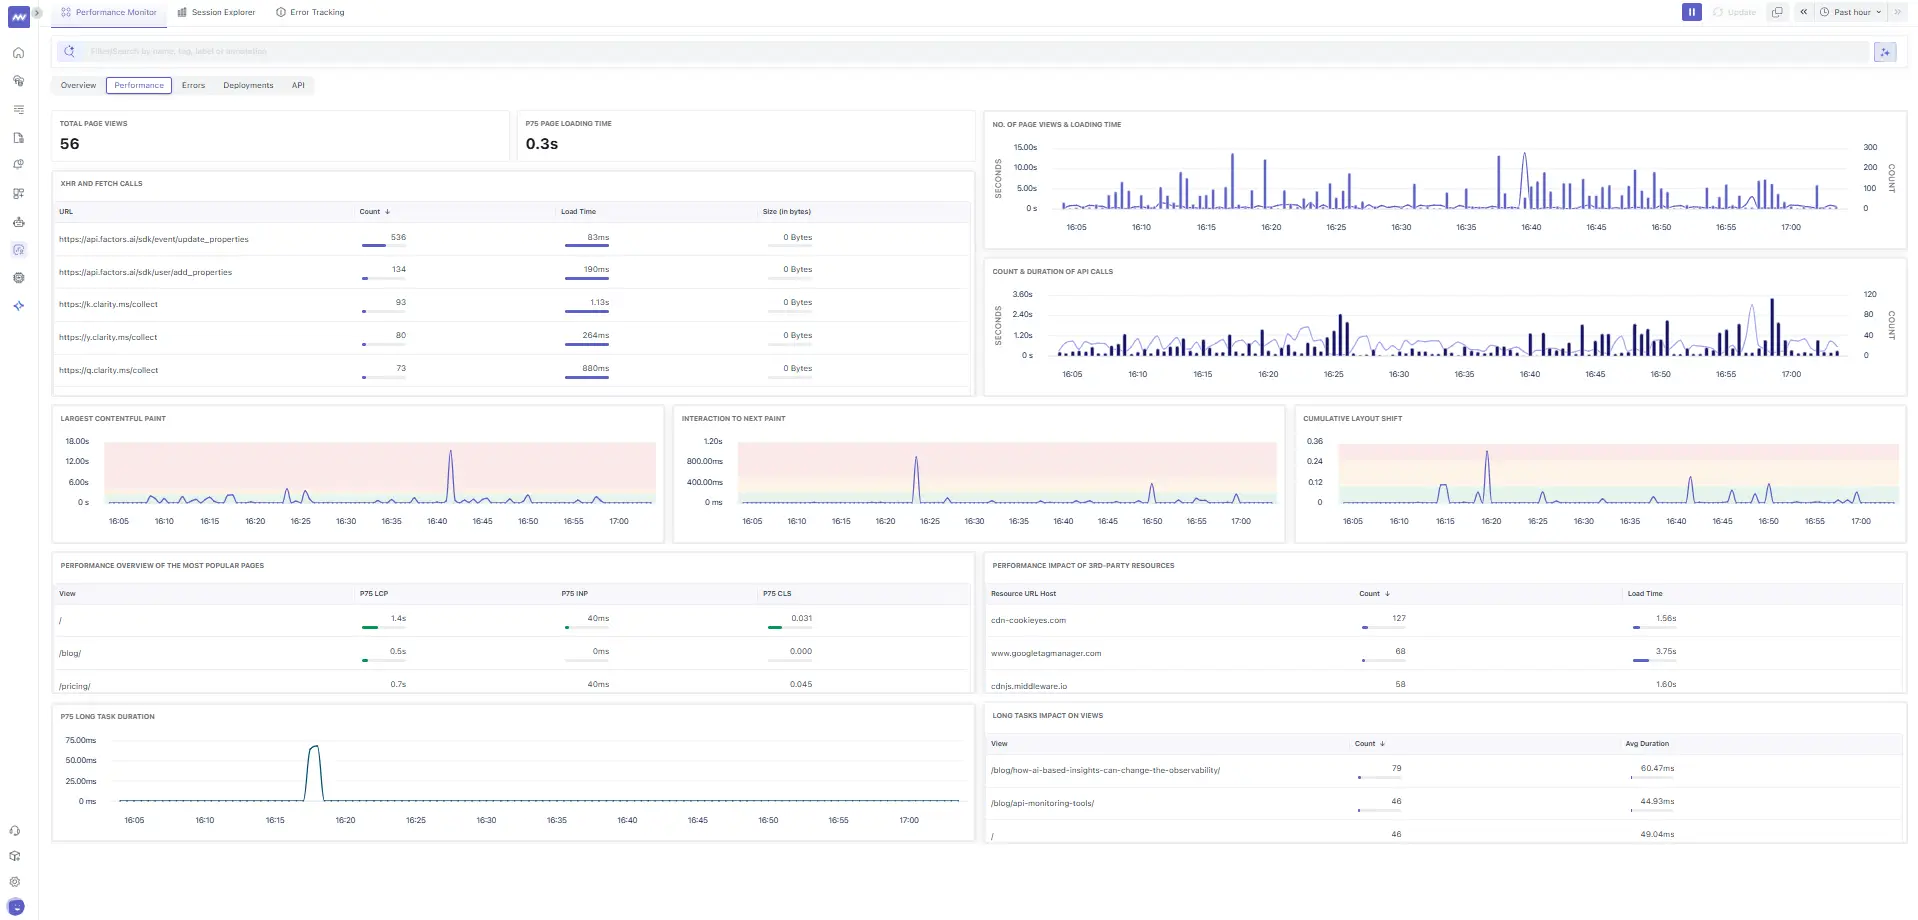
Key panels
- XHR & Fetch Calls table: Top network endpoints with Count, Load Time, and Size. Example endpoints include analytics and session‑replay providers (e.g.,
https://api.factors.ai/...,https://k.clarity.ms/collect). Use it to:- Spot slow APIs (long Load Time) and chatty scripts (high Count).
- Flag third‑party bloat to defer, lazy‑load, or move to workers.
- No. of Page Views & Loading Time: Distribution of page loads over time; verify if spikes coincide with latency increases.
- Count & Duration of API Calls: Shows concurrency bursts; use to size backends or rate‑limit.
- Largest Contentful Paint (time‑series): Track spikes per minute to correlate with deployments or CDN changes.
- Interaction to Next Paint (time‑series): Catch input jank from long tasks or main‑thread contention.
- Cumulative Layout Shift (time‑series): See when layout jumps occur; often due to image/video dimensions or late‑loading fonts.
- Performance of Popular Pages: Per‑view p75 LCP/INP/CLS; prioritize pages with traffic and poor p75.
- Performance Impact of 3rd‑party Resources: Posts (e.g.,
cdn-cookieyes.com,www.googletagmanager.com,cdnjs.middleware.io) with counts and load time. - Long Tasks' Impact on Views: Time spent in tasks >50ms; reduce main-thread work (split bundles, code-split, avoid synchronous JS).
Practical actions
- Budget 3rd‑party scripts; defer non‑critical trackers.
- Fix CLS by adding width/height to media and reserving space for ads/widgets.
- Use
rel=preloadfor critical LCP assets and serve images in next‑gen formats.
3. Errors (Performance View)

What’s here
- Total Errors by Version and Total Error Rate: Is a specific release noisier?
- Code Error Count vs Network Error Count: Quickly separate JS/runtime exceptions from HTTP failures.
- Views with Highest Error Rate: Routes/files with ~100% failure.
- Errors by Number of Impacted Sessions: The errors that users actually experience.
- Network Errors by Number of Impacted Sessions: Affected sessions for key docs/website routes.
How to use it
- Triage by Impacted Sessions first, then by Error Rate.
- Click a row to open Error Details and navigate to the exact sessions.
4. Deployments

Panels
- Total User Sessions by Version: Adoption curve for each version.
- Error Rate by Version: Catch regressions immediately after rollout.
- Deployments table: Cach App Version (e.g.,
1.0.0_{build}_website/_docs) with Sessions, Error Rate, and Loading Time.
Release‑readiness checklist
- New version shows traffic? ✔️
- Error rate stable vs prior? ✔️
- Loading Time is not worse? ✔️
If any answer is no, drill into Errors and Performance of Popular Pages for that version.
5. API (Resources)
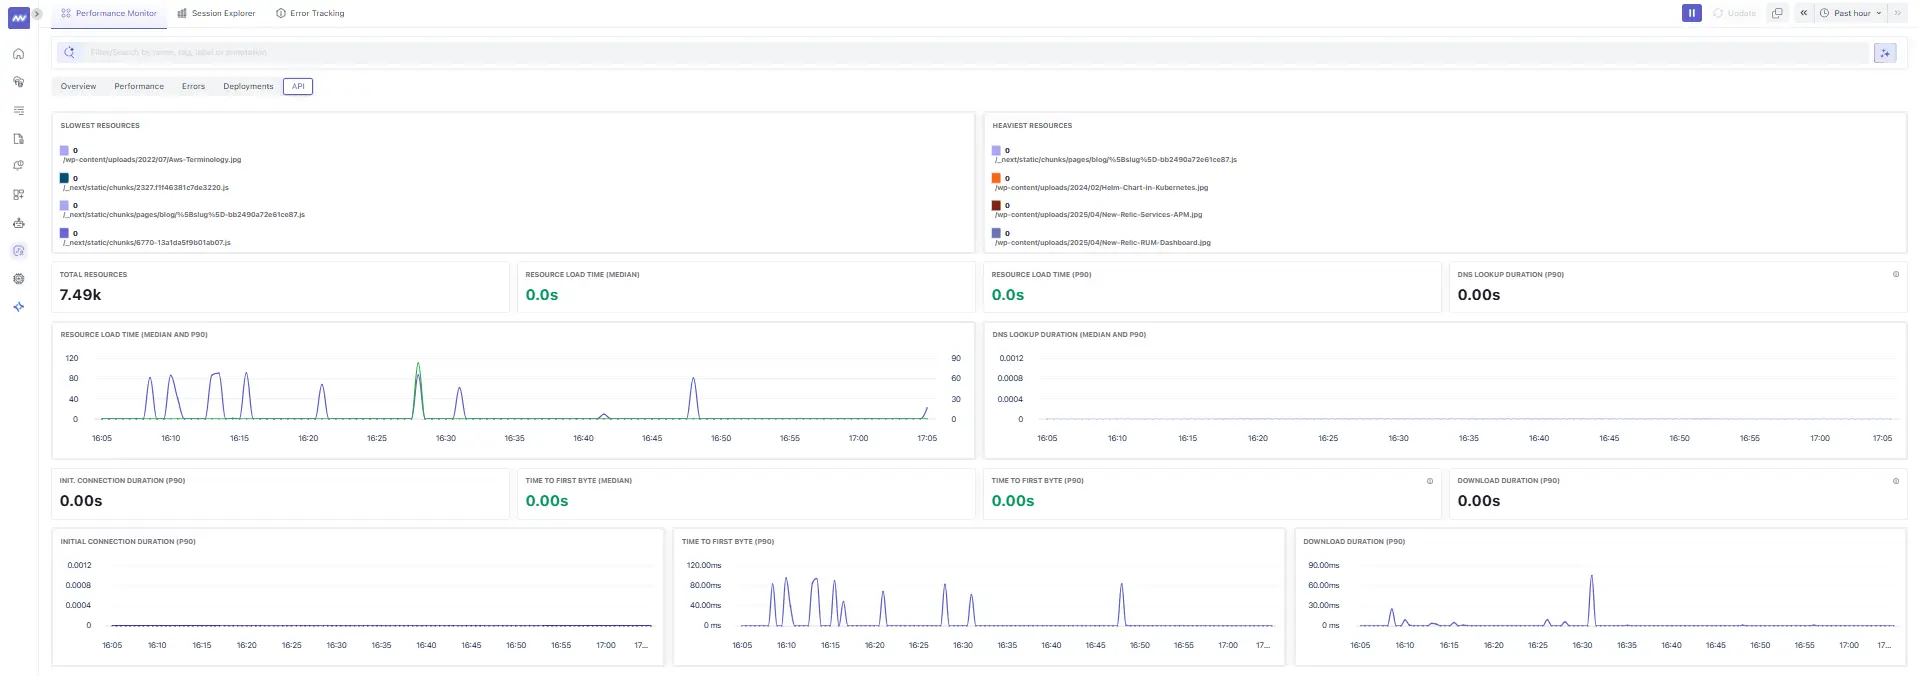
Use this to answer: What assets/API calls are slow or heavy?
- Slowest Resources: Top offenders by latency (e.g., large JS chunks or images).
- Heaviest Resources: Biggest bytes on the wire (optimize or lazy‑load).
- Total Resources: Volume of unique assets requested.
- Resource Load Time (Median & P90) and DNS Lookup Duration (P90): Shows network‑level hotspots.
- Time to First Byte (Median & P90): Detect origin or CDN regressions.
Fix patterns
- Compress and resize heavy images; prefer AVIF/WebP.
- Split JS chunks; avoid unused polyfills.
- Push/Preload critical CSS; ensure CDN caching works.
Session Explorer
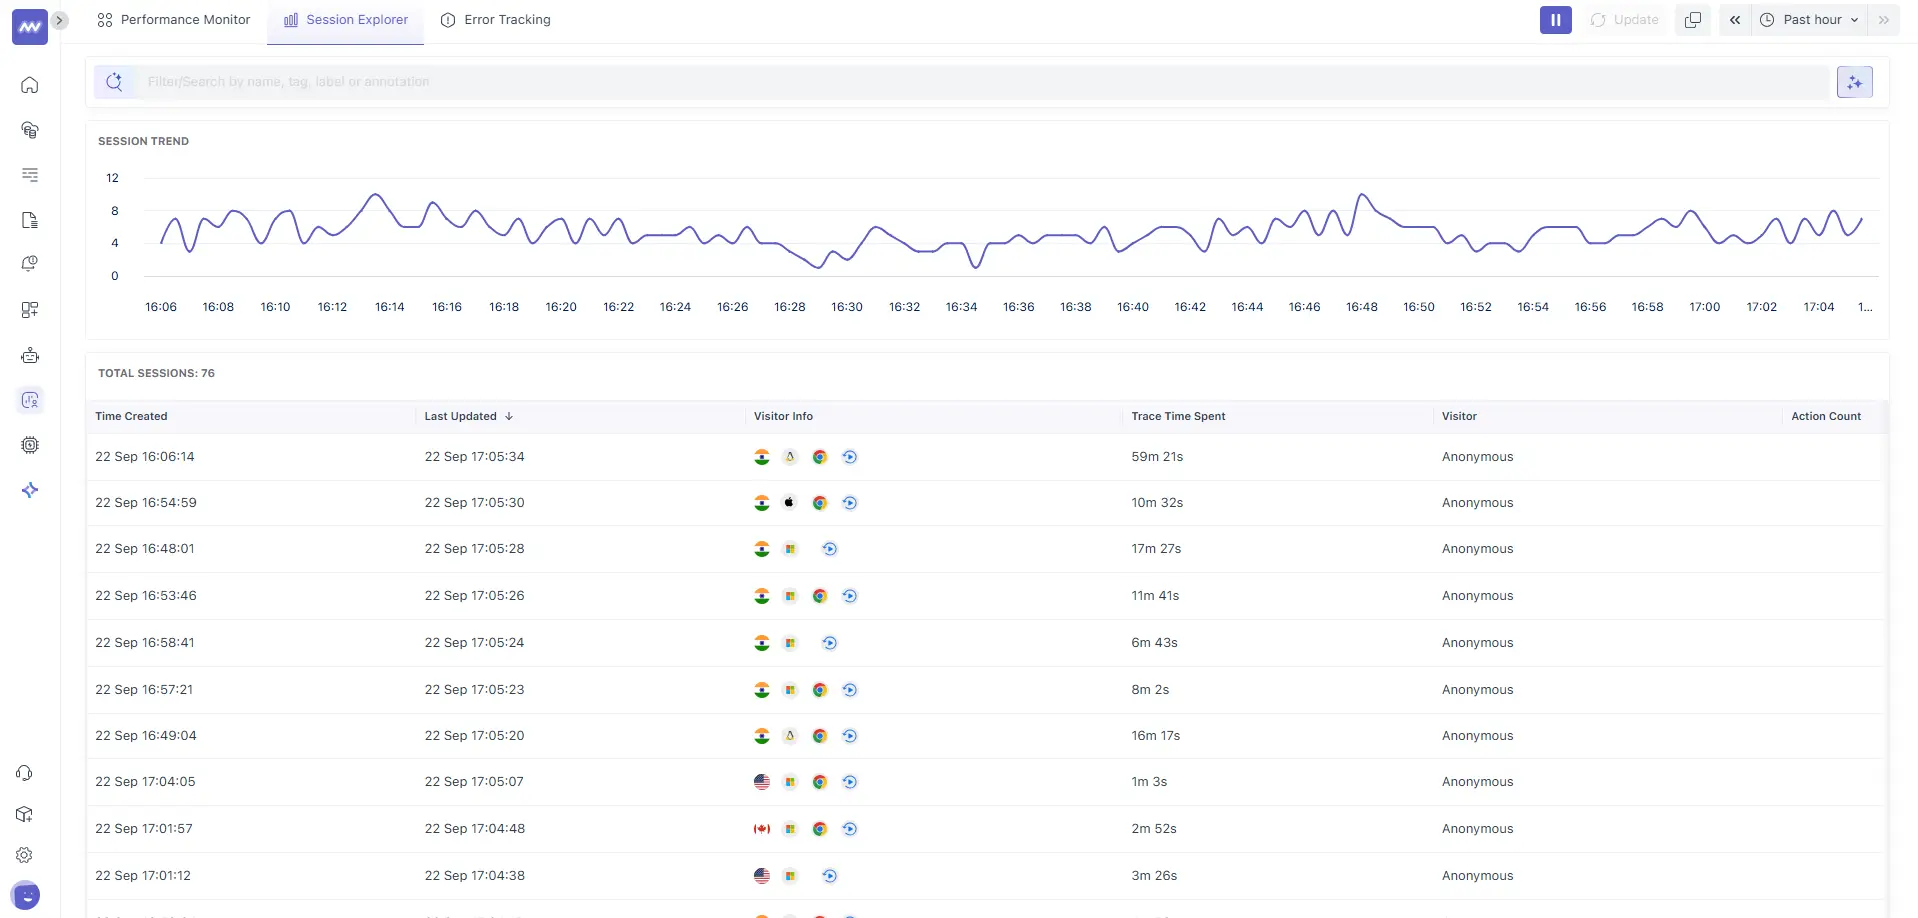
What you’re seeing
- Session Trend: Minute‑by‑minute sessions to understand traffic patterns.
- Session table with columns:
- Time Created / Last Updated: Session lifecycle.
- Visitor Info: Country flag and device/browser/os icons.
- Trace Time Spent: Total time observed in backend traces related to the session (helps correlate front‑end time with backend work).
- Visitor: Anonymized by default.
- Action Count: Number of significant interactions captured.
Open any session to access the player and developer panes:
1. Events Tab
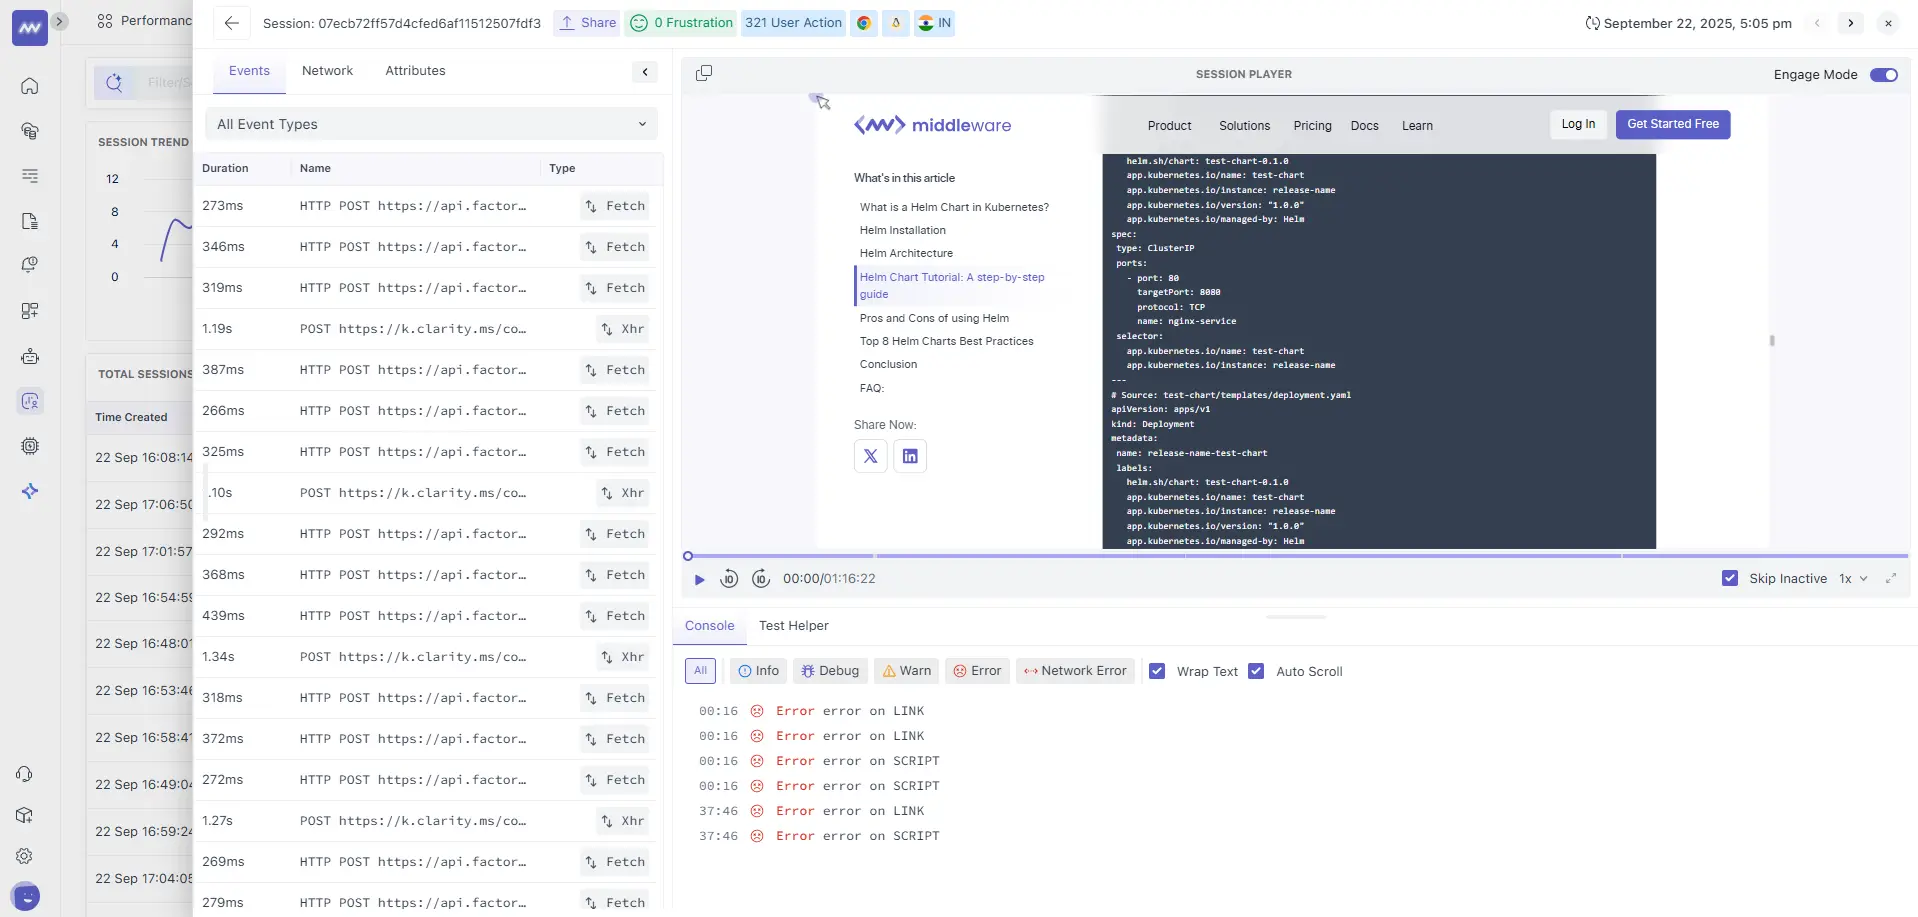
- Event stream with Duration, Name, and Type (e.g., Fetch/XHR). Useful to:
- Align user actions with network calls and UI updates.
- Pinpoint the exact moment a slow API/UI event occurs.
2. Network Tab
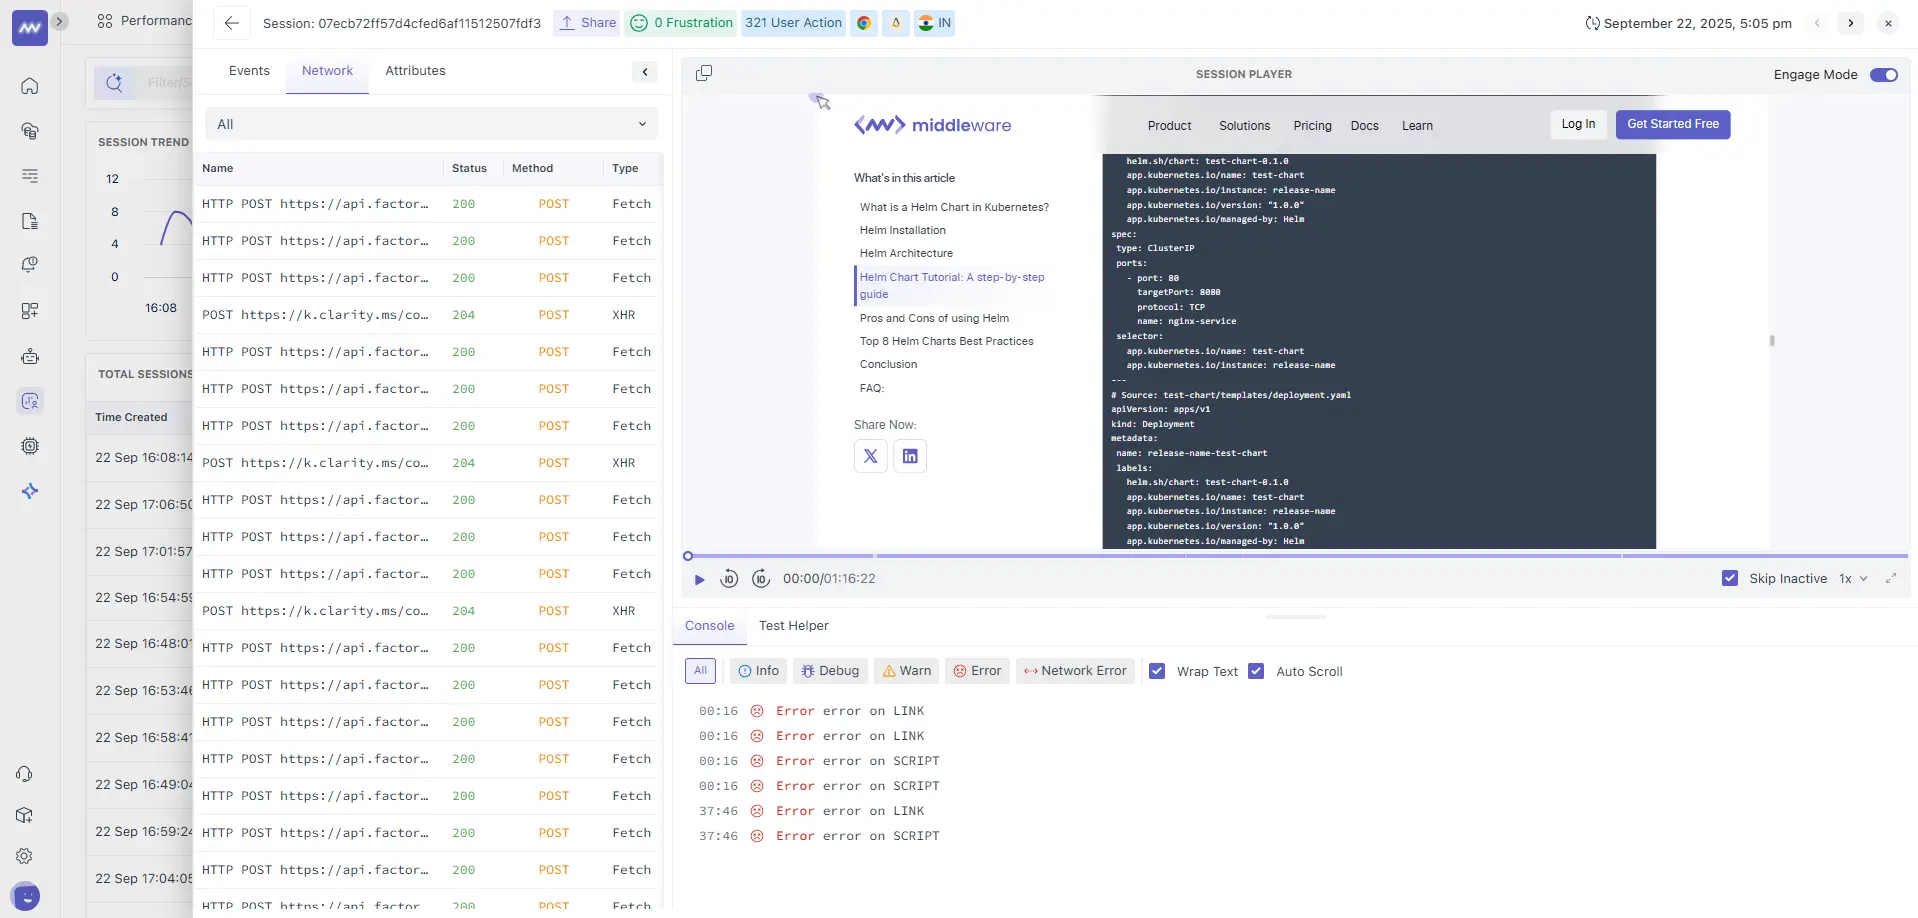
- Per‑request details: Status, Method, and Type (Fetch/XHR). Quickly spot failed calls (non‑2xx) and retries.
- Session Player: Pixel‑accurate replay alongside a timestamped Console.
- Console filters: Info/Debug/Warn/Error (the example shows several
Error on LINK/SCRIPT). Toggle Wrap Text and Auto Scroll when reproducing issues. - Skip Inactive mode: Jump across periods of user activity to speed up triage.
Workflow Tips
- Reproduce: watch the replay at the timeline where the console shows an error.
- Inspect: switch between Events and Network to confirm if the error mapped to an HTTP failure.
- Correlate: open the related trace/log (when linked from the session) to see backend latency and errors.
Note: We have a dedicated Session Explorer page with end‑to‑end workflows (filters, PII controls, replay privacy, exporting). For complete details, refer to that page.
Error Tracking
Panel Anatomy
- Errors Trend — total error count over time; hover to see the timestamp and value.
- Errors table with columns:
- Name — normalized error signature (e.g.,
HTTP GET https://middleware.io/_next/data/{buildId}/index.json). - Error Type —
fetch/xhr/codeetc. - Instances — occurrences.
- Last/First Occurrence — recency windows.
- Affected Users — prioritization by user impact.
- Name — normalized error signature (e.g.,
How to use it
- Sort by Affected Users to prioritize customer‑visible defects.
- Open an error to view Error Details (section 1.6) and jump into impacted sessions.
- Use the global filter/search to narrow by team tags, labels, or annotations.
Error Details (drill‑down)
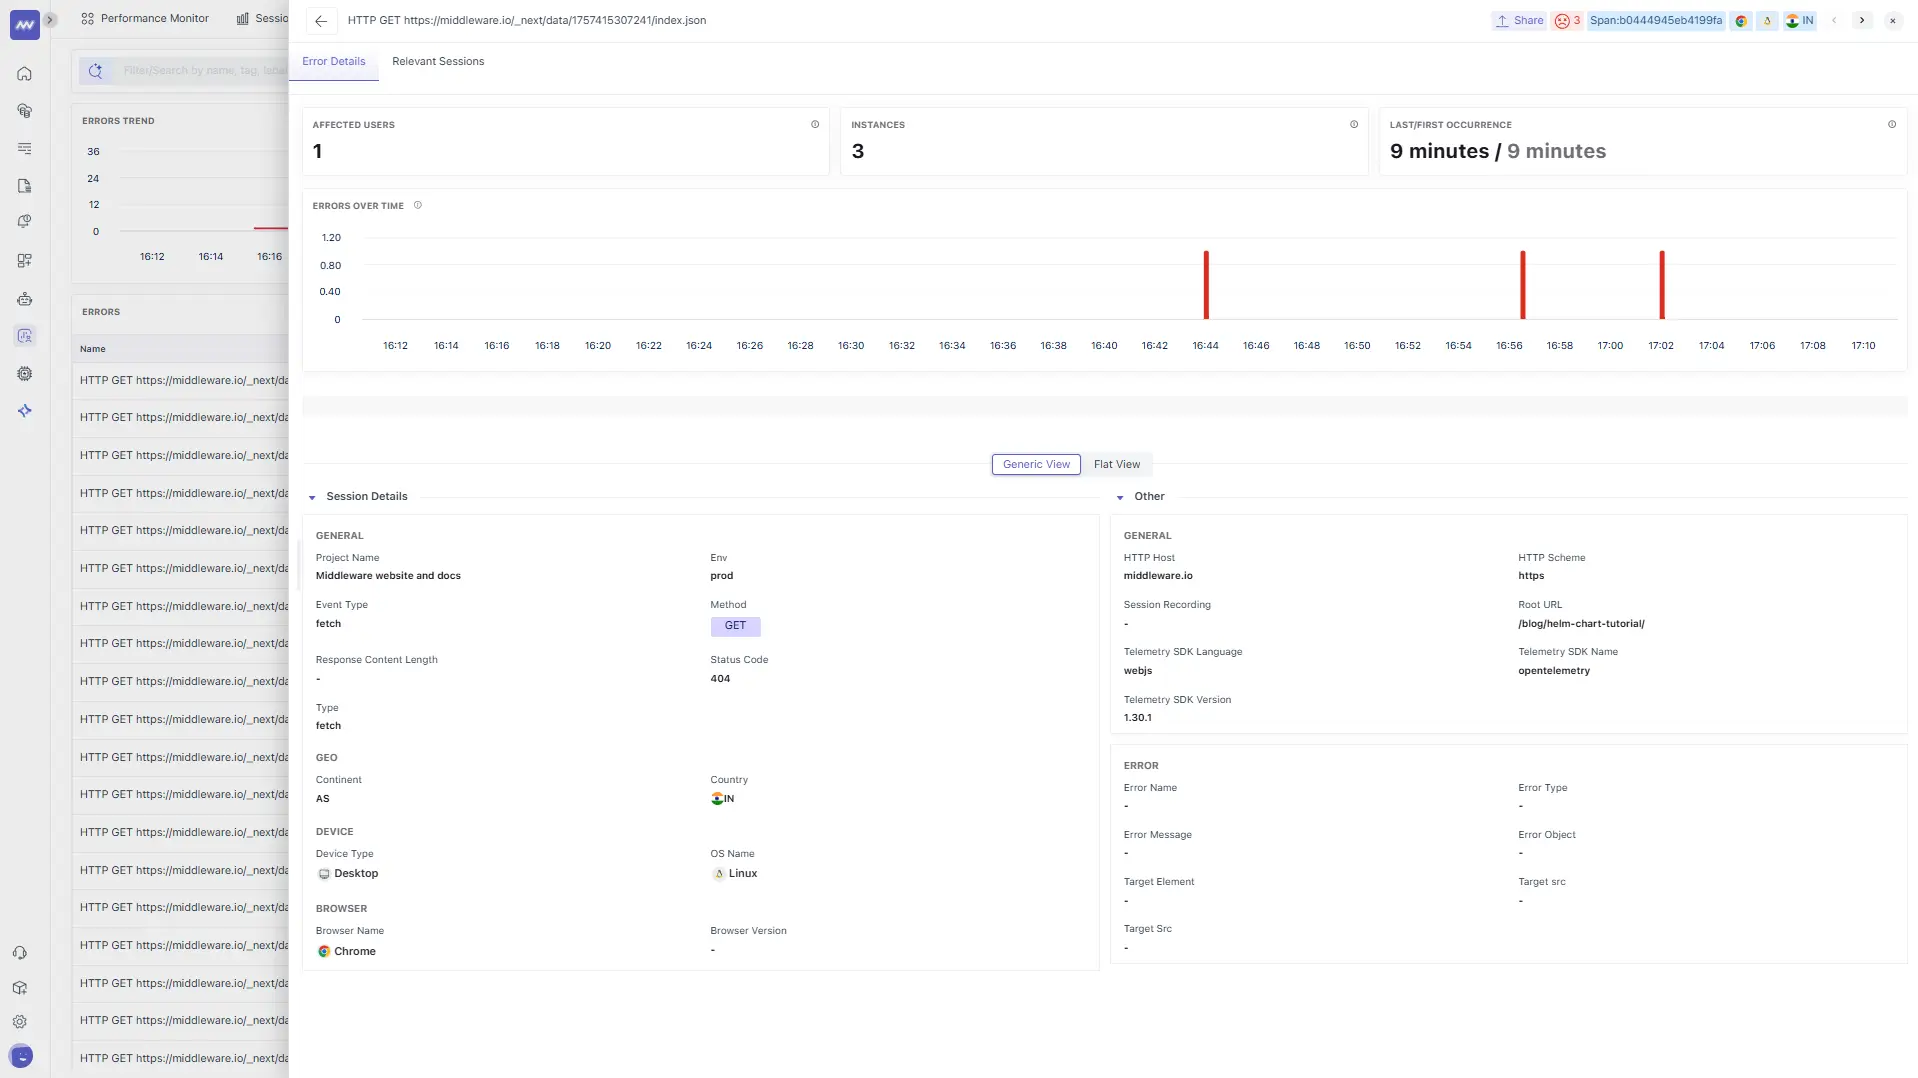
Header KPIs
- Affected Users: Unique users hit.
- Instances: Occurrences across sessions.
- Last/First Occurrence: Time since last/first seen.
- Errors Over Time: Sparkline/timeline to spot bursts.
Session Details
- General: Project Name, Event Type = fetch, Type = fetch.
- Env:
prod(example). - Method/Status: e.g., GET 404 (indicates missing resource).
- Geo & Device: Country/continent, desktop/mobile, OS, browser.
- HTTP: Scheme, host, masked Root URL (e.g.,
/blog/{slug}/). - Telemetry: SDK name/language/version (e.g.,
opentelemetry,webjs), useful for SDK upgrades. - Error block: Normalized error name/type/object when provided.
What to do with a 404 on /_next/data/{buildId}/index.json
- Verify static generation for the route; ensure
{buildId}and page data exist post‑deploy. - Confirm rewrites/redirects for
/and/blog/{slug}are correct. - Check CDN purge strategy so stale
{buildId}links don’t linger.
Note: For further details, we have a separate Error Tracking guide cthat overs every detail and section that you saw in the given screenshot
Putting it together
- Release regression: In Deployments, find the new version with a rising Error Rate → open Errors to locate the failing route → Error Details reveals Status=404 and Root URL /blog/{slug} → jump into a related session to watch the failure and confirm the bad link → fix build routing; purge CDN.
- Slow page interaction: Performance shows a spike in INP and Long Tasks → check 3rd‑party Impact for heavy scripts → in the Session Explorer, the Console shows Error on SCRIPT near the spike → defer that script and re‑measure.
- Heavy asset: API/Resources lists a large image/JS bundle → compress/split and verify P90 Resource Load drops.
Need assistance or want to learn more about Middleware? Contact our support team at [email protected] or join our Slack channel.