Database Monitoring
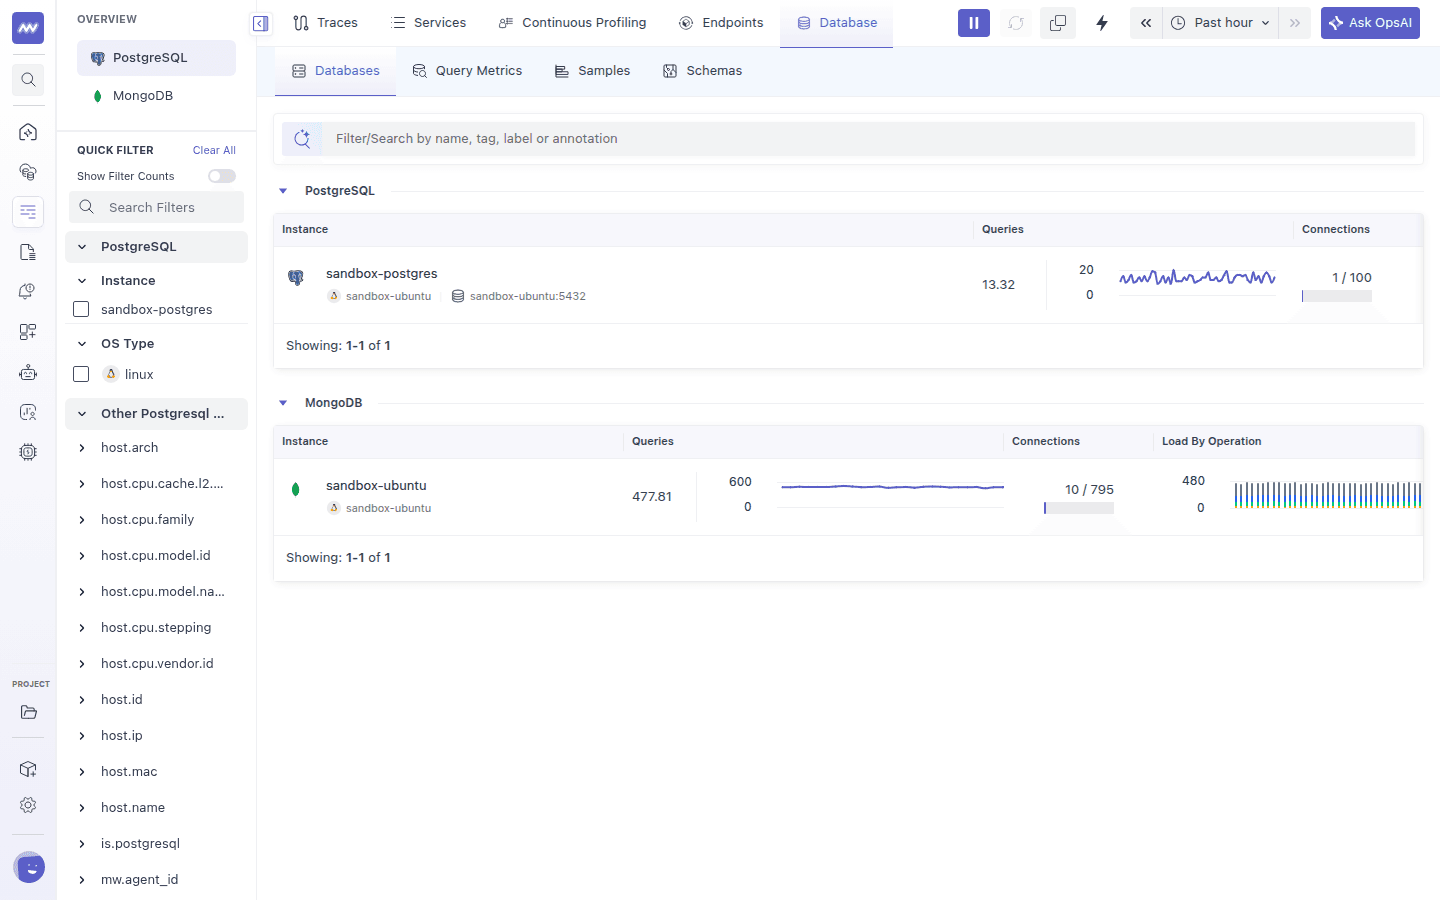
Database Monitoring shows what your databases are doing at the query level: which queries run most often, which are slow, what they wait on, and which application services send them. It combines instance health metrics with query samples collected by the Middleware Agent, so you can move from "the database is slow" to the exact query, plan, and calling service.
Database Monitoring is available under APM → Database in the Middleware app.
Supported Databases#
Database Monitoring supports PostgreSQL and MongoDB. Some features depend on data that only one engine exposes:
| Feature | PostgreSQL | MongoDB |
|---|---|---|
| Instance list and health overview | Yes | Yes |
| Instance metrics (connections, throughput, storage, replication, and more) | Yes | Yes |
| Query Metrics | Yes | Yes |
| Query Samples | Yes | Yes (slow operations) |
| Explain plans | Yes | No |
| Wait events and blocking queries | Yes | No |
| Schemas | Yes | No (a Collections table is shown per instance) |
| Correlation with APM traces | Yes | No |
PostgreSQL can be self-hosted, running in Kubernetes, or a managed service such as AWS RDS, Azure Database for PostgreSQL, or GCP Cloud SQL. MongoDB must be reachable by the Middleware Agent. The MongoDB Atlas integration sends metrics to dashboards but does not appear in Database Monitoring.
How It Works#
The Middleware Agent connects to your database with a monitoring user and collects data on every collection interval.
PostgreSQL
- Metrics: server, database, table, and index statistics (connections, commits, rollbacks, block reads, locks, WAL, vacuum, sizes). These power the instance overview and the Metrics tab.
- Query samples: a snapshot of
pg_stat_activity, recording each session's current query with its state, wait event, user, application, client address, and blocking sessions. These power Query Metrics, Samples, wait events, blocking analysis, and APM correlation. - Top queries: statistics from
pg_stat_statements(rows, shared and temp block I/O, read and write time) plus anEXPLAINplan for each top query. These power the Explain Plans tab and the per-query block metrics. - Schemas: tables, columns, indexes, constraints, and table statistics. These power the Schemas tab.
MongoDB
- Metrics: server status, database and collection statistics, WiredTiger cache, locks, network, and replication metrics.
- Slow operations: entries from the MongoDB database profiler (
system.profile). Depending on your profiling level, these are operations slower thanslow_ms, or every operation. These power Query Metrics and Samples.
PostgreSQL query counts in Database Monitoring come from query samples, so they count sampled executions, not every execution. Very short queries that start and finish between two samples may not be counted. For MongoDB, counts include only the operations the profiler records.
Prerequisites#
- Middleware Agent installed on a host or Kubernetes cluster that can reach your database. Use the latest agent version. See Installing the Agent.
- Database integration configured for monitoring. Follow Set Up PostgreSQL or Set Up MongoDB.
- Database Monitoring permission on your Middleware role. Without it, the page shows "You don't have permission. Please contact administrator."
If no database is configured yet, the Database page shows Ready to Launch? with a link to the database integrations.
Navigating Database Monitoring#
Choose a Database Engine#
The Overview list at the top of the left panel shows each database engine you have configured (for example, PostgreSQL and MongoDB). Select an engine to switch the Query Metrics, Samples, and Schemas tabs and the quick filters to that engine. Middleware remembers your last selection.
Tabs#
| Tab | What it shows |
|---|---|
| Databases | Every monitored instance, grouped by engine, with drill-down into instance health, metrics, queries, and logs |
| Query Metrics | Queries grouped by normalized text (PostgreSQL) or query signature (MongoDB), with count and duration trends |
| Samples | Individual query samples or slow operations, newest first |
| Schemas | Tables, columns, indexes, and constraints (PostgreSQL only) |
Search and Quick Filters#
- The search bar filters the current tab. It matches the instance name on Databases, the query text on Query Metrics and Samples, and the table name on Schemas.
- Quick Filter in the left panel narrows every tab by attribute:
- PostgreSQL: Instance and OS Type
- MongoDB: Host, Database, Namespace, and OS Type
- Additional resource attributes are listed below these filters.
Time Range#
Use the time picker in the top bar to choose the time range, or turn on live mode to keep the data updating. The Schemas tab always shows the past day, and the time picker is disabled while it is open.
Key Terms#
| Term | Meaning |
|---|---|
| Normalized query | PostgreSQL query text with literal values replaced by ?, so executions of the same statement are grouped together. |
| Query signature | A MongoDB hash that identifies the shape of an operation. Operations with the same shape are grouped under one signature. |
| Query sample | A snapshot of one PostgreSQL session's query at the moment the agent sampled pg_stat_activity, including its state and wait event. |
| Slow operation | A MongoDB operation recorded by the database profiler, either because it took longer than slow_ms or because profiling level 2 records every operation. |
| Average load | The number of query samples (PostgreSQL) or slow operations (MongoDB) in each time bucket, stacked by wait event, operation, or another dimension. Taller bars mean more sessions were busy. |
| Wait event group | The PostgreSQL wait event type a query was waiting on when sampled, such as Lock, IO, LWLock, or Client. A sample with no wait event was running when sampled. |
| Blocking query | A PostgreSQL query holding a lock that other sessions are waiting for. The waiting sessions list the blocking process IDs. |
Guides#


Need assistance or want to learn more about Middleware? Get in touch with us via our Contact Us or join our Slack channel.