Trace Explorer
The Trace Explorer shows a single distributed trace in detail. It presents the same set of spans through four visualizations, along with the attributes, events, logs, infrastructure, and metrics recorded for whichever span is selected.
Selection is shared across the panel. A span selected in one view remains selected when you switch to another, so context is preserved while moving between visualizations.
Guided Tour#
The following walkthrough covers the four views, highlight filters, span attributes, and the events timeline.

What You Can Do with the Trace Explorer#
With the Trace Explorer, you can:
- Follow a request across services and identify where time was spent
- Locate the slowest span, the deepest call chain, and the span that raised an error
- Reduce a large trace to only the spans that carry errors, logs, or events
- Review every attribute recorded on a span and apply any value as a filter
- Trace an exception to the point it was thrown, including its stack
Accessing the Trace Explorer#
Navigate to:
APM → Traces
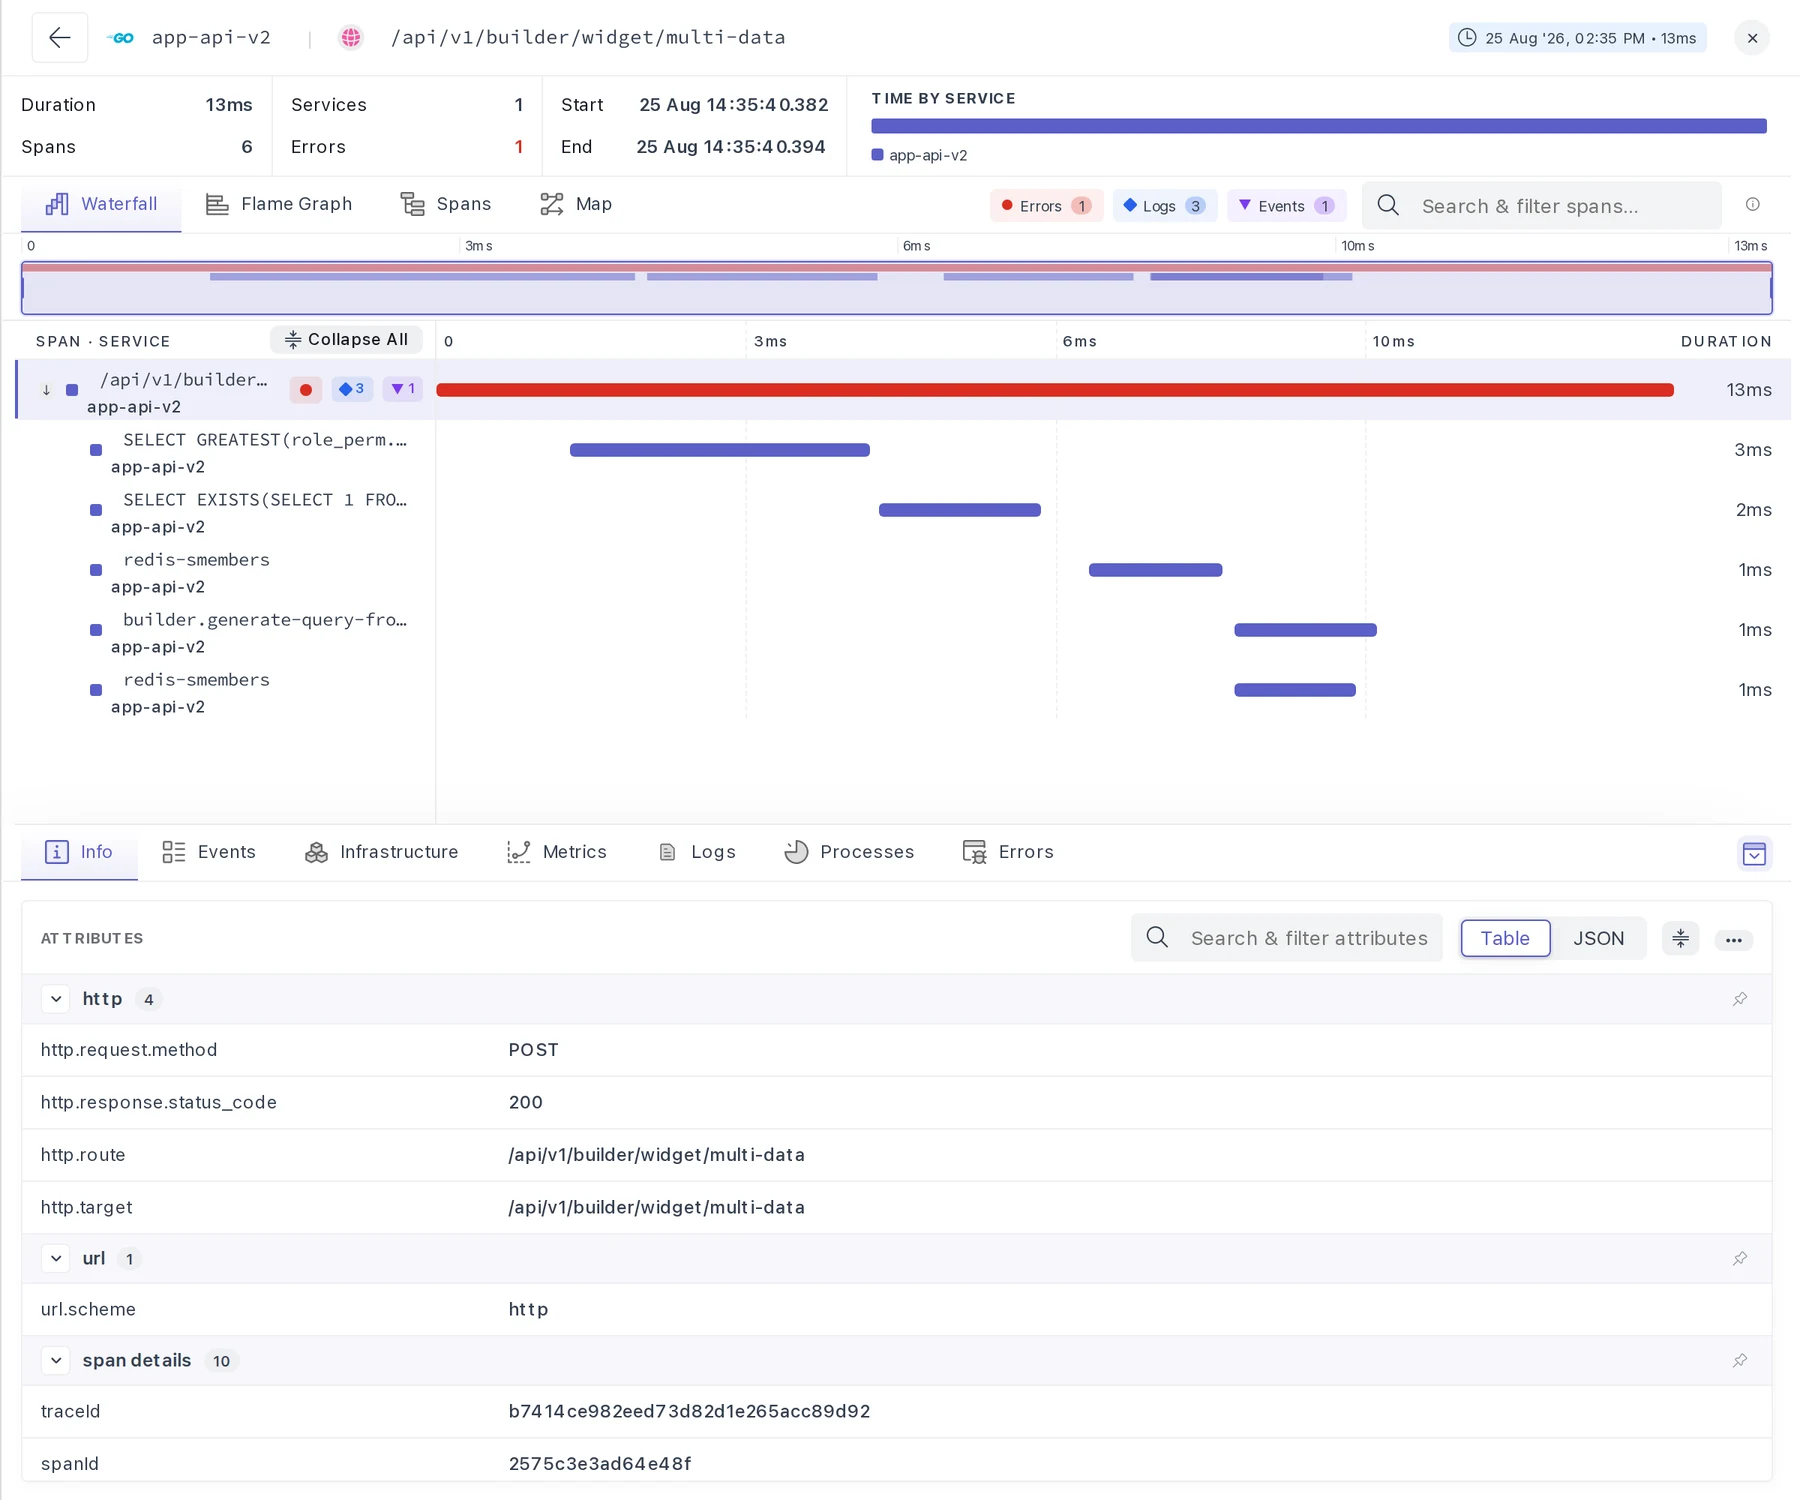
Select any row in the trace list. The Trace Explorer opens as a side panel above the list, so the filtered list is preserved when the panel is closed.
Panel Layout#
The panel is organized into five sections, from top to bottom:
| Section | Contents |
|---|---|
| Header | Service, span name, and the time the span ran |
| Trace summary | Duration, span and service counts, errors, and time by service |
| View switcher | Waterfall, Flame Graph, Spans, and Map, with highlight filters and search |
| Active view | The selected visualization |
| Span details | Tabs describing the currently selected span |
Trace Summary#

The summary strip reports trace-level values:
| Field | Description |
|---|---|
| Duration | Wall-clock time from the first span's start to the last span's end |
| Spans | Total number of spans in the trace |
| Services | Number of distinct services that participated |
| Errors | Number of spans with an error status. Non-zero counts appear in red |
| Start / End | Absolute timestamps, to the millisecond |
| Time by Service | Proportion of trace time owned by each service, with a color key matching the span colors used in every view |
Time by Service identifies the service responsible for most of the trace duration and is a useful starting point for an investigation.
Trace Views#

The four views are listed on the left of the navigation strip. Tabs can be dragged to reorder them, and the order is retained. The first tab in the order becomes the default view when the panel is opened.
Waterfall View#
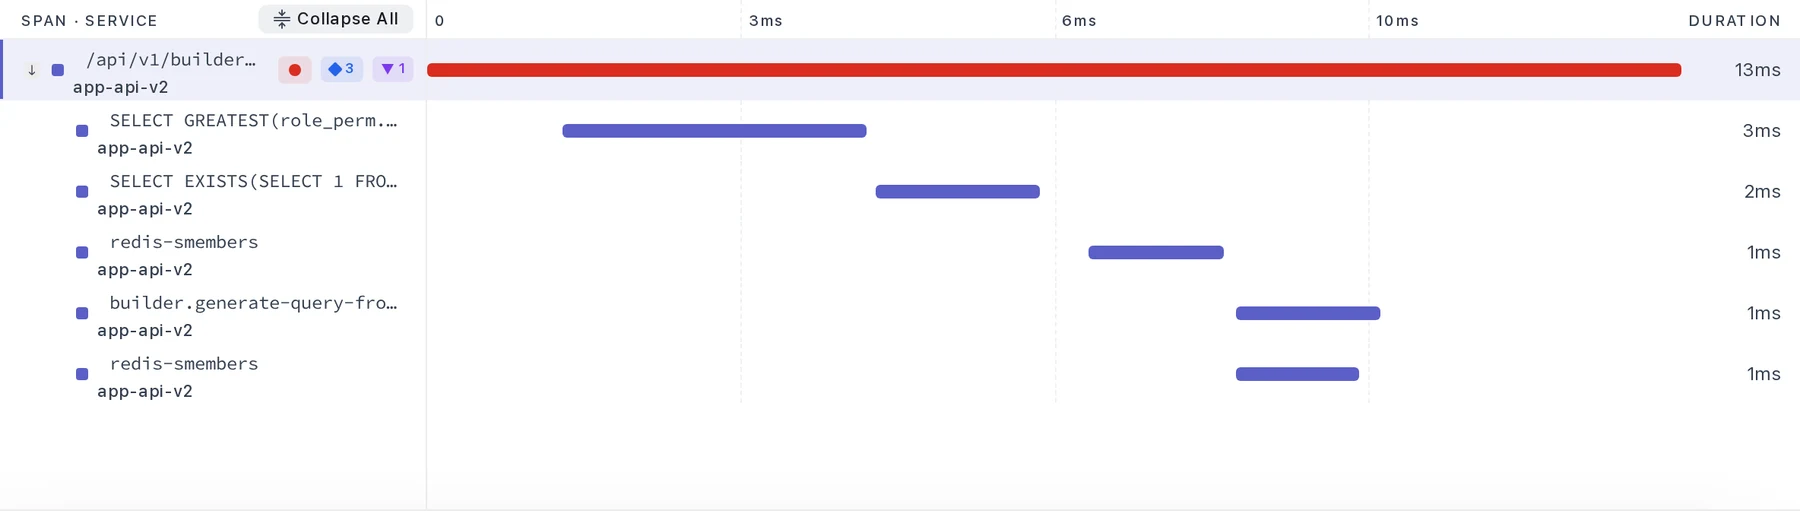
The Waterfall view presents spans as a hierarchy, with each span indented under its parent and drawn against a shared timeline. Use it to review call order, parent and child relationships, and the duration of each step.
Reading a row
- The left column contains the span name and the service that emitted it
- The colored square corresponds to the service color used in Time by Service
- Bars are colored by service. Spans with an error status are drawn in red
- Badges indicate what the span carries: a red dot for an error, a diamond with a count for logs, a triangle with a count for events, and a pill for the HTTP status code
- The Duration column reports the exact span duration
Interactions
- Select the caret beside a parent span to collapse or expand its children
- Use Collapse All or Expand All in the column header to fold or unfold the entire tree
- Drag the divider between Span · Service and the timeline to change the width of the name column. The width is retained
- Hover over the timeline to display a crosshair with the elapsed time and the absolute clock time at that position
- Press the up and down arrow keys to move the selection between spans
Flame Graph View#
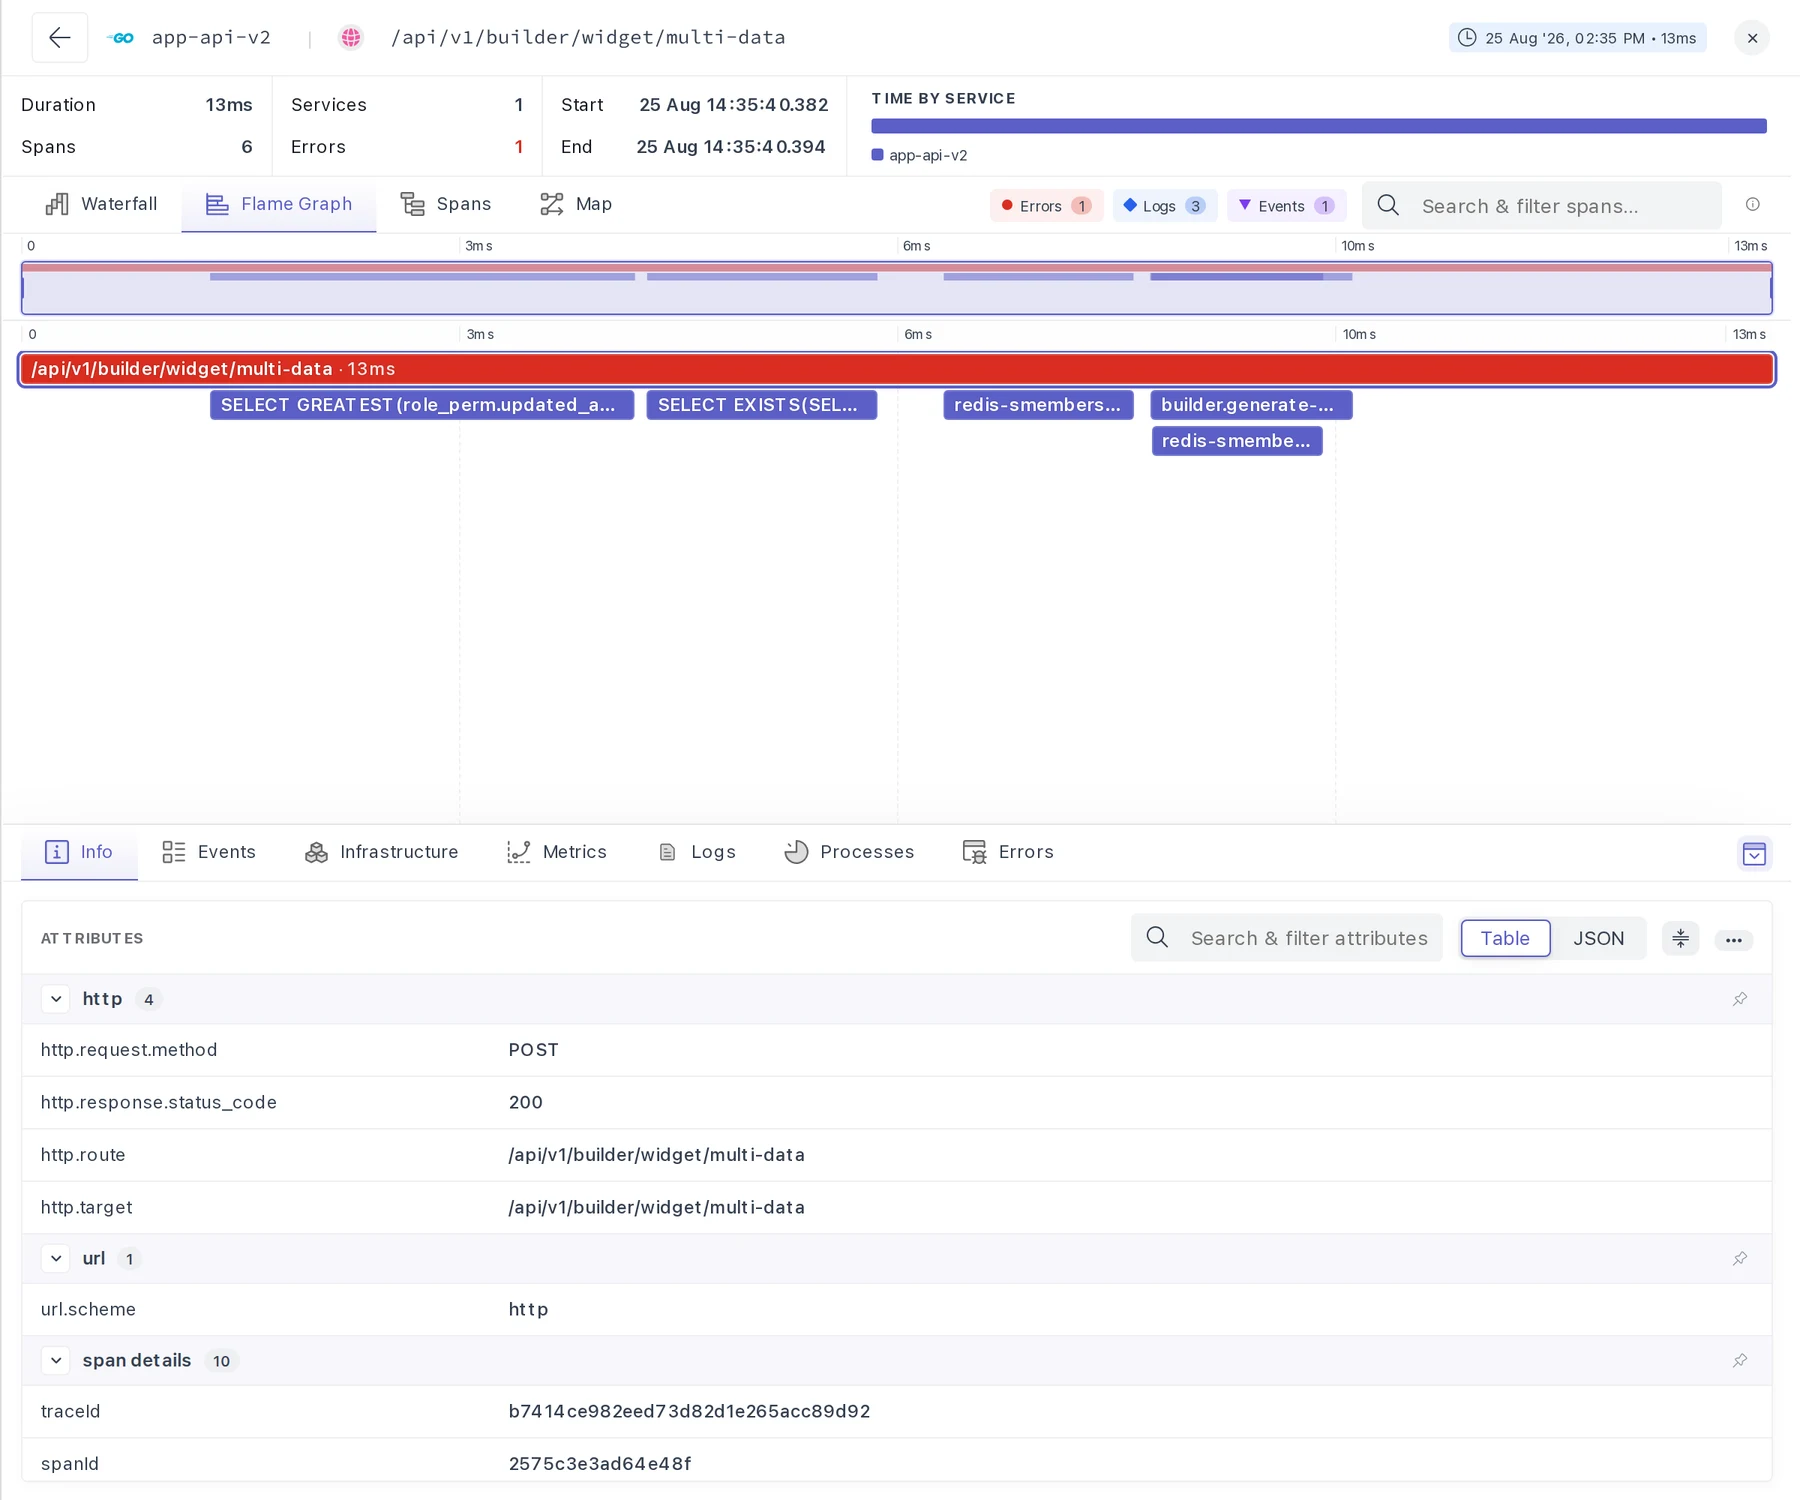
The Flame Graph view arranges the same spans as an icicle chart, with time along the horizontal axis and call depth along the vertical axis. Bar width corresponds to duration, and stack height corresponds to call depth. Concurrent spans are placed on separate rows so that overlapping work remains visible.
Hover a bar to display the span name, service, duration, and counts. Select a bar to load that span into the span detail tabs.
Spans View#
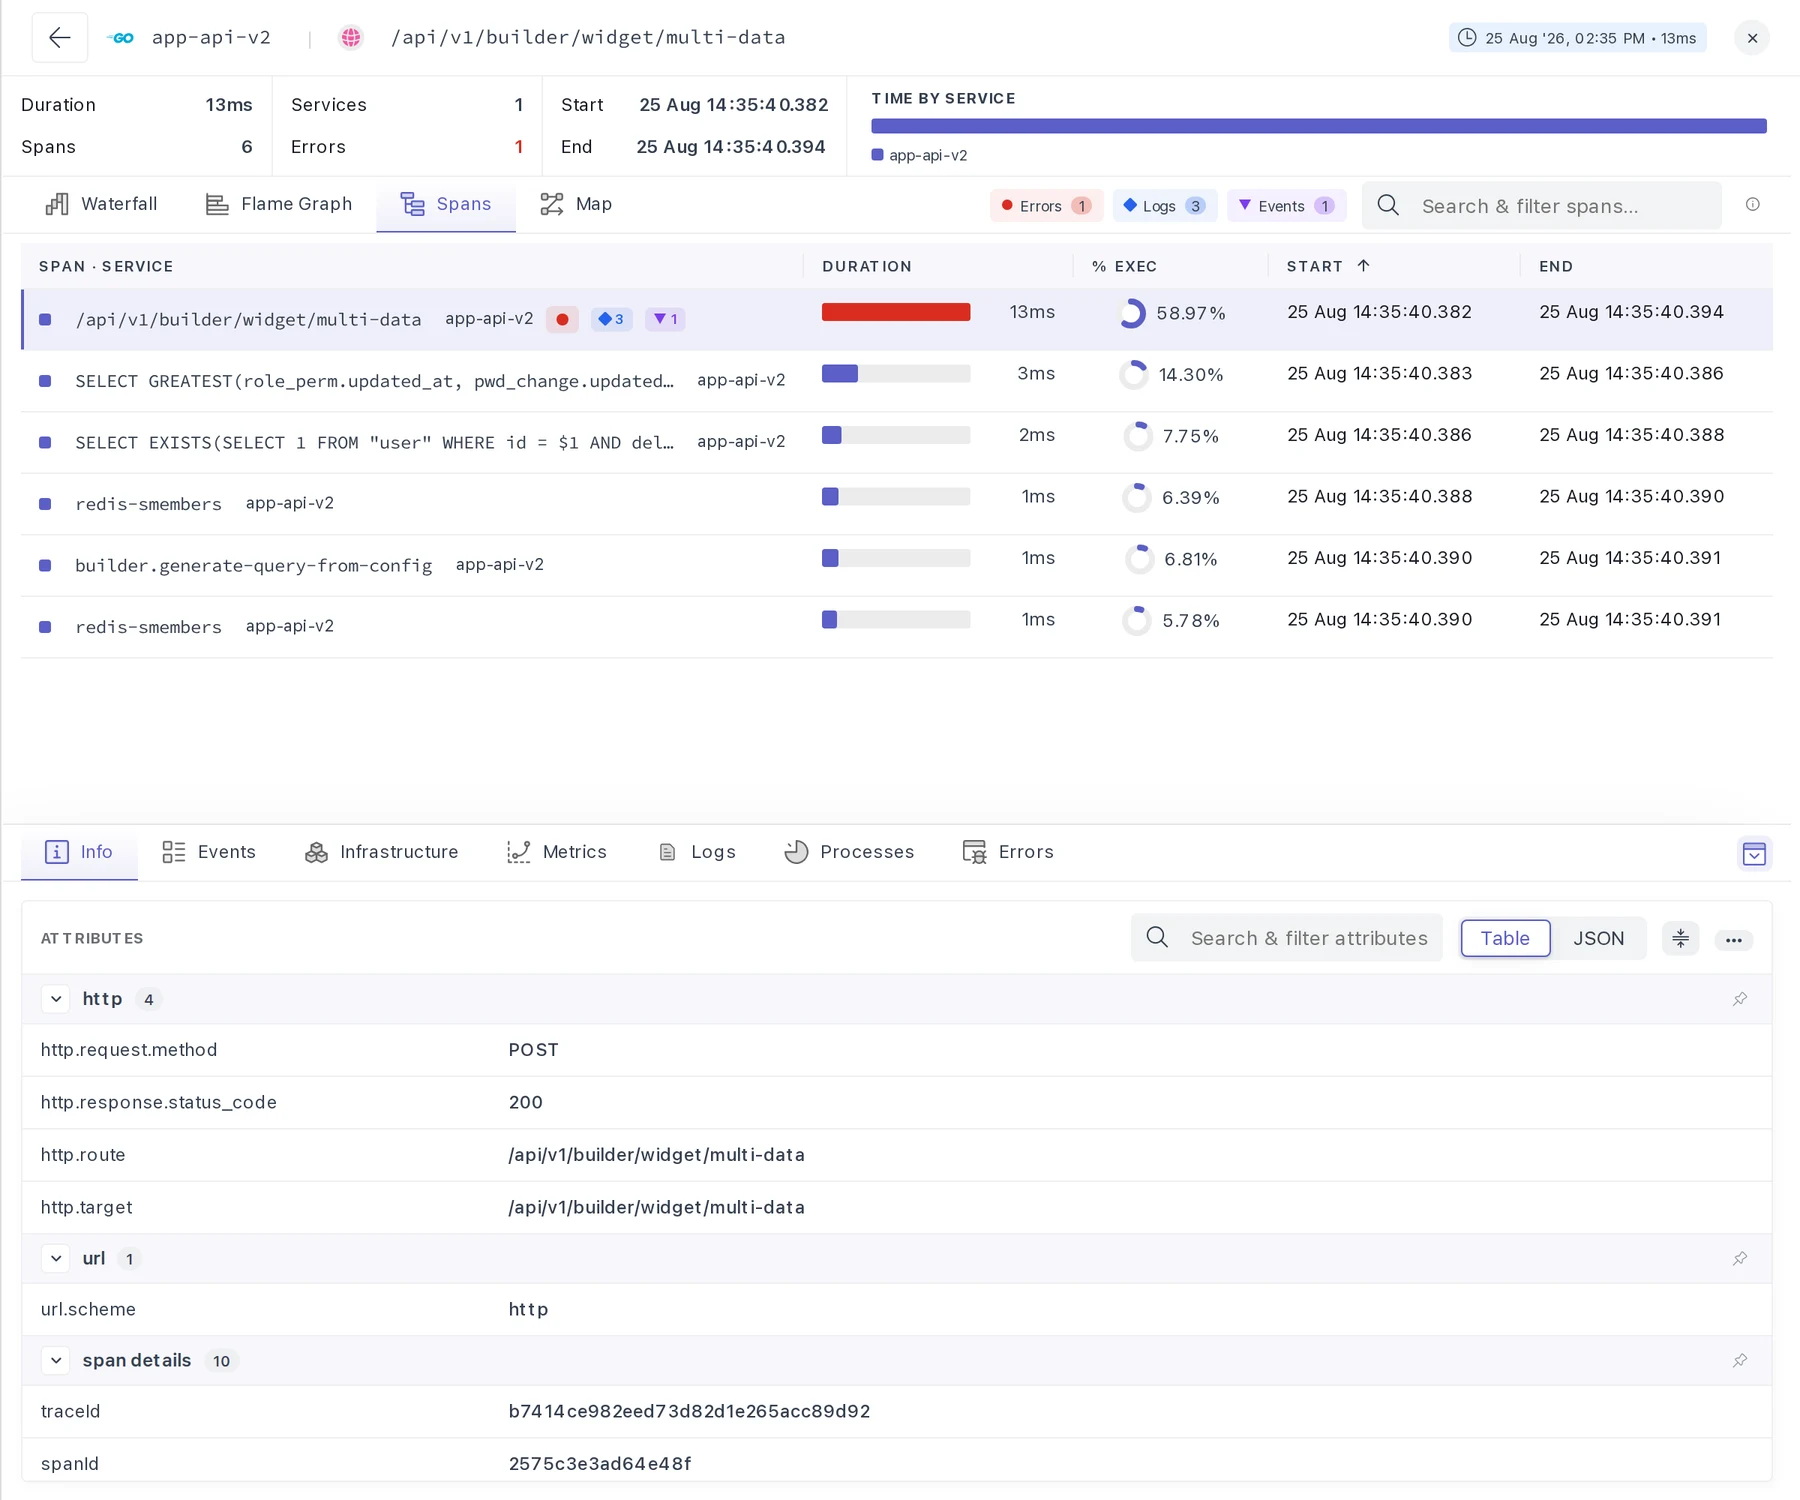
The Spans view lists every span in the trace as a flat table, independent of hierarchy. Use it to compare spans directly across the whole trace.
| Column | Description |
|---|---|
| Span · Service | Span name, service, and the error, log, and event badges used in the Waterfall view |
| Duration | A bar showing the span duration relative to the trace, with the exact value |
| % Exec | The span's share of the combined execution time of all spans |
| Start / End | Absolute start and end timestamps |
Select a column header to sort. Sorting by Duration or % Exec brings the most expensive spans to the top. Columns can be resized by dragging their edges and reordered by dragging their headers. Press the up and down arrow keys to move through the list; the table scrolls to keep the selected row in view.
Map View#
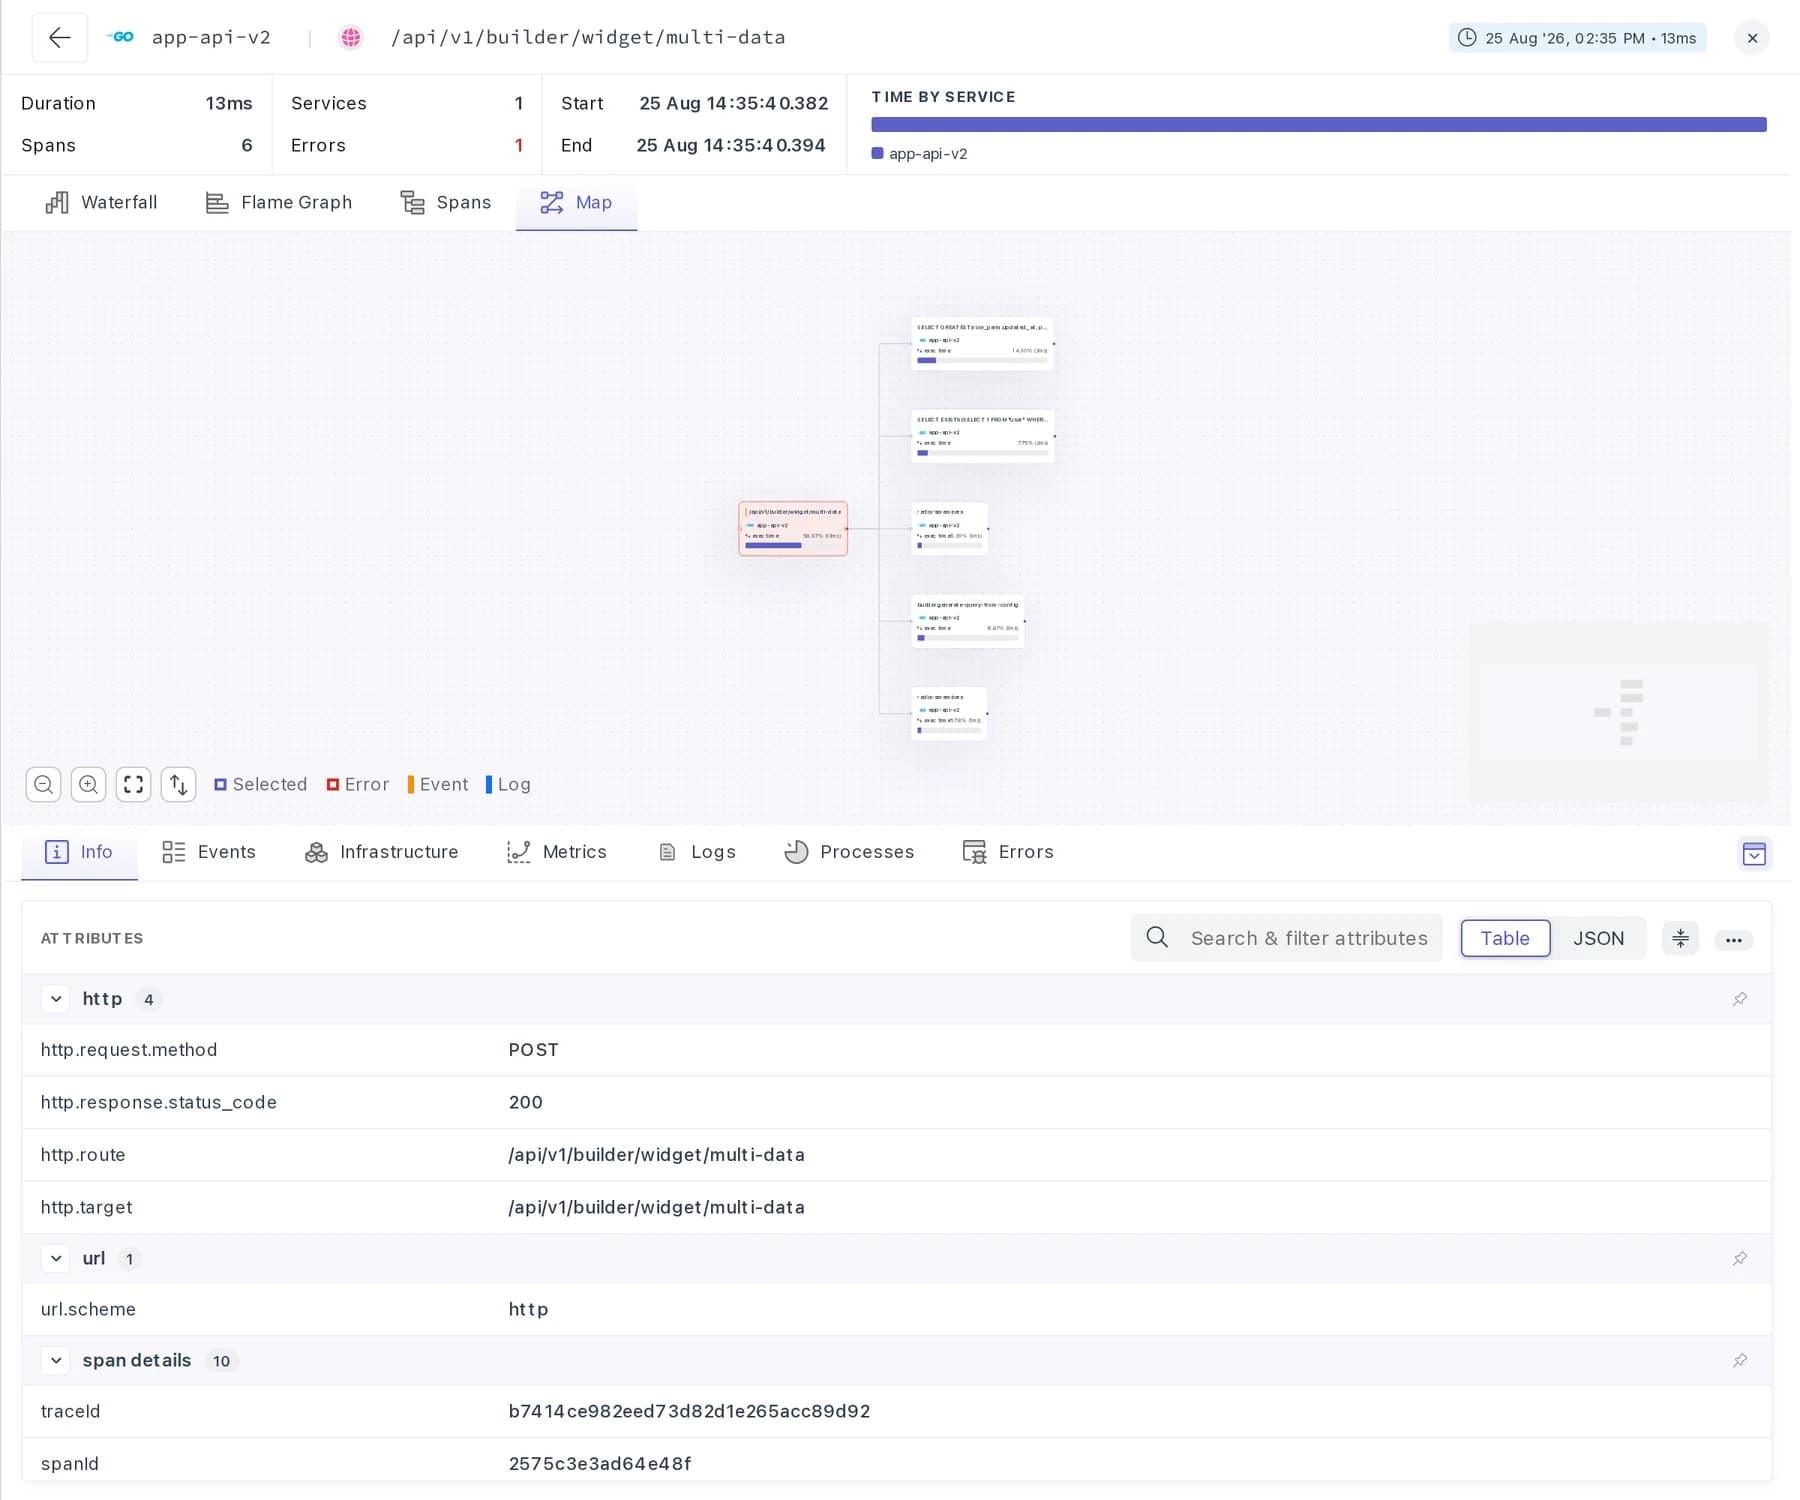
The Map view renders the trace as a graph, where each node is a span and each edge represents a call. Use it when a trace fans out across many dependencies and the structure is not evident from a list.
Each node reports its span name, service, and share of execution time. The legend identifies Selected, Error, Event, and Log nodes. The controls in the lower left zoom the graph, fit it to the view, and change the layout direction.
Filtering a Large Trace#
Traces containing thousands of spans can be reduced using the minimap, search, and highlight filters. These controls can be combined.
Minimap#

The minimap below the view switcher represents the entire trace, with each span drawn in its service color. Dense regions and error-heavy sections are visible before zooming.
- Drag the window to move across the trace
- Drag the window edges to zoom into a time range
- Scroll over the minimap to zoom around the pointer
- Double-click to reset to the full trace
The Waterfall and Flame Graph views follow the minimap window. The Waterfall view lists only the spans that fall within it.
Search#
Enter a term in Search & filter spans to match spans by name or service. Matching spans remain highlighted while the remaining spans are dimmed, so matches are shown in the context of the surrounding trace.
Highlight Filters#

The Errors, Logs, and Events chips report how many spans carry each signal. Select a chip to restrict the view to those spans, and select it again to clear the filter. Chips combine, so enabling Errors and Logs together shows spans carrying either signal.
For a failing request, applying the Errors filter reduces the trace to the spans that reported a failure.
Span Details#
Selecting a span in any view loads it into the tabs below the trace. These tabs can be dragged to reorder, and the control on the right collapses the section to give the full panel height to the trace.
Attributes#
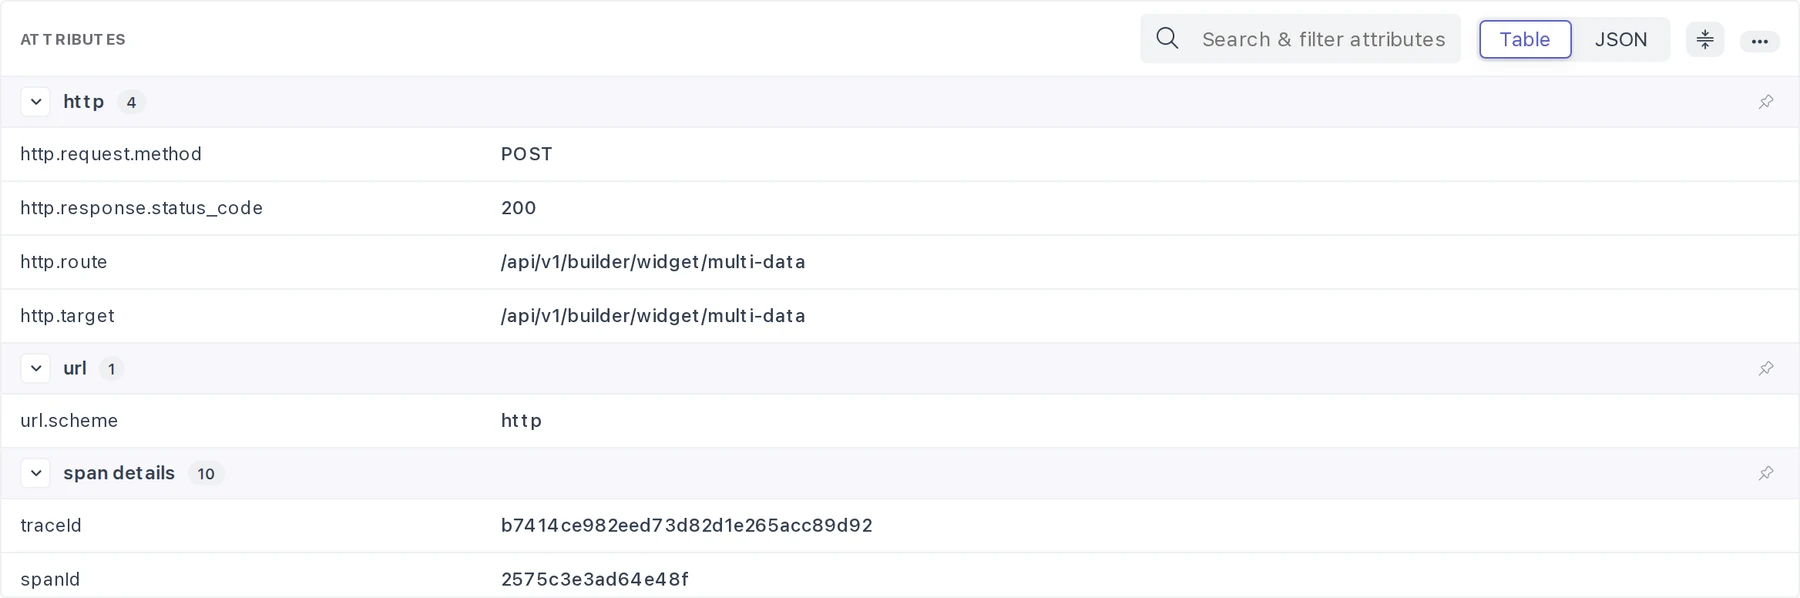
The Info tab lists all attributes recorded on the span, grouped by key prefix such as http, url, db, and messaging, with a count beside each group name. Groups can be collapsed individually, and the pin control on a group header keeps that group at the top of the list for subsequent spans.
A span details group is always present and contains identity and timing fields: traceId, spanId, parentSpanId, spanName, service.name, kind, statusCode, statusMessage, durationNano, and timestampNs. Status codes include their meaning, for example 2 (ERROR).
Use Search & filter attributes to filter by key or value. Groups containing a match are expanded automatically.
Attribute Actions#
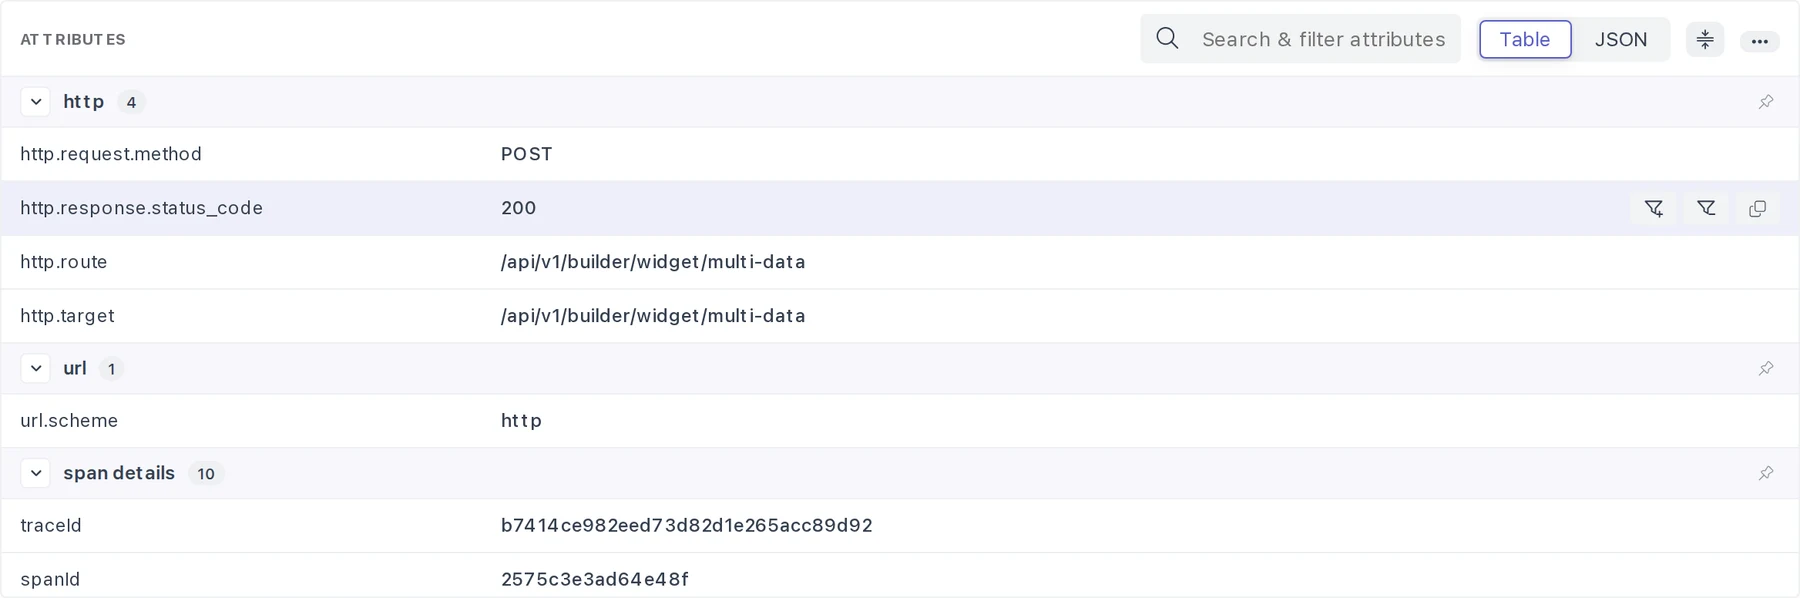
Hovering an attribute row reveals the available actions:
| Action | Result |
|---|---|
| Filter by value | Applies the key and value as a filter and returns to the trace list |
| Filter out value | Applies the same filter, negated |
| Copy value | Copies the raw value to the clipboard |
Values that do not fit on a single row, such as SQL statements, JSON payloads, and stack traces, are displayed in a dedicated block:
- SQL is formatted and syntax highlighted
- JSON is displayed with indentation
- Show more and Show less expand and collapse blocks longer than a few lines
- A format control switches between the formatted output and the original raw text
- A wrap control, available in raw view, switches between wrapped lines and horizontal scrolling
JSON View#
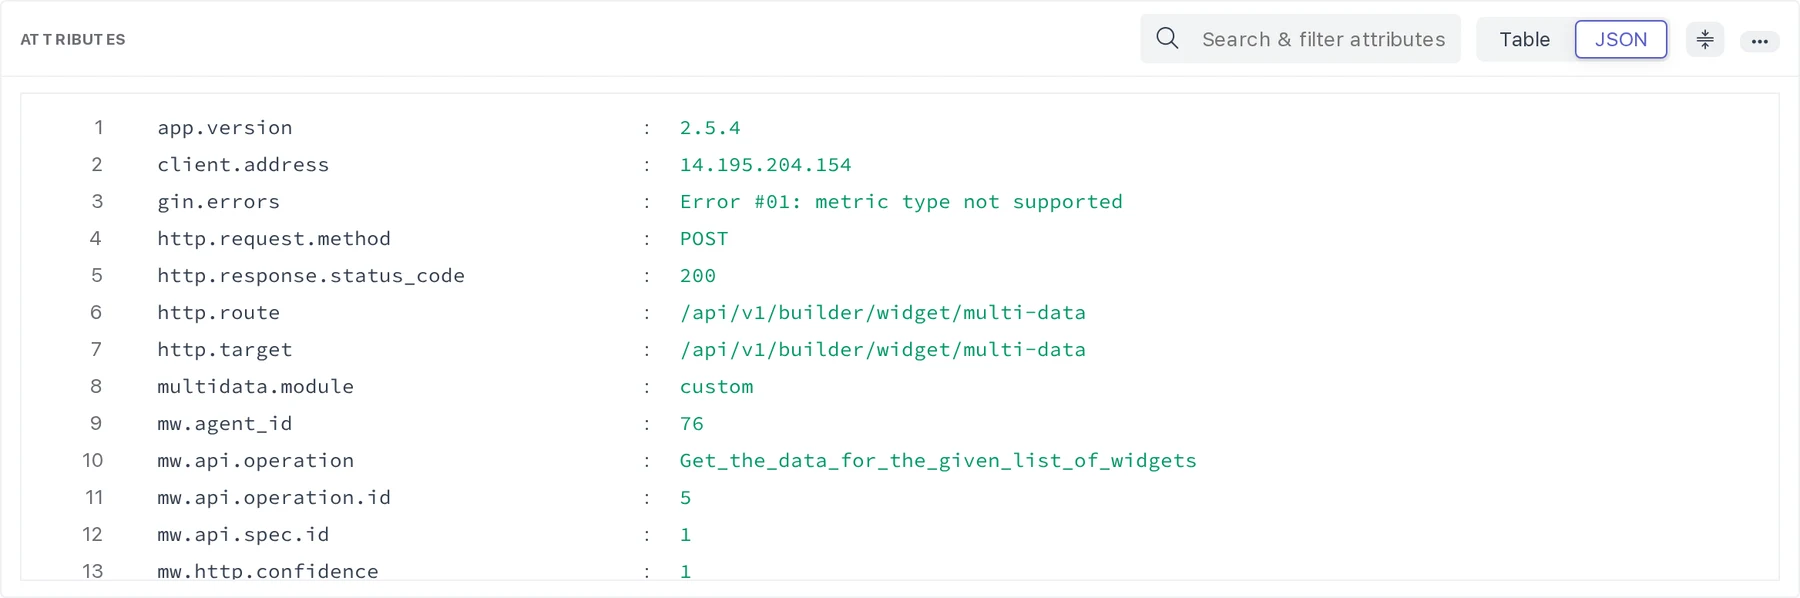
The Table and JSON control switches the attribute list to a line-numbered JSON document. Search terms and view settings continue to apply, so the JSON output reflects the current filters.
View Settings#
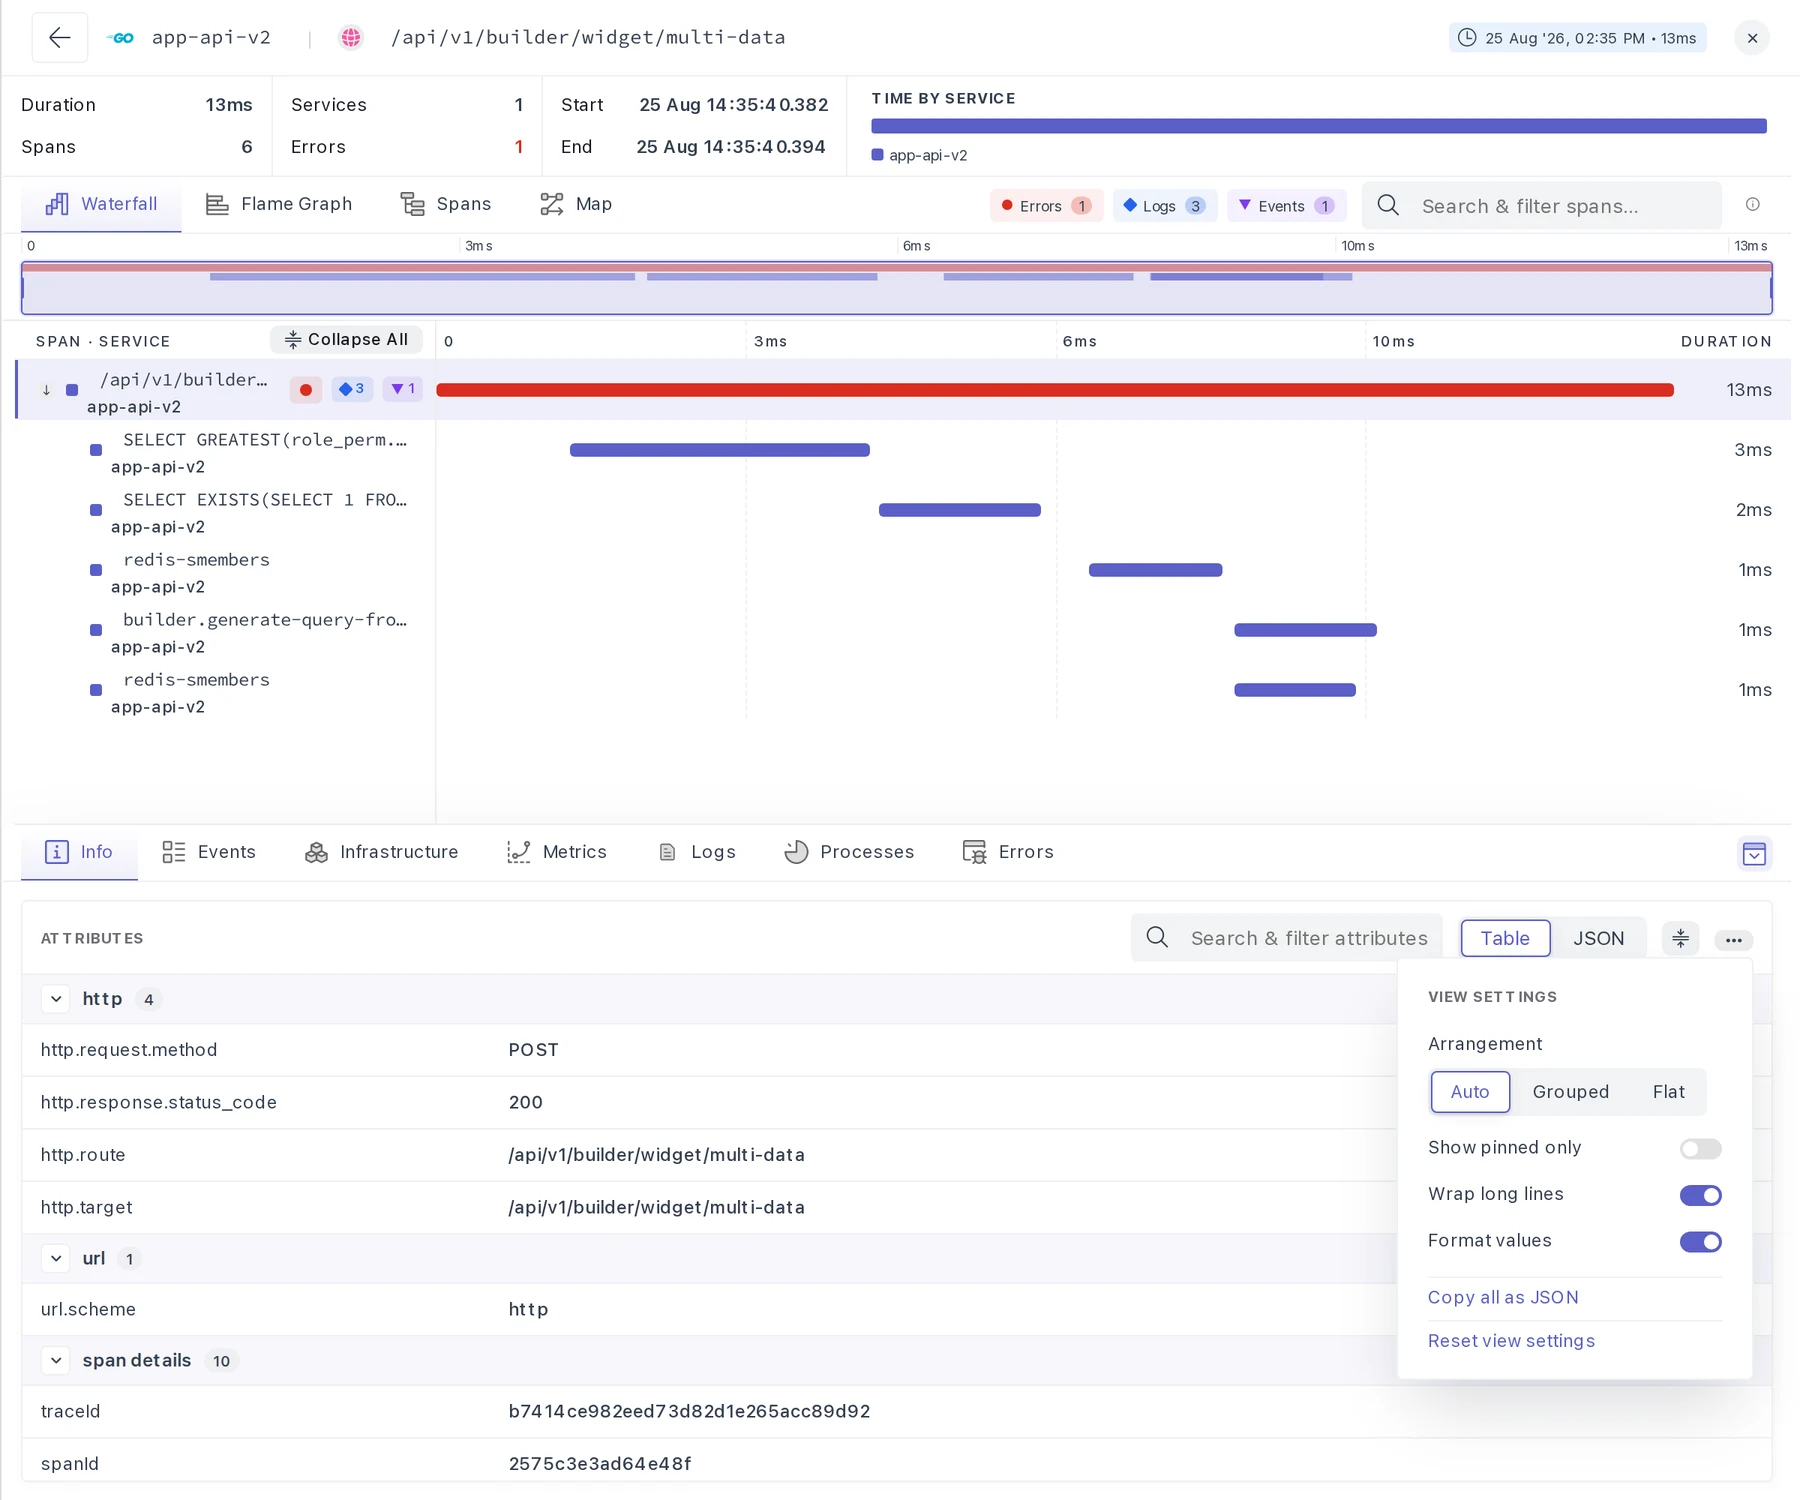
Additional preferences are available from the options menu. These settings are retained between sessions.
| Setting | Description |
|---|---|
| Arrangement: Auto | Orders groups according to the span type. A database span lists db first, an HTTP span lists http first |
| Arrangement: Grouped | Orders groups alphabetically |
| Arrangement: Flat | Lists attributes alphabetically without group headers. Individual attributes can be pinned |
| Show pinned only | Restricts the list to pinned groups or attributes |
| Wrap long lines | Sets the default wrapping behavior for long values. Individual rows can override it |
| Format values | Sets the default formatting for SQL and JSON values. Individual rows can override it |
| Copy all as JSON | Copies the attributes currently displayed |
| Reset view settings | Restores defaults and clears pinned items |
Events#
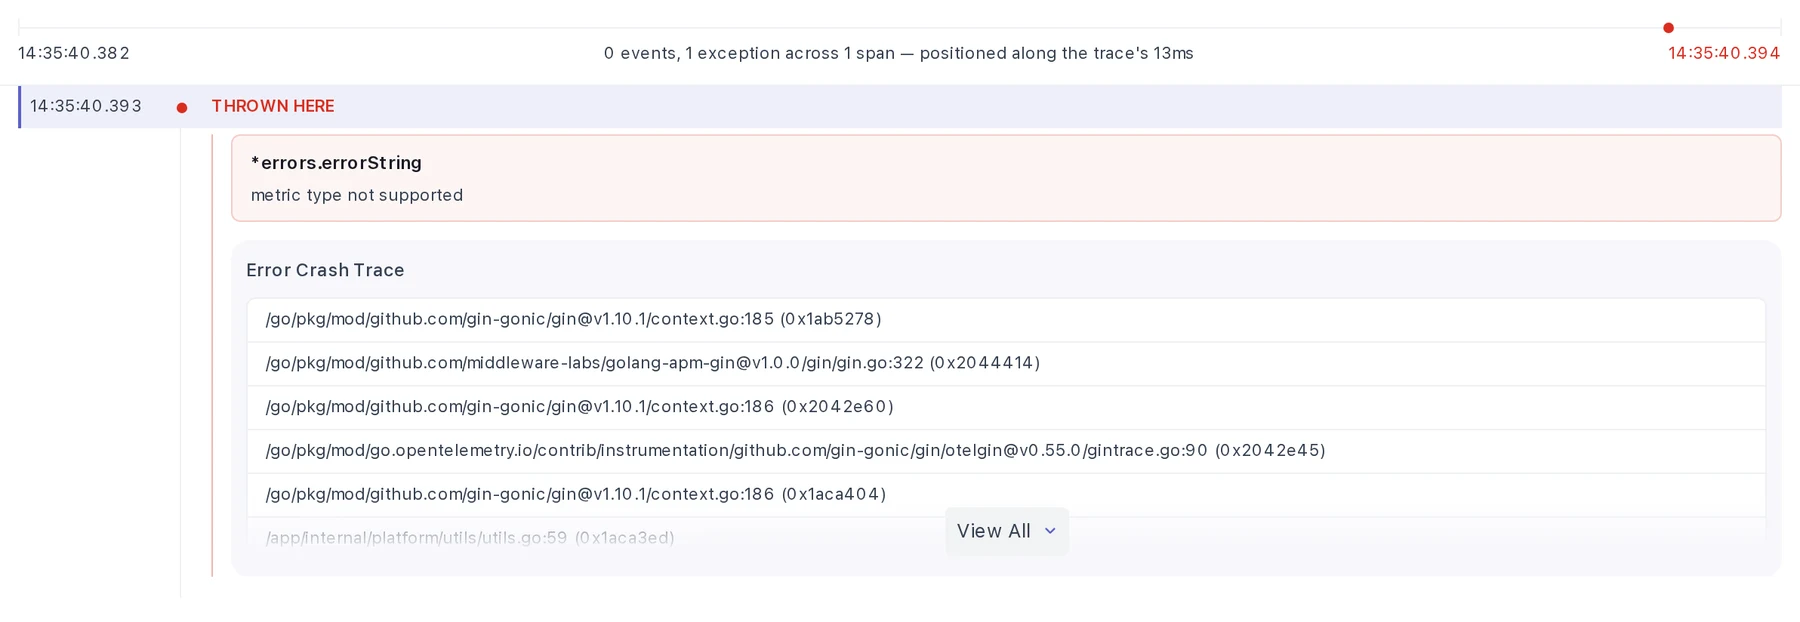
The Events tab lists span events and exceptions recorded across the trace, in chronological order.
A timeline at the top of the tab positions each event along the trace duration, making clusters of activity visible. Selecting a marker scrolls to the corresponding entry in the list.
Events belonging to the selected span are highlighted. Events from other spans remain in the list, dimmed and labeled with their originating span, to preserve the surrounding sequence. Selecting an event row expands its full attribute set.
When a span raises an exception, the timeline marks the point as Thrown here, followed by:
- An exception card containing the exception type and message
- The Error Crash Trace, showing the stack with View All to expand the remaining frames
Additional Tabs#
The remaining tabs describe the selected span from other telemetry sources:
| Tab | Contents |
|---|---|
| Infrastructure | The host, container, or pod on which the span ran |
| Metrics | Resource metrics for that infrastructure around the time of the span |
| Logs | Logs correlated with the span |
| Processes | Process-level detail for the span's runtime |
| Errors | Errors recorded against the span |
Keyboard and Pointer Shortcuts#
The information icon at the end of the navigation strip lists the shortcuts available in the current view.
| Action | Waterfall | Flame Graph | Spans |
|---|---|---|---|
| Zoom the timeline | Cmd / Ctrl + Scroll | Cmd / Ctrl + Scroll | n/a |
| Pan | Drag | Drag | n/a |
| Move selection | Up / Down arrow | n/a | Up / Down arrow |
| Select a span | Click | Click | Click |
| Resize a column | Drag the divider | n/a | Drag the column edge |
| Reorder columns | n/a | n/a | Drag the column header |
| Pan or zoom using the minimap | Drag | Drag | n/a |
Recommended Investigation Workflow#
- Review Time by Service to identify the service responsible for most of the trace duration
- If the Errors count is non-zero, apply the Errors highlight filter to isolate failing spans
- Open the Waterfall view to establish where the failure occurred in the request
- Switch to the Spans view and sort by % Exec to confirm the most expensive spans
- Select the span in question and review its Attributes, including the query, route, and status
- Open the Events tab to locate the exception and its stack
- Apply a relevant attribute as a filter to determine whether other traces share the same characteristic
When to Use the Trace Explorer#
The Trace Explorer is most useful when:
- Investigating a slow or failing request reported by a user or an alert
- Determining which service or dependency contributed the most latency
- Reviewing the exception and stack recorded for a specific span
- Confirming the attributes an instrumented service is emitting
- Establishing whether an issue is isolated to one trace or shared across many
Need assistance or want to learn more about Middleware? Get in touch with us via our Contact Us or join our Slack channel.