MySQL Integration
Prerequisites#
- The Middleware Host Agent is installed on the machine that will collect metrics. See the Installation Guide.
File-Based Authentication#
1 Create Database Credentials#
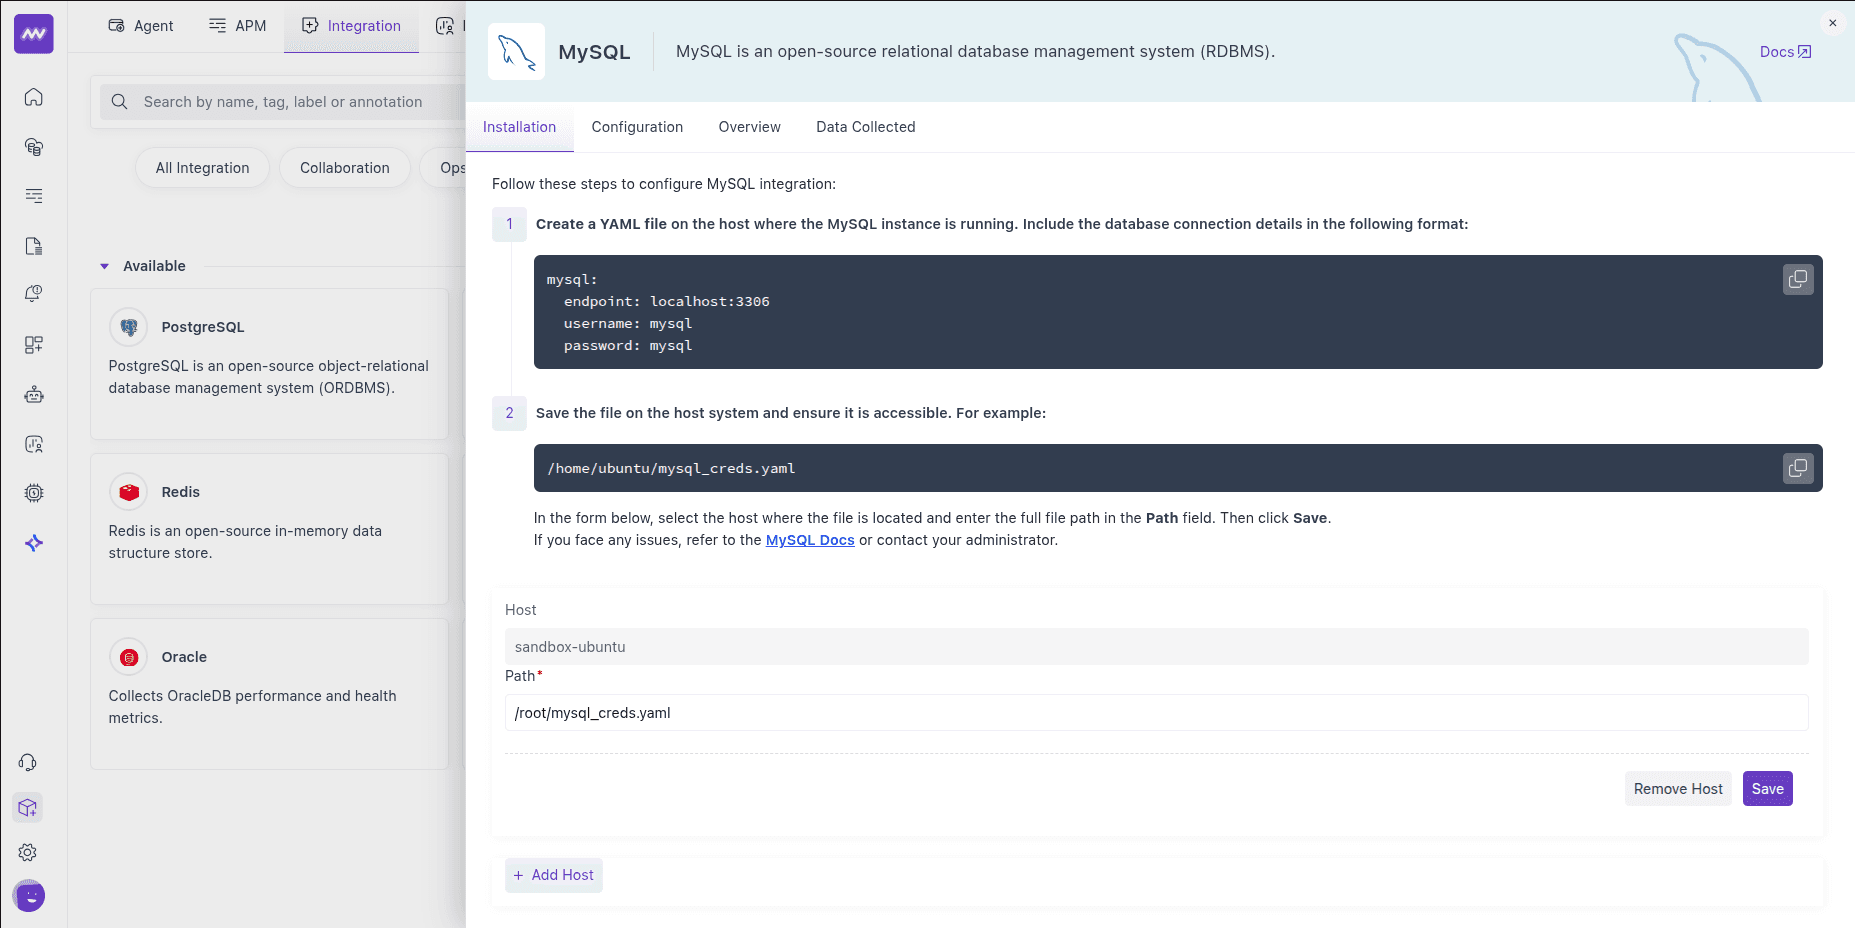
Create a .yaml file with your database credentials. If the DB isn’t password-protected, omit username/password.
Docker users: place the credentials file inside /var/log on the Agent host.
Example: /home/ubuntu/mysql-creds.yaml
1mysql:
2  endpoint: localhost:3306
3  username: <YOUR_USERNAME_FOR_MYSQL>
4  password: <YOUR_PASSWORD_FOR_MYSQL>
If you are using MariaDB, specify in the yaml like below:
1mysql/mariadb:
2  endpoint: localhost:3306
3  username: <YOUR_USERNAME_FOR_MARIADB>
4  password: <YOUR_PASSWORD_FOR_MARIADB>
Quick verify (optional): From the Agent host, confirm the DB is reachable with your creds:
1mysql -h <db-host> -P 3306 -u <user> -p'<pass>' -e "SELECT 1" && echo OK || echo FAIL2 Access Integrations#
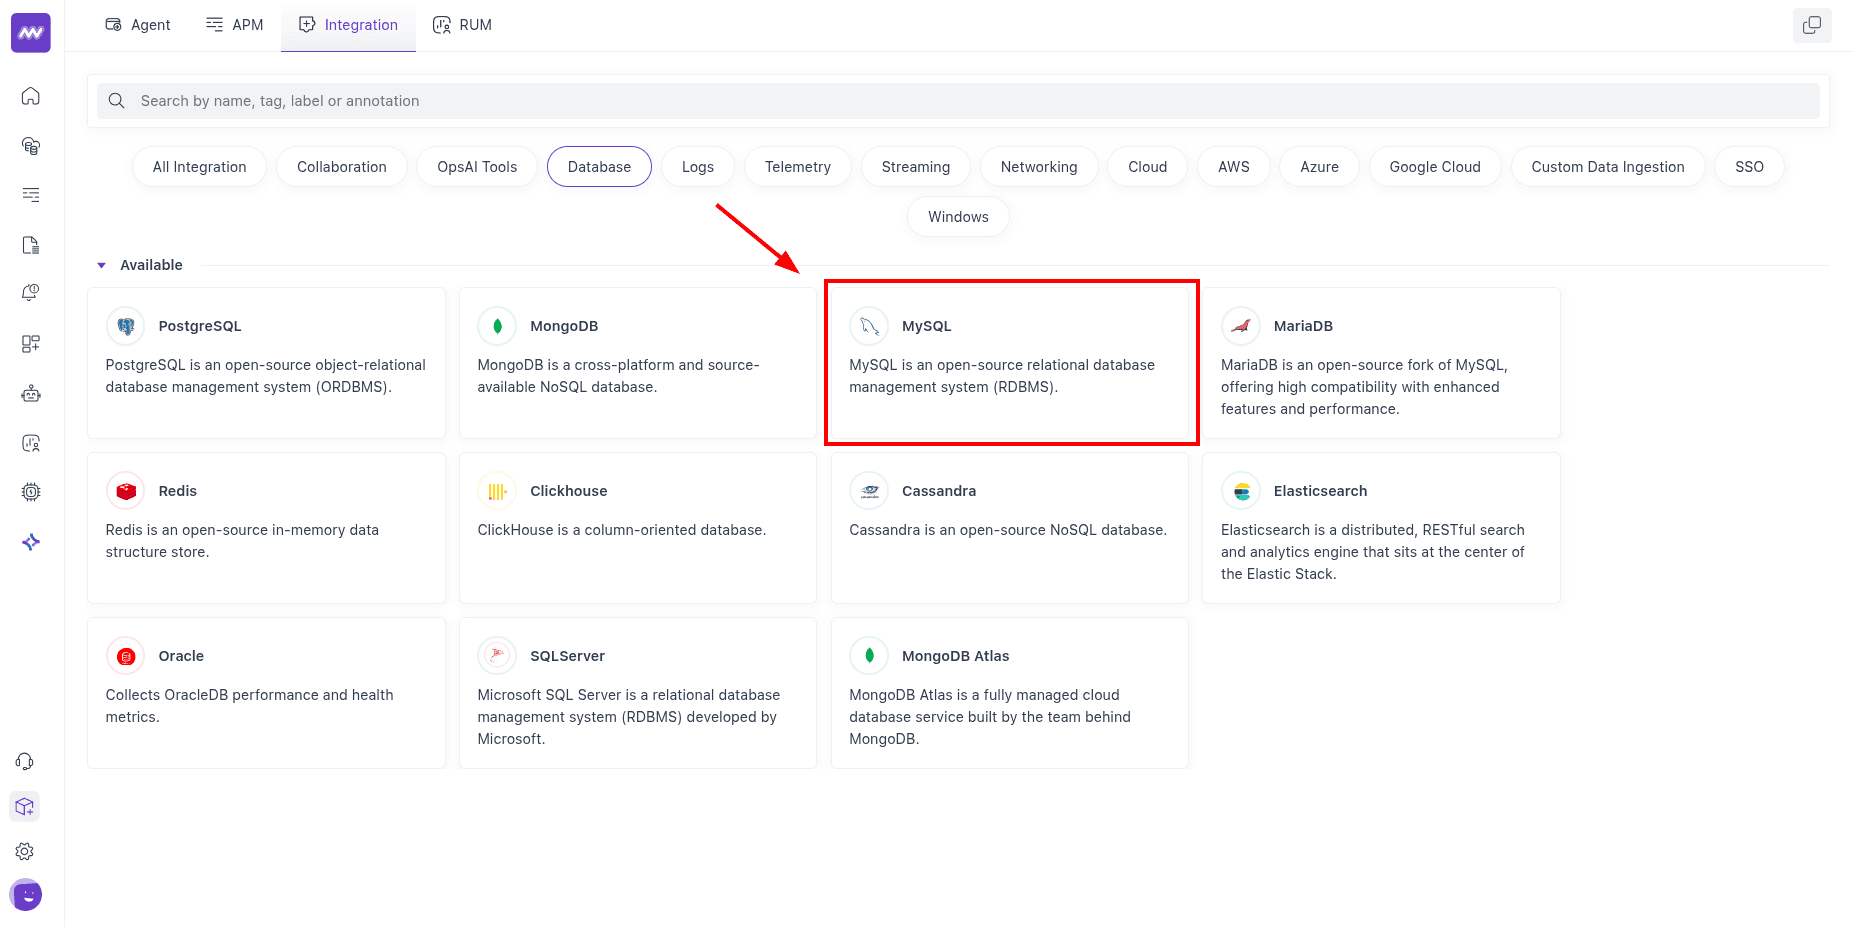
In Middleware, go to Installations → All Integrations → MySQL.
3 Enable Integration#
Select the host (where the Host Agent is running), paste the credential file path from Step 1, and Save.
User-Based Authentication#
MySQL metrics are gathered from performance_schema, sys_schema, and server status variables. Create a non-root user with the required permissions.
1 Create a user#
1CREATE USER 'mw'@'%' IDENTIFIED BY '<PASSWORD>';
2-- or restrict to a specific host:
3-- CREATE USER 'mw'@'<hostaddr>' IDENTIFIED BY '<PASSWORD>';
Verify the user can connect:
1mysql -u mw --password='<PASSWORD>' -e "SHOW STATUS" | grep Uptime \
2&& echo "MySQL user - OK" || echo "Cannot connect to MySQL"
2 Grant mw permissions#
1GRANT REPLICATION CLIENT ON *.* TO 'mw'@'%';
2ALTER USER 'mw'@'%' WITH MAX_USER_CONNECTIONS 5;
3GRANT PROCESS ON *.* TO 'mw'@'%';
4GRANT SELECT ON performance_schema.* TO 'mw'@'%';
If you are a MariaDB user, You may need one extra grant:
1GRANT SLAVE MONITOR ON *.* TO 'mw'@'%';3 Check Permissions#
1mysql -u mw --password='<PASSWORD>' -e "SHOW SLAVE STATUS" \
2&& echo "MySQL grant - OK" || echo "Missing REPLICATION CLIENT grant"
Visualize Analytics#
- Default MySQL Dashboard: A ready-to-use dashboard appears in Dashboard Builder after you enable the integration.
- Create MySQL Widget: In any dashboard, choose Add New Widget →
mysqlto see the full list of available metrics.
Alerts#
Create alerts on any MySQL metric: choose Detection Method: Database, Database Type: MySQL, then pick a metric and set thresholds (e.g., slow queries, replica lag, handler errors).
Metrics Collected#
| Metric | Description |
|---|---|
mysql.buffer_pool.pages | Number of pages in the InnoDB buffer pool |
mysql.buffer_pool.data_pages | Number of data pages in the InnoDB buffer pool |
mysql.buffer_pool.page_flushes | Number of requests to flush pages from the InnoDB buffer pool |
mysql.buffer_pool.operations | Number of operations on the InnoDB buffer pool |
mysql.buffer_pool.limit | Configured size of the InnoDB buffer pool |
mysql.buffer_pool.usage | Number of bytes in the InnoDB buffer pool |
mysql.commands | Count of commands executed, per command type |
mysql.prepared_statements | Count of prepared statements executed, per statement type |
mysql.handlers | Number of requests to MySQL handlers |
mysql.double_writes | Number of writes to the InnoDB doublewrite buffer |
mysql.log_operations | Number of InnoDB log operations |
mysql.operations | Number of InnoDB operations |
mysql.page_operations | Number of InnoDB page operations |
mysql.table.io.wait.count | Total count of I/O wait events for a table |
mysql.table.io.wait.time | Total time of I/O wait events for a table |
mysql.index.io.wait.count | Total count of I/O wait events for an index |
mysql.index.io.wait.time | Total time of I/O wait events for an index |
mysql.row_locks | Number of InnoDB row blocks |
mysql.row_operations | Number of InnoDB row operations |
mysql.locks | Number of MySQL locks |
mysql.sorts | Number of MySQL sorts |
mysql.threads | State of MySQL threads |
mysql.locked_connects | Number of attempts to connect to locked user accounts |
mysql.opened_resources | Number of opened resources |
mysql.mysqlx_connections | Number of mysqlx connections |
mysql.tmp_resources | Number of created temporary resources |
mysql.table.lock_wait.read.count | Count of lock wait read events |
mysql.table.lock_wait.read.time | Total lock wait read event time |
mysql.table.lock_wait.write.count | Count of lock wait write events |
mysql.table.lock_wait.write.time | Total lock wait write event time |
mysql.locked_connects | Number of attempts to connect to locked user accounts |
mysql.connection.count | Total number of connection attempts to the MySQL server (includes successful and unsuccessful attempts) |
mysql.connection.errors | Client connection process errors |
mysql.mysqlx_connections | Number of mysqlx connections |
mysql.joins | Number of joins that perform table scans |
mysql.replica.time_behind_source | Actual replica delay, in seconds |
mysql.replica.sql_delay | Configured replica delay, in seconds |
mysql.statement_event.count | Count of statement events |
mysql.statement_event.wait.time | Total wait time of summarized timed events |
mysql.mysqlx_worker_threads | Number of worker threads available |
mysql.table_open_cache | Total number of hits, misses, and overflows for open table cache lookups |
mysql.query.client.count | Number of client statements executed by the server |
mysql.query.count | Total number of statements executed by the server |
mysql.query.slow.count | Number of slow queries |
mysql.statement_event.count | Summary of current and recent statement events |
mysql.statement_event.wait.time | The total wait time of the summarized timed events |
mysql.statement_event.count_stars | The total count of executed queries per normalized query and schema |
mysql.innodb.buffer_pool_pages_flushed | Rate of pages being flushed from the InnoDB buffer pool |
mysql.innodb.buffer_pool_read_requests | Rate of read requests made to the InnoDB buffer pool |
mysql.innodb.os_file_reads | Rate at which files are read by InnoDB |
mysql.innodb.data_read | Rate at which data is read from disk by InnoDB |
mysql.innodb.dblwr_pages_written | Rate of pages written to the doublewrite buffer to prevent partial page writes |
mysql.innodb.ibuf_merged_delete_marks | Rate of delete marks merged from the insert buffer to the buffer pool |
mysql.innodb.ibuf_merged_deletes | Rate of delete operations merged from the insert buffer |
mysql.innodb.os_log_written | Total bytes written to the log by InnoDB |
mysql.innodb.row_lock_waits | Rate at which operations wait for row locks, indicative of contention on row-level data |
mysql.innodb.buffer_pool_reads | Rate of read operations that required actual disk I/O in the InnoDB buffer pool |
mysql.innodb.dblwr_writes | Rate of operations writing to the doublewrite buffer |
mysql.innodb.s_lock_os_waits | Rate at which OS waits for shared locks occur |
mysql.innodb.s_lock_spin_waits | Rate at which spin waits for shared locks occur |
mysql.innodb.rows_deleted | Rate at which rows are being deleted in InnoDB |
mysql.innodb.mutex_os_waits | Rate at which InnoDB operations need to wait for operating system level mutexes |
mysql.innodb.row_lock_time | Total time spent waiting for row locks by operations in InnoDB |
mysql.innodb.buffer_pool_wait_free | Number of waits for a free page in the buffer pool |
mysql.innodb.data_fsyncs | Rate of fsync operations by InnoDB to disk |
mysql.innodb.lsn_flushed | Log sequence number of the last flushed log |
mysql.innodb.os_log_fsyncs | Rate at which fsync() operations are issued to the InnoDB log file |
mysql.innodb.rows_inserted | Rate at which rows are being inserted in InnoDB |
mysql.innodb.rows_read | Rate at which rows are being read in InnoDB |
mysql.innodb.x_lock_os_waits | Rate at which OS waits for exclusive locks occur |
mysql.innodb.x_lock_spin_rounds | Rate at which spin rounds for exclusive locks occur |
mysql.innodb.x_lock_spin_waits | Rate at which spin waits for exclusive locks occur |
mysql.innodb.pages_created | Rate at which pages are created by InnoDB |
mysql.innodb.data_reads | Rate of data read operations performed by InnoDB |
mysql.innodb.ibuf_merged | Rate at which records are merged from the insert buffer |
mysql.innodb.ibuf_merges | Rate of operations merging data from the insert buffer to the buffer pool |
mysql.innodb.log_writes | Rate of actual log writes |
mysql.innodb.os_file_fsyncs | Rate at which InnoDB performs fsync() operations on files |
mysql.innodb.pages_read | Rate at which pages are read by InnoDB |
mysql.innodb.s_lock_spin_rounds | Rate at which spin rounds for shared locks occur |
mysql.innodb.buffer_pool_write_requests | Rate of write requests to the InnoDB buffer pool |
mysql.innodb.lsn_current | Current log sequence number |
mysql.innodb.data_writes | Rate of data write operations performed by InnoDB |
mysql.innodb.buffer_pool_read_ahead | Rate of pages read into the buffer pool by read-ahead |
mysql.innodb.data_written | Rate at which data is written to disk by InnoDB |
mysql.innodb.lsn_last_checkpoint | Log sequence number of the last checkpoint |
mysql.innodb.mutex_spin_waits | Rate of mutex spin waits in InnoDB, indicating contention within internal data structures |
mysql.innodb.buffer_pool_read_ahead_evicted | Rate of pages read by read-ahead and then evicted without being accessed |
mysql.innodb.ibuf_merged_inserts | Rate of insert operations merged from the insert buffer |
mysql.innodb.os_file_writes | Rate at which files are written by InnoDB |
mysql.innodb.mutex_spin_rounds | Rate of spin rounds per mutex spin in InnoDB, showing the effort needed to acquire a mutex |
mysql.innodb.log_write_requests | Number of write requests made to the log |
mysql.innodb.pages_written | Rate at which pages are written by InnoDB |
mysql.innodb.lock_structs | Rate at which lock structures are being used or created |
mysql.innodb.log_waits | Number of waits due to log buffer being too small |
mysql.innodb.rows_updated | Rate at which rows are being updated in InnoDB |
mysql.innodb.mem_thread_hash | Memory used by InnoDB for thread hash |
mysql.innodb.locked_transactions | Number of transactions that have acquired locks |
mysql.innodb.mem_file_system | Memory used by InnoDB for file system data structures |
mysql.innodb.buffer_pool_data | Total number of bytes of data in the InnoDB buffer pool |
mysql.innodb.pending_ibuf_aio_reads | Number of pending insert buffer asynchronous I/O reads |
mysql.innodb.read_views | Number of 'read view' structures currently active; these are used to manage consistent read views |
mysql.innodb.buffer_pool_pages_dirty | Number of dirty pages in the InnoDB buffer pool |
mysql.innodb.buffer_pool_total | Total number of bytes within the InnoDB buffer pool |
mysql.innodb.active_transactions | Current number of active transactions in InnoDB |
mysql.innodb.data_pending_reads | Current number of pending read operations in InnoDB |
mysql.innodb.data_pending_writes | Current number of pending write operations in InnoDB |
mysql.innodb.pending_aio_sync_ios | Number of pending asynchronous I/O operations that need synchronization |
mysql.innodb.buffer_pool_free | Number of bytes currently free within the InnoDB buffer pool |
mysql.innodb.os_log_pending_fsyncs | Number of pending fsyncs for logs |
mysql.innodb.pending_normal_aio_reads | Number of pending normal asynchronous I/O read operations |
mysql.innodb.row_lock_current_waits | Current number of operations waiting for row locks in InnoDB |
mysql.innodb.ibuf_size | Total size of the insert buffer |
mysql.innodb.mem_adaptive_hash | Memory used by InnoDB for the adaptive hash index |
mysql.innodb.buffer_pool_dirty | Current number of bytes held in dirty pages in the InnoDB buffer pool |
mysql.innodb.buffer_pool_used | Number of bytes currently used within the InnoDB buffer pool |
mysql.innodb.locked_tables | Number of tables currently locked by InnoDB |
mysql.innodb.pending_aio_log_ios | Number of pending asynchronous I/O operations on the log |
mysql.innodb.pending_normal_aio_writes | Number of pending normal asynchronous I/O write operations. |
mysql.innodb.mem_page_hash | Memory used by InnoDB for page hash |
mysql.innodb.mem_lock_system | Memory used by InnoDB for lock system data structures |
mysql.innodb.mem_total | Total memory allocated to InnoDB |
mysql.innodb.queries_queued | Number of queries waiting to be processed by InnoDB |
mysql.innodb.semaphore_waits | Number of semaphore waits |
mysql.innodb.buffer_pool_pages_data | Number of data pages in the InnoDB buffer pool |
mysql.innodb.buffer_pool_utilization | Percentage of the InnoDB buffer pool currently being utilized |
mysql.innodb.hash_index_cells_total | Total number of cells in the adaptive hash index |
mysql.innodb.mem_additional_pool | Memory allocated to InnoDB's additional pool |
mysql.innodb.mem_dictionary | Memory used by InnoDB for dictionary information |
mysql.innodb.pending_log_writes | Number of pending writes to the log file |
mysql.innodb.queries_inside | Number of queries currently being processed inside InnoDB |
mysql.innodb.tables_in_use | Number of tables currently in use by InnoDB |
mysql.innodb.ibuf_segment_size | Size of the segment available for the insert buffer |
mysql.innodb.pending_checkpoint_writes | Number of pending writes to establish a new checkpoint |
mysql.innodb.buffer_pool_read_ahead_rnd | Number of random read-aheads in the InnoDB buffer pool |
mysql.innodb.current_row_locks | Current number of row locks held by operations in InnoDB |
mysql.innodb.data_pending_fsyncs | Current number of pending fsync operations in InnoDB |
mysql.innodb.pending_buffer_pool_flushes | Number of pending buffer pool flush operations |
mysql.innodb.current_transactions | Current number of transactions happening in InnoDB |
mysql.innodb.semaphore_wait_time | Total wait time for semaphores |
mysql.innodb.history_list_length | Length of the history list, indicating the number of pages consumed by transactions not yet flushed |
mysql.innodb.ibuf_free_list | Number of pages in the insert buffer free list |
mysql.innodb.mem_recovery_system | Memory used by InnoDB for transaction recovery |
mysql.innodb.checkpoint_age | Age of the last checkpoint in InnoDB |
mysql.innodb.hash_index_cells_used | Number of used cells in the adaptive hash index |
mysql.innodb.os_log_pending_writes | Number of pending log writes |
mysql.innodb.buffer_pool_pages_free | Number of free pages in the InnoDB buffer pool |
mysql.innodb.pending_log_flushes | Number of pending flush operations for the log buffer |
mysql.innodb.buffer_pool_pages_total | Total number of pages in the InnoDB buffer pool |
Troubleshooting#
Integrations menu is missing:
- Your account likely lacks Installation permissions. Ask an admin to grant the Installation permission in Settings.
Host Agent can’t read the credentials file (Docker)
- Ensure the YAML is inside
/var/logon the Agent host and reference that exact path in Step 3.
Connection/authentication failures:
Test from the Agent host with the same creds:
1mysql -h <db-host> -P 3306 -u <user> -p'<pass>' -e "SELECT 1"- Fix DNS/firewall/port or credentials if it fails.
User-based auth: grants incomplete
- Re-run the Check permissions command. If it prints “Missing REPLICATION CLIENT grant,” apply the grants in Step 2, and for MariaDB, also apply
GRANT SLAVE MONITOR.
Only one node appears (replica setups)
- Add each instance you want to monitor (or ensure your endpoint points at the intended node). Metrics are collected per instance.
Need assistance or want to learn more about Middleware? Contact our support team at [email protected] or join our Slack channel.