Endpoints Observability
Endpoints uses trace traffic to automatically discover your API endpoints and display key signals like request volume, latency percentiles, and error rate. By attaching an OpenAPI (Swagger) spec, Middleware matches endpoints to documented operations and adds contract context such as parameters and response definitions.
What You See on the Endpoints Screen#
The Endpoints table shows a row per endpoint and includes:
- Endpoint: method + route
- Service: where the endpoint was served from
- Requests: volume in the selected time range
- Error rate: percentage of failed requests
- P95 / P99 latency: tail latency based on real traffic
- API: whether the endpoint is linked to an uploaded OpenAPI spec

Link Endpoints with an OpenAPI Spec#
You can add an OpenAPI spec to Middleware in two ways:
- Connect to GitHub
- Upload OpenAPI file (JSON or YAML)
OpenAPI specs typically describe parameters by location (path, query, header, cookie) and define responses by HTTP status codes, which is the same structure Middleware uses when it displays enriched endpoint definitions.
Step 1: Open API List#
First, go to APM → Endpoints.
From the Endpoints screen, click View APIs.
Step 2: Add a New API#
Click Add New API on the API List page.

Step 3: Upload or Connect the Spec#
In the "Add New API" panel:
- Enter a Name
- Choose:
- Connect to GitHub, or
- Upload OpenAPI File (JSON/YAML)

View and Manage an Uploaded API#
After adding a spec, it appears in the API List with helpful metadata like:
- Spec name
- API group
- Components count
- Spec type (OpenAPI)
- Source (Upload)
- Schema version
Open an API to See Linked Endpoints#
Click the API entry to open the API details view.
In the API details view you can see:
- Metadata like Name, Version, Source, Format, Last Updated
- Tags and Components count
- A list of endpoints tied to that API, with traffic and latency signals
.webp&w=3840&q=75)
OpenAPI uses components to store reusable definitions like schemas, parameters, and responses, which is why "components" count is useful context when you upload a spec.
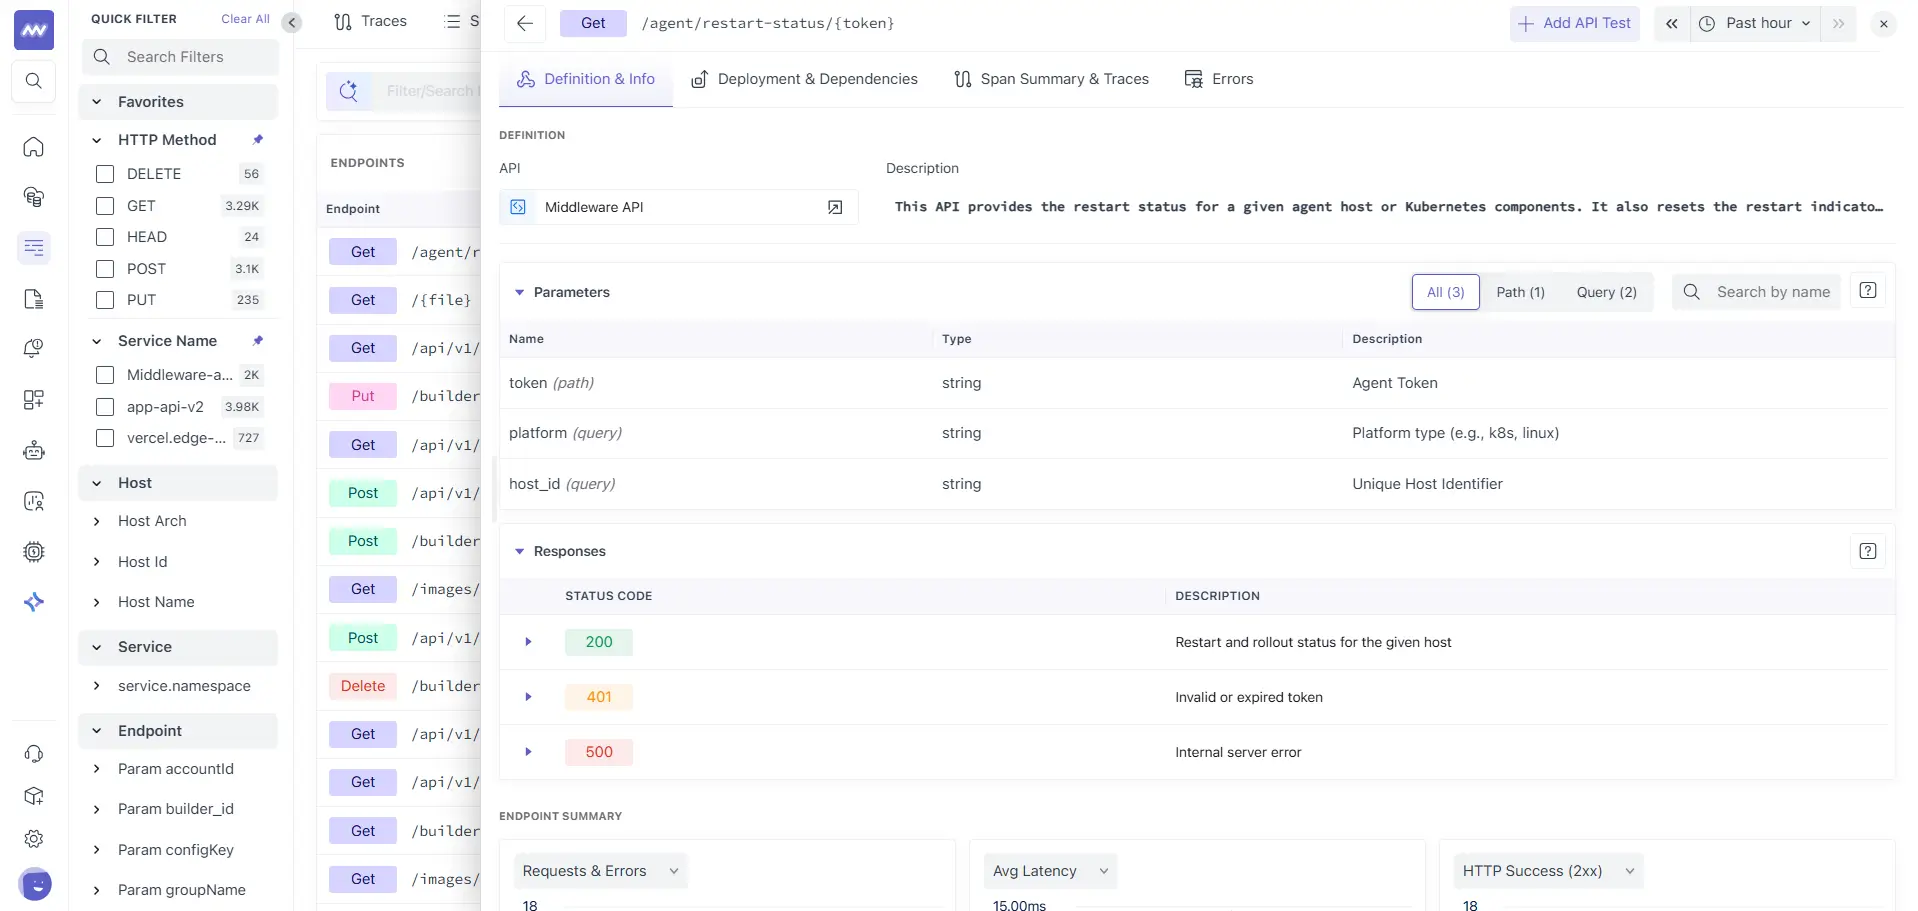
Drill into a Single Endpoint#
Click any endpoint to open its detailed view. This is where Endpoint Observability becomes most useful because you get both:
- Runtime behaviour (traces, spans, latency, errors)
- API contract context (definition, parameters, response codes) when an OpenAPI is linked
In the header, you'll see the endpoint method and route, plus quick actions like Add API Test and time range controls.
Definition and Info#
This tab is where Middleware surfaces the contract-level details from your OpenAPI spec.
What you can do here:
- Confirm which API spec the endpoint is linked to
- Read the endpoint description
- Explore parameters grouped by type
- Review documented response codes
Parameters
Parameters are listed with:
- Name
- Location (path or query)
- Data type
- Description
You can filter parameters using:
- All
- Path
- Query
- Body
And search by parameter name.
OpenAPI formally distinguishes these parameter locations, which is what enables the Path and Query grouping.
Responses
Responses are shown as a list of HTTP status codes (for example 200, 401, 500) with descriptions, taken from the spec's response definitions.
Deployment and Dependencies#
This tab helps you understand how the endpoint behaves across versions of the service.
Deployments
You can see endpoint performance by service version, including:
- Requests per second
- P50, P90, P99 latency
- Error rate
- Apdex score
This is useful when you want to compare whether a new release made an endpoint faster or slower.
Dependencies
Below deployments, the Dependencies section shows a map view when dependency data is available. If nothing is available for the selected range, you'll see a "No data found" state.

Span Summary and Traces#
This is the runtime view of the endpoint, driven by trace data.
Span Summary
The Span Summary table breaks down the work happening under the endpoint, grouped by span types such as:
- HTTP
- PostgreSQL
- Internal
- Function
- Job
- Others
For each span entry you can see:
- Service name
- Span name
- Type
- Average duration
- Error rate
This helps you quickly spot where time is going, like database calls versus internal processing.
Traces
Below span summary:
- A trace volume graph over time (Linear or Log)
- A trace list with key fields like timestamp, duration, method, status code, span kind

Errors#
The Errors tab is the place to focus on failures for the selected endpoint. It's designed for answering "what's breaking here" after you've found an endpoint with elevated error rates on the main list.

When to Use Endpoints Observability#
Endpoints Observability is especially useful when:
- Monitoring API performance and health
- Debugging endpoint-level issues
- Comparing performance across service versions
- Understanding API contract compliance
- Investigating error patterns in specific endpoints
- Onboarding new team members to your API structure
Need assistance or want to learn more about Middleware? Contact our support team at [email protected].