Synthetic Monitoring
Synthetic Monitoring uses simulated requests from global locations to continuously verify that your apps, APIs, and network endpoints are up, fast, and behaving as expected. You choose a request type (HTTP, DNS, SSL, WebSocket, UDP, ICMP, TCP, or gRPC), define success criteria (“assertions”), pick run locations, set a schedule, and wire up notifications. The default request type is HTTP if you don’t select another.
When to use it (and what you’ll get)#
- Availability baselines: Know if an endpoint is up from multiple geographies—not just from inside your VPC.
- Performance SLOs: Track response time and success rate over time; catch latency regressions before customers do.
- External-facing dependencies: Verify DNS, certificates (SSL/TLS), and TCP reachability, even when your app is healthy.
- Early warning: Configure alerts to notify Slack/Email/Opsgenie/PagerDuty when conditions fail (e.g., status≠200 or latency>500ms).
Create a Synthetic Monitor#
The new-monitor flow has six guided steps. Each section below explains what you see and how to choose values that make sense for your use case.
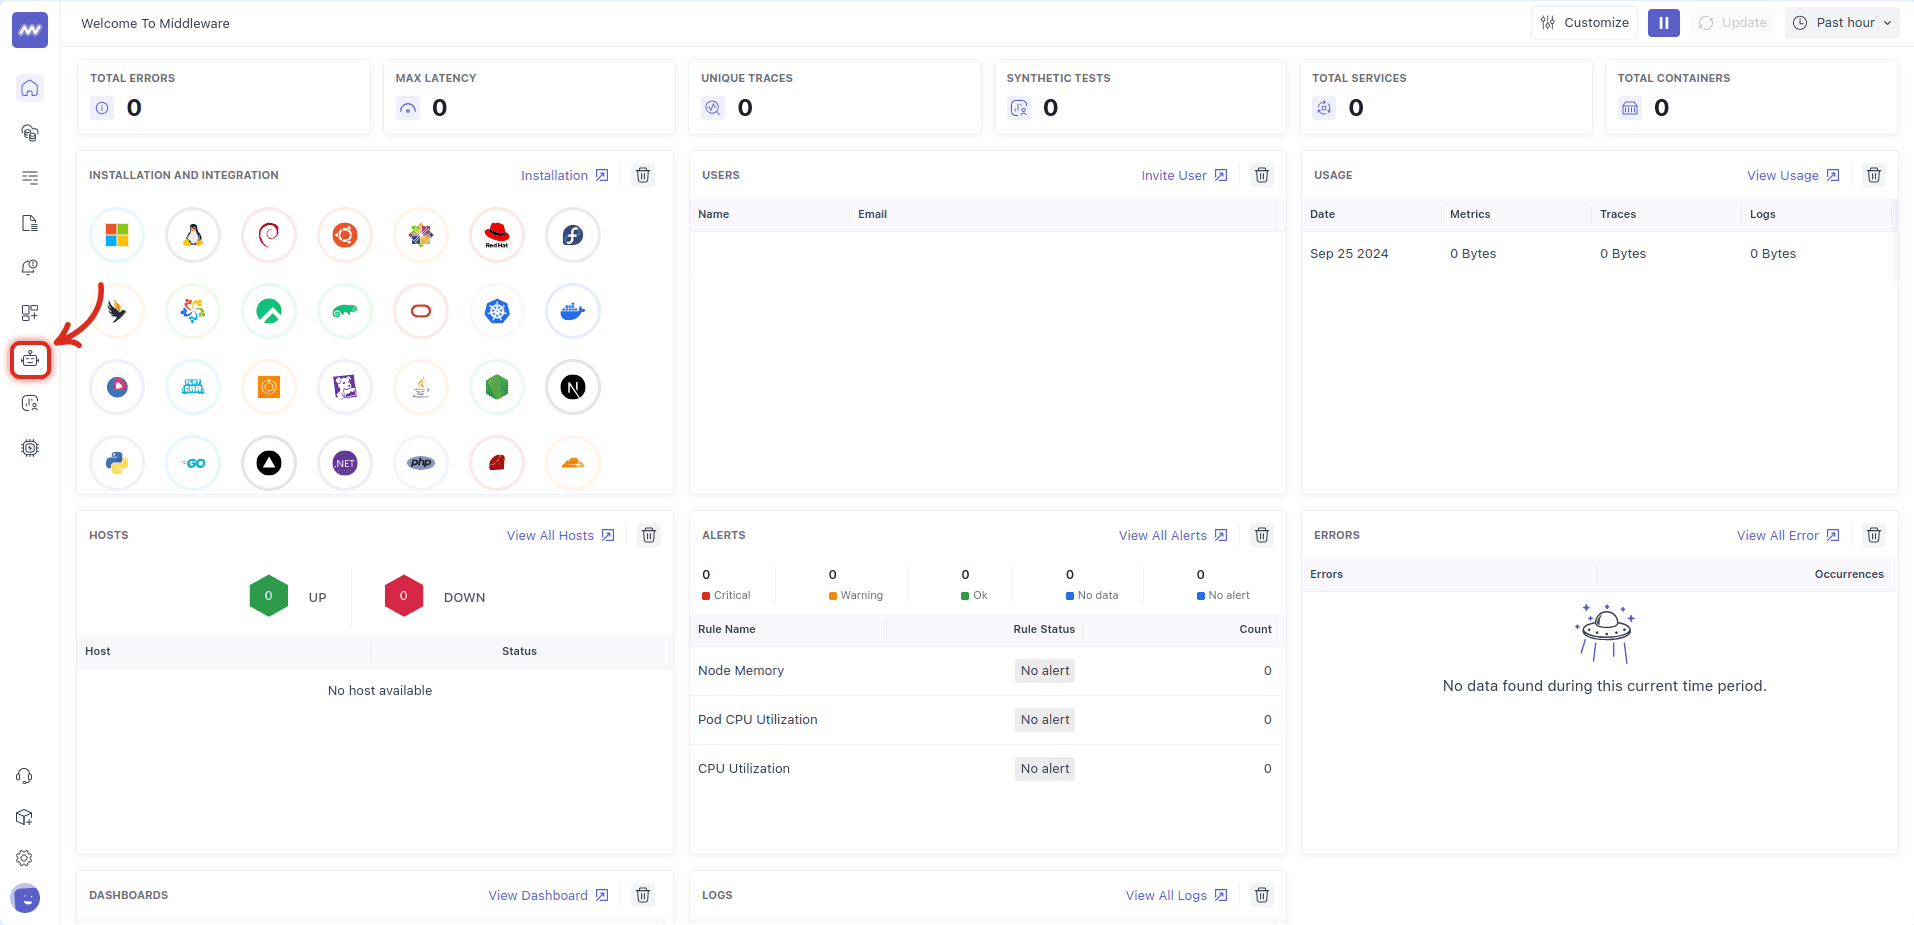
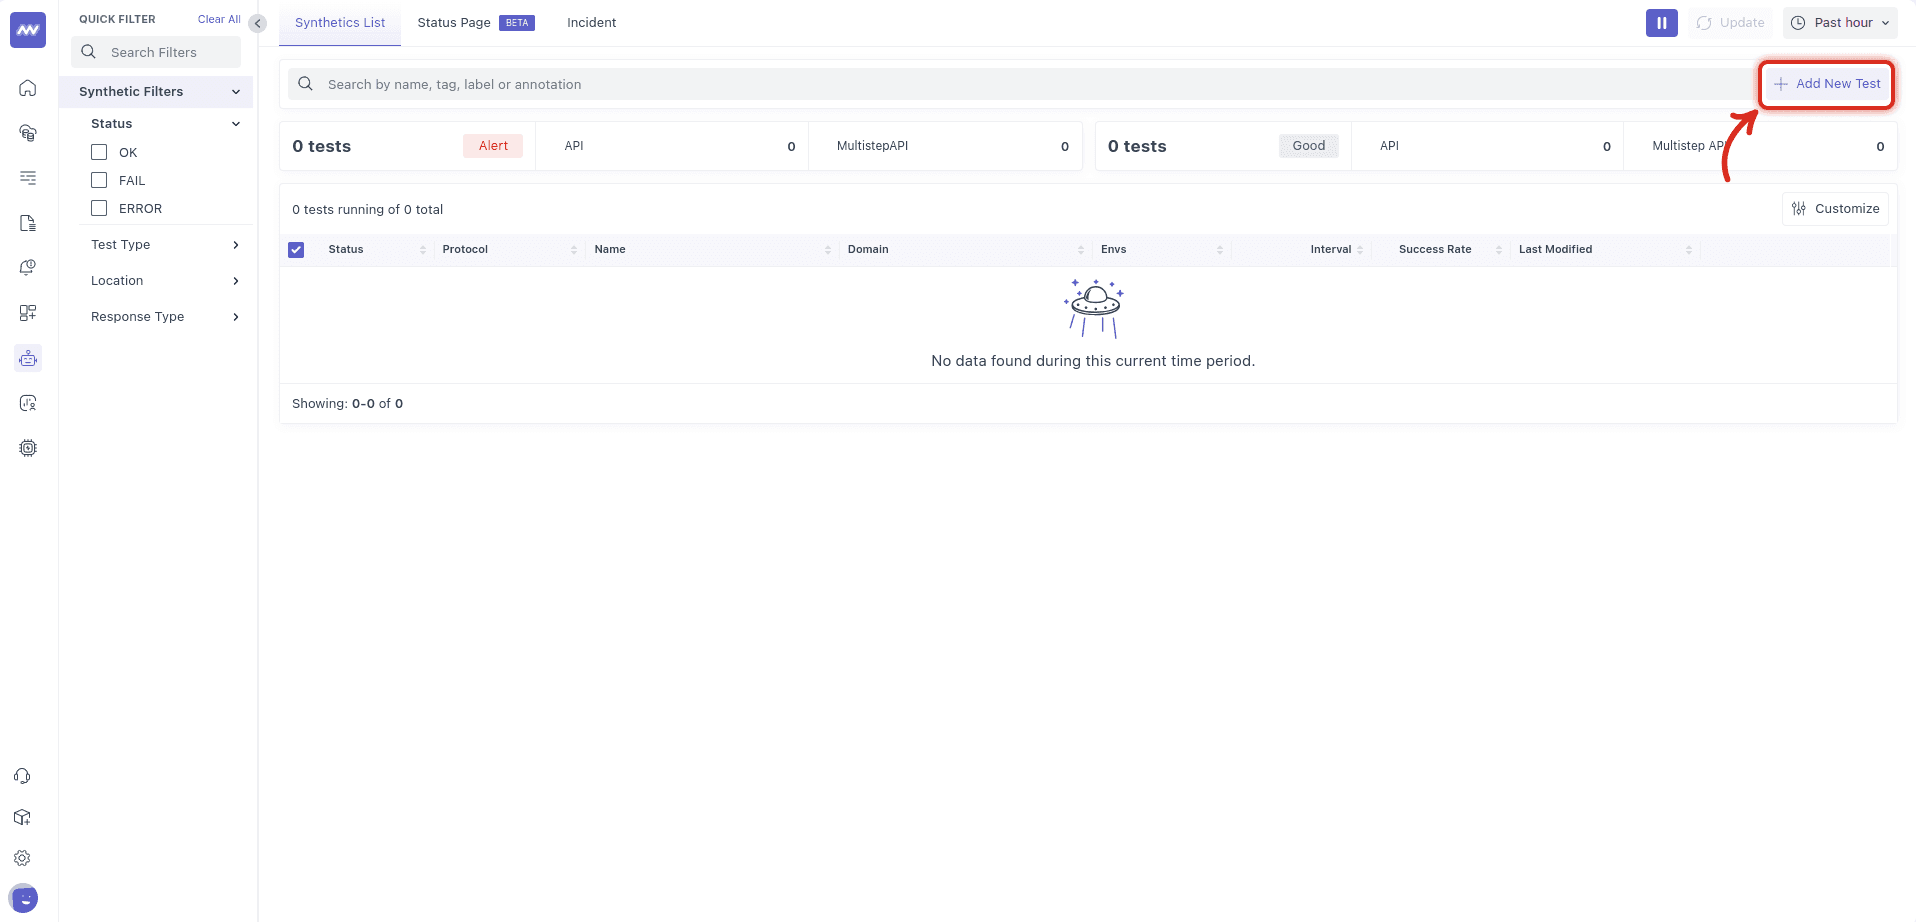
1 Create a New Test#
From the left sidebar, open Synthetic Monitoring → Add New Test. The Synthetics List view also exposes quick filters (Status, Test Type, Location, Response Type) so you can later find and manage monitors at scale.
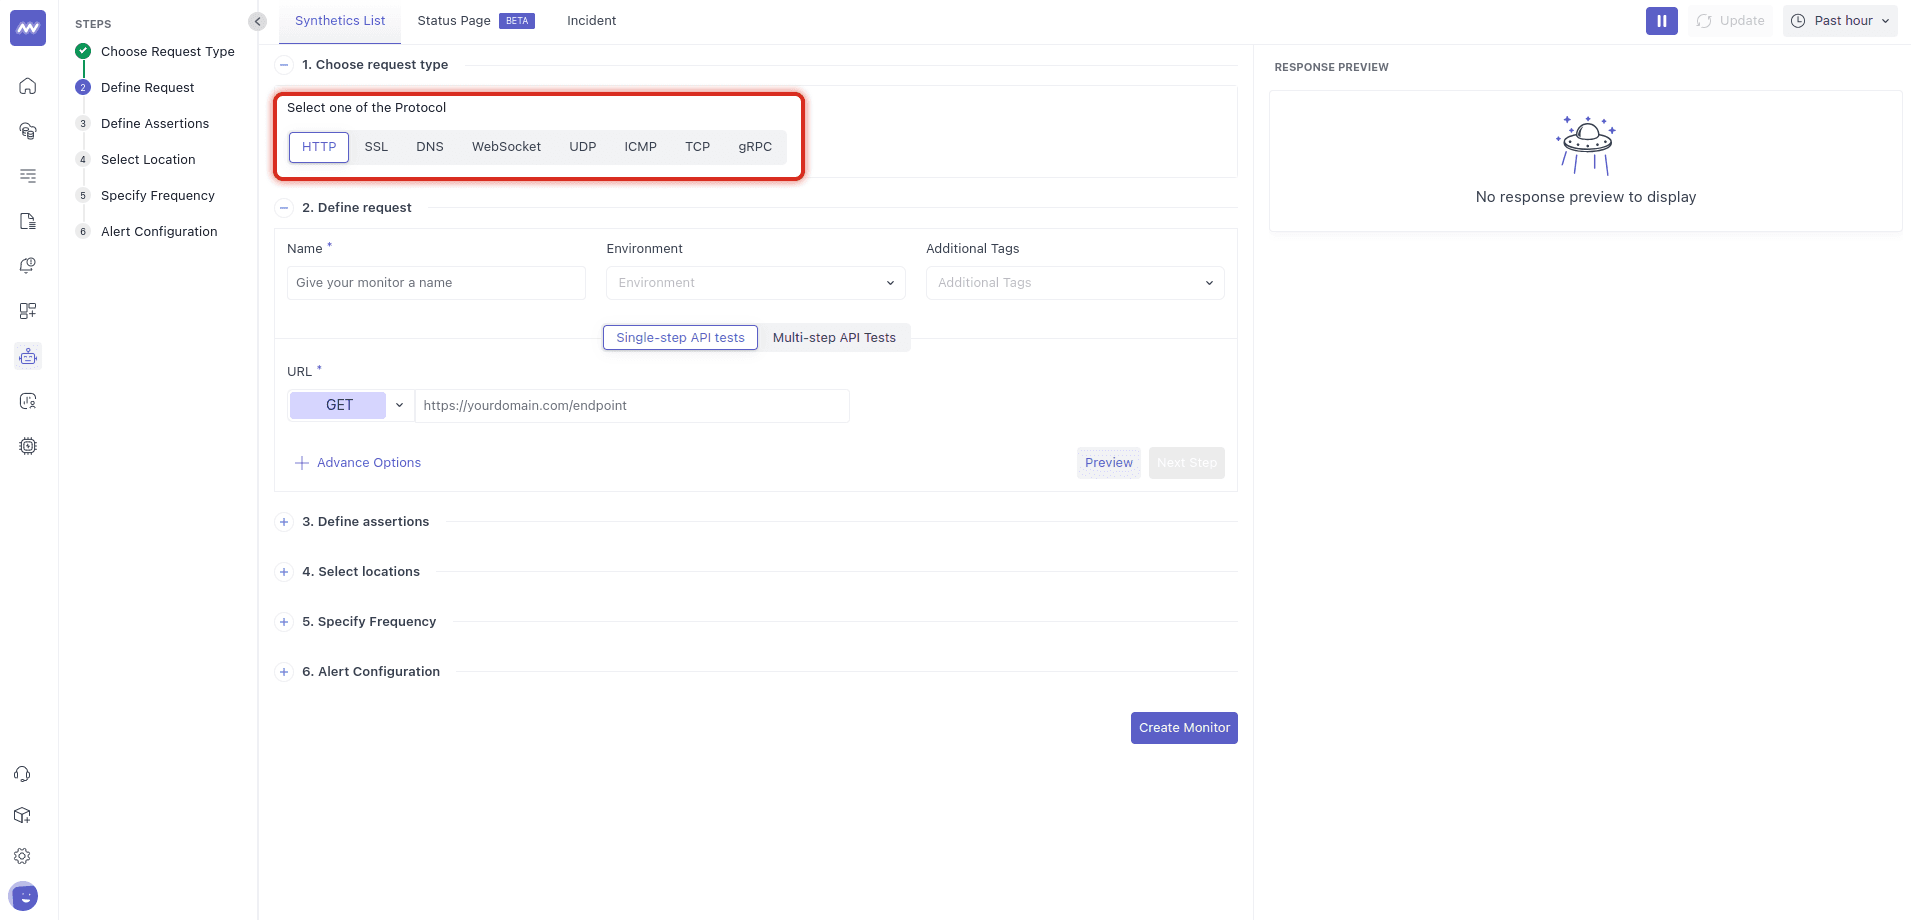
2 Choose Request Type#
Pick the protocol you need to test. If you don’t specify one, it defaults to HTTP. Typical use cases:
- HTTP: Ping a web/API endpoint; validate status code, response time, and (optionally) content presence.
- SSL: Check TLS/SSL certificate validity/expiration for a host.
- DNS: Resolve a record and measure response/accuracy.
- WebSocket: Open a socket and exchange a message.
- UDP / ICMP / TCP: Validate basic network reachability/latency/packet loss outside the application layer.
- gRPC: Call a gRPC endpoint and track latency/errors.
Tip: Start with the simplest check that proves your SLI. For an API, that’s usually: HTTP 200 AND response time < threshold. Add deeper checks later.
3 Define the Request#
Fill out:
- Name: A human-readable label (e.g.,
Landing page – us-eastorCheckout API), so teams instantly recognize what failed. - Environment: Tag monitors per environment (prod/stage/dev) to scope dashboards and notifications.
- Additional Tags: Freeform labels for ownership/routing (e.g.,
team:payments,service:web). - Test Type: Choose Single-step API tests here. (Multistep and Browser tests are separate flows.)
- HTTP Method & URL (for HTTP): Select the verb (GET/POST/DELETE…) and enter the endpoint URL. Use the same URL structure you’d give a customer or external integration.

Good practice: model monitors after real traffic. If customers call /api/v1/products?category=shoes, test that exact path with any required headers or tokens (never test an internal endpoint if the user-visible one is different).
4 Define Assertions (your pass/fail rules)#
Assertions declare exactly what success means. The UI lets you stack rules like:
- When the Status code is 200
- AND When the Response time is less than 500 ms

Design tips
- Choose thresholds that reflect your SLOs (e.g., “p95 < 300ms” might translate to a conservative <500ms per run, depending on variability).
- Model AND conditions sparingly; excessive rules increase false positives in noisy networks.
5 Select Locations#
Pick one or more regions where the monitor should run. Start with a single region to validate your setup, then expand. Geographies often surface hidden problems such as CDN routing, DNS geo, or regional WAF rules.

If your endpoints are restricted, whitelist the synthetic agent IPs (table below). This is required for private allow-lists and geofenced services.
6 Specify Test Frequency#
Decide how often to run. Higher frequencies catch issues earlier but cost more and can generate more traffic.

Frequency guidance:
- Critical APIs: 30–60s.
- Non-critical: 1–5 min.
- Heavy endpoints: Start at 5–10 min, then tune down if needed.
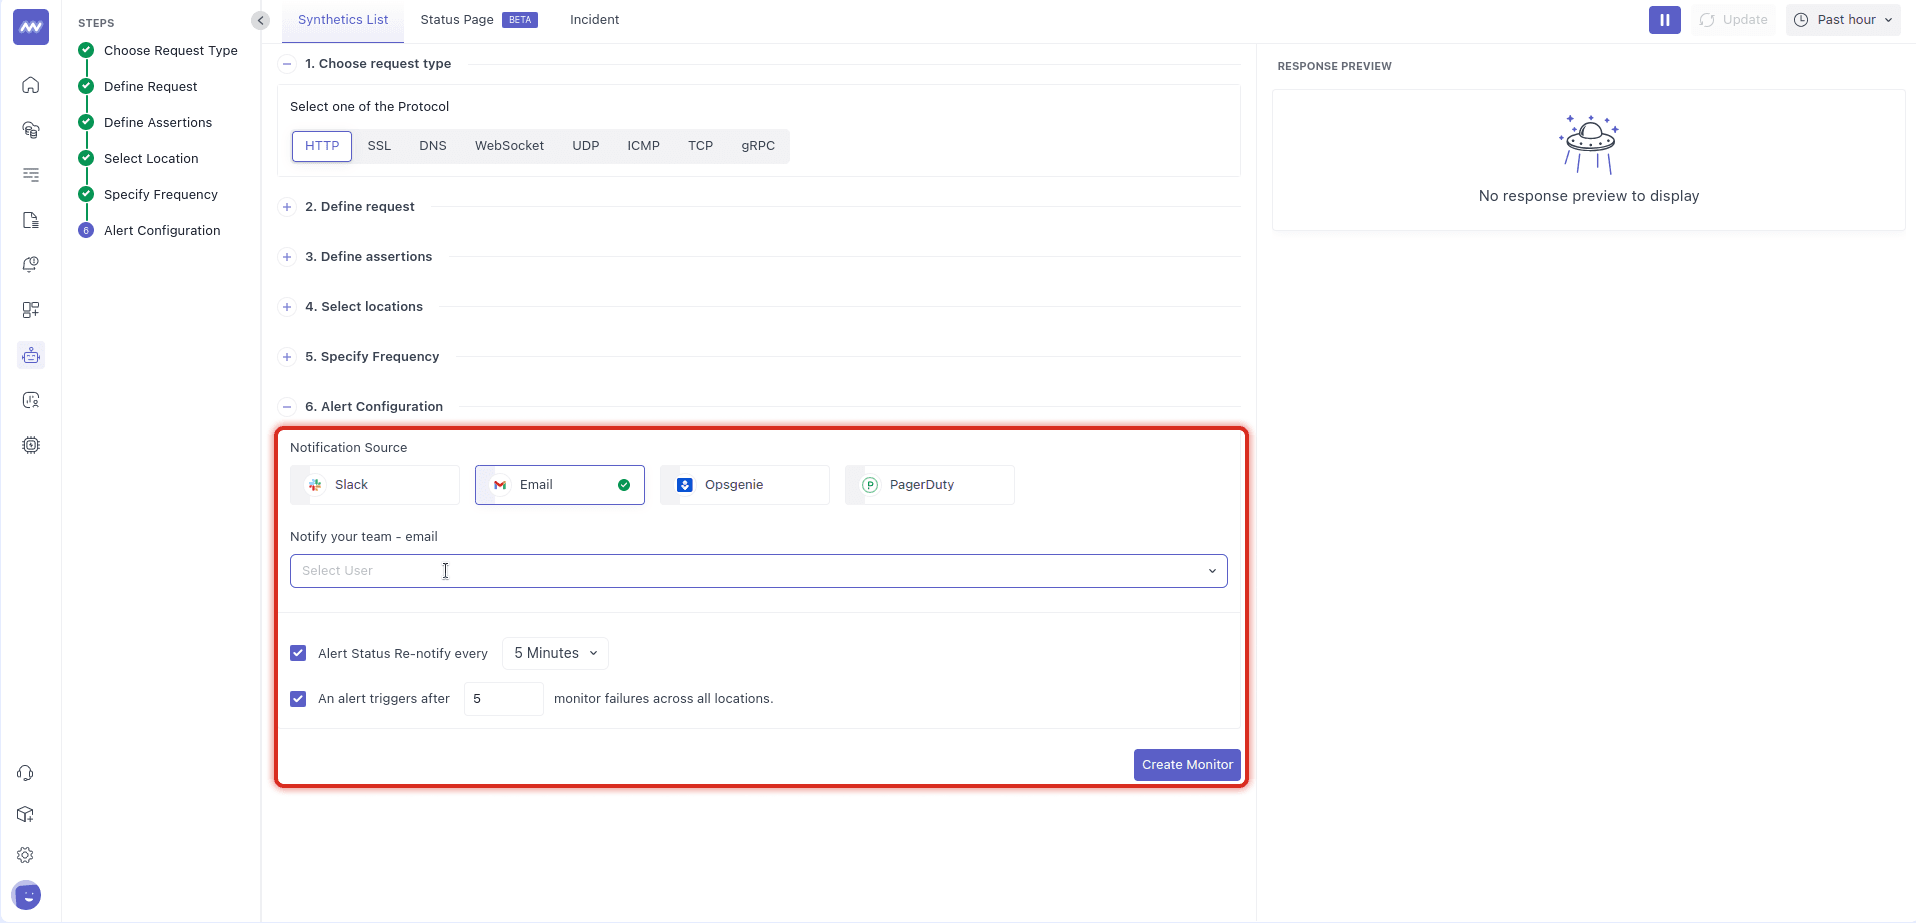
7 Configure Notifications#
Select your notification source(s) (Slack, Email, Opsgenie, PagerDuty), add recipients, and fine-tune behavior:
- Re-notify every n minutes to keep incidents visible.
- Trigger after n monitor failures across all locations to dampen one-off blips.
Click Create Monitor to save.
Whitelist these Public IPs (if needed)#
If your services are behind allow-lists, add the following IPs so the Middleware’s synthetic agents can reach them. (IPs may change; you’ll be notified of planned updates.)
| Region | Location | Public IP |
|---|---|---|
| US | North Virginia | 184.73.132.14 |
| US | California | 18.144.107.2 |
| Asia Pacific | Hong Kong | 16.162.16.221 |
| Asia Pacific | Mumbai | 35.154.132.98 |
| Asia Pacific | Seoul | 43.201.168.121 |
| Asia Pacific | Singapore | 52.76.158.43 |
| Asia Pacific | Sydney | 13.210.225.158 |
| Asia Pacific | Tokyo | 54.249.157.179 |
| Europe | Frankfurt | 52.57.15.39 |
| Europe | London | 3.11.236.173 |
| Europe | Paris | 52.47.67.164 |
| Canada | Central Canada | 3.97.34.227 |
| South America | São Paulo | 54.207.185.173 |
| Middle East | Bahrain | 15.184.102.232 |
| Africa | Cape Town | 13.244.83.119 |
Reading the Synthetics List#
The list view shows columns such as Status, Protocol, Name, Env, Interval, Success Rate, and Last Modified. Use the left-hand Synthetic Filters (status/test type/location/response type) and the search bar for quick triage.
Iterating Safely#
- Start with one location and conservative assertions → validate no false positives.
- Add more locations → catch geography-specific issues (CDN, DNS, firewall).
- Tighten thresholds once baseline variability is understood.
- Use failure-count before alert, so brief blips don’t page your team.
Troubleshooting#
- Monitor fails only in one region → verify your network allow-list includes the IP for that region. Check regional WAF/CDN rules.
- Flaky latency → raise the threshold or reduce frequency; network jitter is expected across continents.
- HTTP 2xx but still “fail” → review all assertions; a strict response-time rule is often the culprit.
- No notification → ensure a channel (Slack/Email/etc.) is selected, a recipient is set, and re-notify/threshold settings aren’t suppressing alerts.
Need assistance or want to learn more about Middleware? Contact our support team at [email protected] or join our Slack channel.