Scala
| Traces | Metrics | App Logs | Custom Logs | Profiling |
|---|---|---|---|---|
| ✅ | ✅ | ✅ | ✅ | ✅ |
1. Prerequisites#
- Middleware Host Agent running on the same machine (or reachable). In containers, point apps to the agent with MW_AGENT_SERVICE: Docker 172.17.0.1, Kubernetes mw-service.mw-agent-ns.svc.cluster.local.
- Scala/SBT project (Scala 2.11.6+ is fine) and JDK 8+. Check using:
1scala --version
2java --version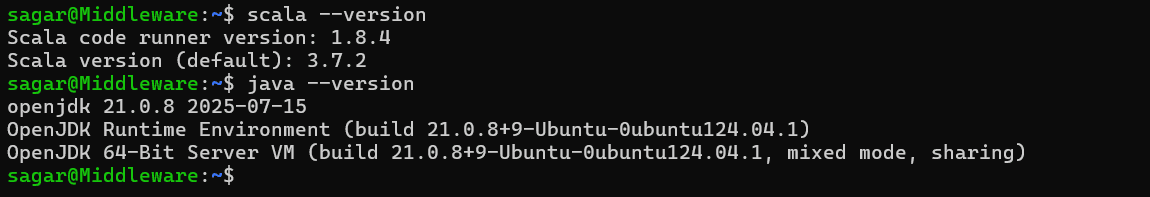
1 Download the Middleware Java agent JAR#
Grab the latest release of the Middleware Java agent JAR from GitHub and place it in your project (e.g., project root or a lib/ directory).
Keep the filename versioned (e.g., middleware-javaagent-1.x.y.jar) and commit it or fetch it during CI.
2 Wire the agent in build.sbt#
Enable a forked JVM and pass -javaagent + service name via javaOptions. (Forking is required for SBT to apply javaOptions to your app’s run.)
1// build.sbt
2ThisBuild / scalaVersion := "2.13.14"
3
4// ensure SBT forks for run so javaOptions apply
5(run / fork) := true
6
7(run / javaOptions) ++= Seq(
8  // point to where you stored the agent jar
9  "-javaagent:middleware-javaagent-1.6.0.jar",
10  // logical service name shown in Middleware APM
11  "-Dotel.service.name={APM-SERVICE-NAME}"
12)
(Your existing Scala page uses the same javaOptions structure; we’re just adding the fork so it takes effect.) Alternative: if you prefer, you can manage javaagents via the community sbt-javaagent plugin instead of manual javaOptions.
3 Run your app with your account key#
Your Middleware API key is required; export it and run the app via SBT:
1MW_API_KEY="<API-key>" sbt runIf you’re not running a Host Agent, point the agent straight to Middleware’s ingest and keep the rest identical:
1// build.sbt (add one more property)
2(run / javaOptions) ++= Seq(
3  "-Dotel.exporter.otlp.endpoint=https://ruplp.middleware.io" // serverless ingest URL
4)
OpenTelemetry Java agents accept the standard otel.exporter.otlp.endpoint property; the SDK constructs the signal-specific paths as needed for OTLP/HTTP. You’ll still export MW_API_KEY=... alongside sbt run.
(Optional) Custom logs from your Scala code#
If you want to emit custom logs (INFO/WARN/DEBUG/ERROR) that correlate with traces, add the agent-apm-java library to your build and use its Logger:
- Add dependency (SBT):
1// build.sbt 2libraryDependencies += "io.github.middleware-labs" % "agent-apm-java" % "0.0.18" - Use the logger (Scala/Java interop):
1// anywhere in your app code 2import io.github.middlewarelabs.agentapmjava.Logger 3 4Logger.info("info message") 5Logger.debug("debug message") 6Logger.warn("warn message") 7Logger.error("error message") - Record stack errors Call
recordErrorfrom a catch block to attach stack traces to the active span:1try { 2 // ... 3} catch { 4 case e: Exception => 5 io.github.middlewarelabs.agentapmjava.Logger.recordError(e) 6 throw e 7}
View your data#
After you start the app, wait 3–5 minutes, then open Traces, Logs, and Profiling in Middleware to verify data is flowing. (This mirrors your Scala page’s flow.)
SBT notes & tips#
- Forking is required for
javaOptions(like-javaagent) to apply tosbt run. Configure(run / fork) := true. - If you package with sbt-native-packager, you can also push Java options into start scripts via
Universal / javaOptionsor add extra defines to scripts. - When sending data without a local collector,
otel.exporter.otlp.endpointis the standard knob; OTLP exporters also support header-based auth viaotel.exporter.otlp.headersif you ever need it.
Environment variables#
| Key/Option | Where it's used | Purpose | Example |
|---|---|---|---|
MW_AGENT_SERVICE | Containerized host-based | Route app → Host Agent | 172.17.0.1 (Docker), mw-service.mw-agent-ns.svc.cluster.local (K8s). |
MW_API_KEY | Runtime env | Your Middleware account key, required for export | export MW_API_KEY="…"; then sbt run. |
-Dotel.service.name | javaOptions | Logical service name shown in APM | -Dotel.service.name=payments-scala |
-Dotel.exporter.otlp.endpoint | javaOptions(serverless) | Send telemetry directly to Middleware ingest (no Host Agent) | -Dotel.exporter.otlp.endpoint=https://ruplp.middleware.io. |
Troubleshooting#
- No telemetry appears → Confirm
(run / fork) := trueand the-javaagent:path is correct. SBT only applies javaOptions to a forked run. - Still no data on serverless → Ensure the endpoint property is set (
otel.exporter.otlp.endpoint) and that your key is present. OTLP HTTP exporters derive/v1/{signal}paths automatically when you set a base endpoint. - Packaging instead of
sbt run→ Use sbt-native-packager’sUniversal / javaOptionsor script defines so the agent flags end up in the generated start scripts.
Need assistance or want to learn more about Middleware? Contact our support team at [email protected] or join our Slack channel.