Connect Database Monitoring with APM Traces
Connecting Database Monitoring with APM shows which service and trace sent each PostgreSQL query. You can start from a slow query and see the services calling it, or start from a query sample and open the full request trace.
This feature is available for PostgreSQL.
How It Works#
- Your application is instrumented with APM, so every database call runs inside a trace span.
- A SQL commenter library appends the current trace context to each query as a comment:
1SELECT * FROM users WHERE id = $1 /*traceparent='00-4bf92f3577b34da6a3ce929d0e0e4736-00f067aa0ba902b7-01'*/ - When the agent samples
pg_stat_activity, it reads thetraceparentfrom the query text and stores the trace ID and span ID with the sample. - Middleware matches the span ID to your APM traces and shows the calling service and trace next to the query.
Prerequisites#
- APM instrumentation that sends traces to Middleware. See the APM setup guides.
- Query Sample Collection turned on in the PostgreSQL integration. See Set Up PostgreSQL.
- The latest Middleware Agent version.
Add Trace Context to SQL Queries#
Turn on SQL commenter in the database instrumentation of your application:
Use sqlcommenter for database/sql to open the database connection:
1import (
2    gosql "github.com/google/sqlcommenter/go/database/sql"
3    sqlcommentercore "github.com/google/sqlcommenter/go/core"
4    _ "github.com/lib/pq"
5)
6
7db, err := gosql.Open("postgres", "<connection-string>", sqlcommentercore.CommenterOptions{
8    Config: sqlcommentercore.CommenterConfig{
9        EnableTraceparent: true, // append traceparent to every query
10    },
11})
Turn on the SQL commenter option of the OpenTelemetry pg instrumentation:
1const { PgInstrumentation } = require("@opentelemetry/instrumentation-pg");
2
3new PgInstrumentation({
4  addSqlCommenterCommentToQueries: true,
5});
Turn on the commenter in the OpenTelemetry psycopg2 instrumentation:
1from opentelemetry.instrumentation.psycopg2 import Psycopg2Instrumentor
2
3Psycopg2Instrumentor().instrument(enable_commenter=True)
Any library that appends a W3C traceparent comment in the sqlcommenter format works the same way.
Verify the Connection#
- Send some traffic through your application.
- Open APM → Database → Samples. Click Customize and add the Calling Service, Trace ID, and Span ID columns. New samples show your service name and IDs.
- Open a sample. The Calling Service section shows the service, and the Trace tab shows the linked trace.
Where Correlation Appears#
- Query details → Upstream → Calling Services: every sample of the query linked to an APM service.
- Query details → Upstream → Traces: the linked spans. Click Open in Traces to continue in the Trace Explorer.
- Sample details: the Calling Service section and the Trace tab.
- Instance Summary → Calling Services: linked samples for the whole instance.
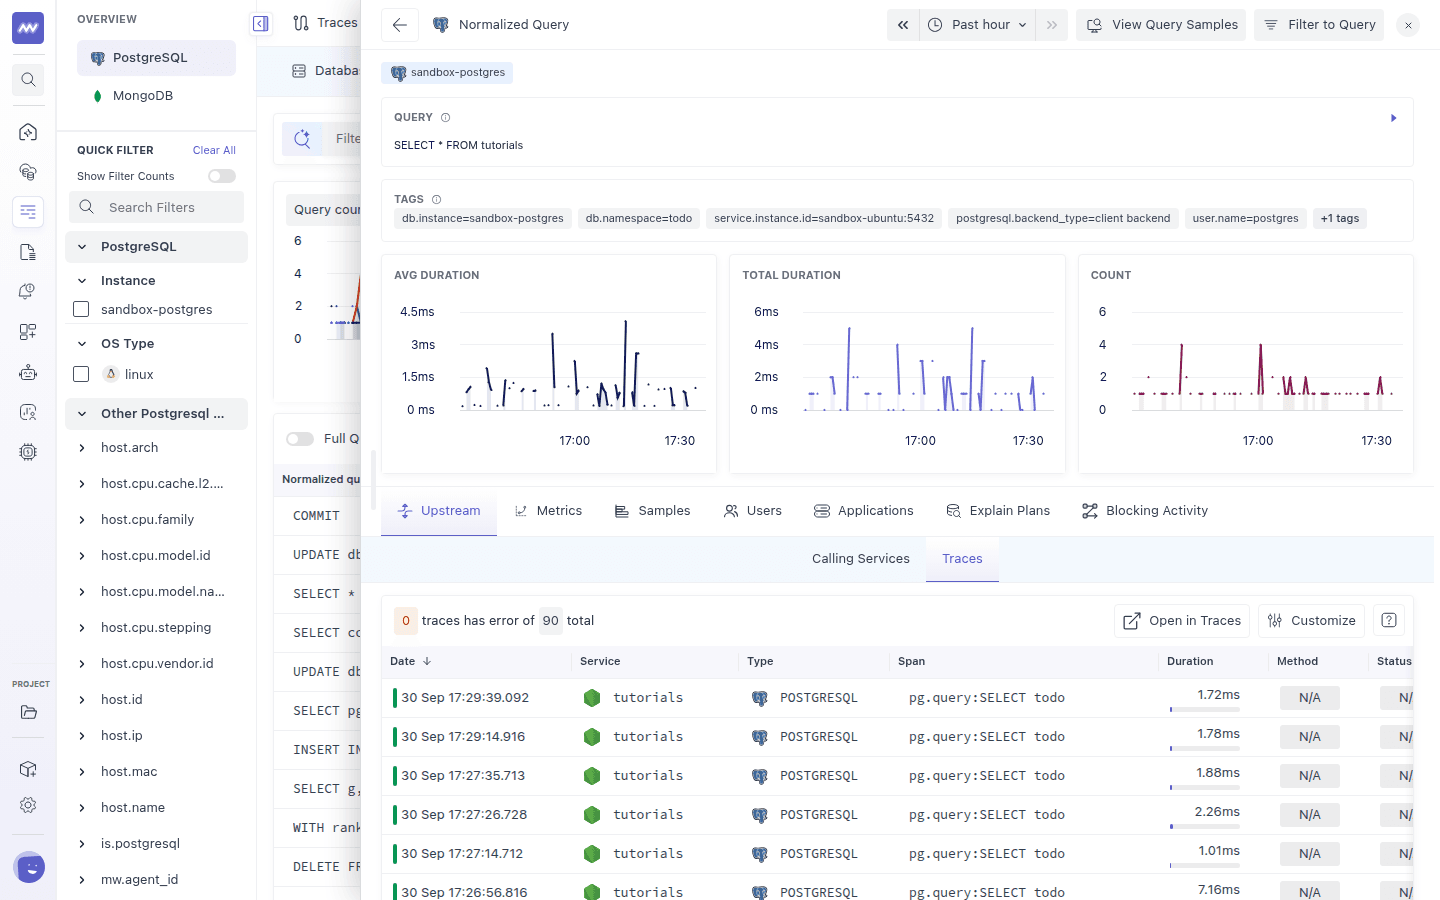
If nothing is linked, the Calling Services view shows "Please configure your application to link APM Services to Database Monitoring to see the data".
Limitations#
- Sampled, not every execution: a query is linked only if it is visible in
pg_stat_activitywhen the agent takes a sample. Very fast queries may be linked only some of the time. - Long queries: PostgreSQL stores only the first
track_activity_query_sizebytes of query text (1024 by default). The comment is added at the end, so it can be cut off on long queries. Increase the setting (for example, to4096) and restart PostgreSQL if long queries are not linked. - MongoDB: correlation with APM traces is not available for MongoDB.
Need assistance or want to learn more about Middleware? Get in touch with us via our Contact Us or join our Slack channel.