Redis Integration
Track Redis performance and health metrics (commands/sec, CPU, memory, keyspace, replication, I/O) in Middleware.
Prerequisites#
- Install the Middleware Host/Infra Agent on the machine that will collect metrics.
Setup#
1 Enter Redis connection details#
Have your Redis connection details ready: host, port number, and service name. You will enter these in the integration form (Step 3).
A quick reachability check from the Agent host helps before enabling the integration:
1# Plain TCP
2redis-cli -h <redis-host> -p <port> PING
3# TLS (example using a CA file)
4redis-cli --tls -h <redis-host> -p <port> --cacert <path_to_certificate> PING
Expect PONG if the server is reachable and the credentials/certs are valid.
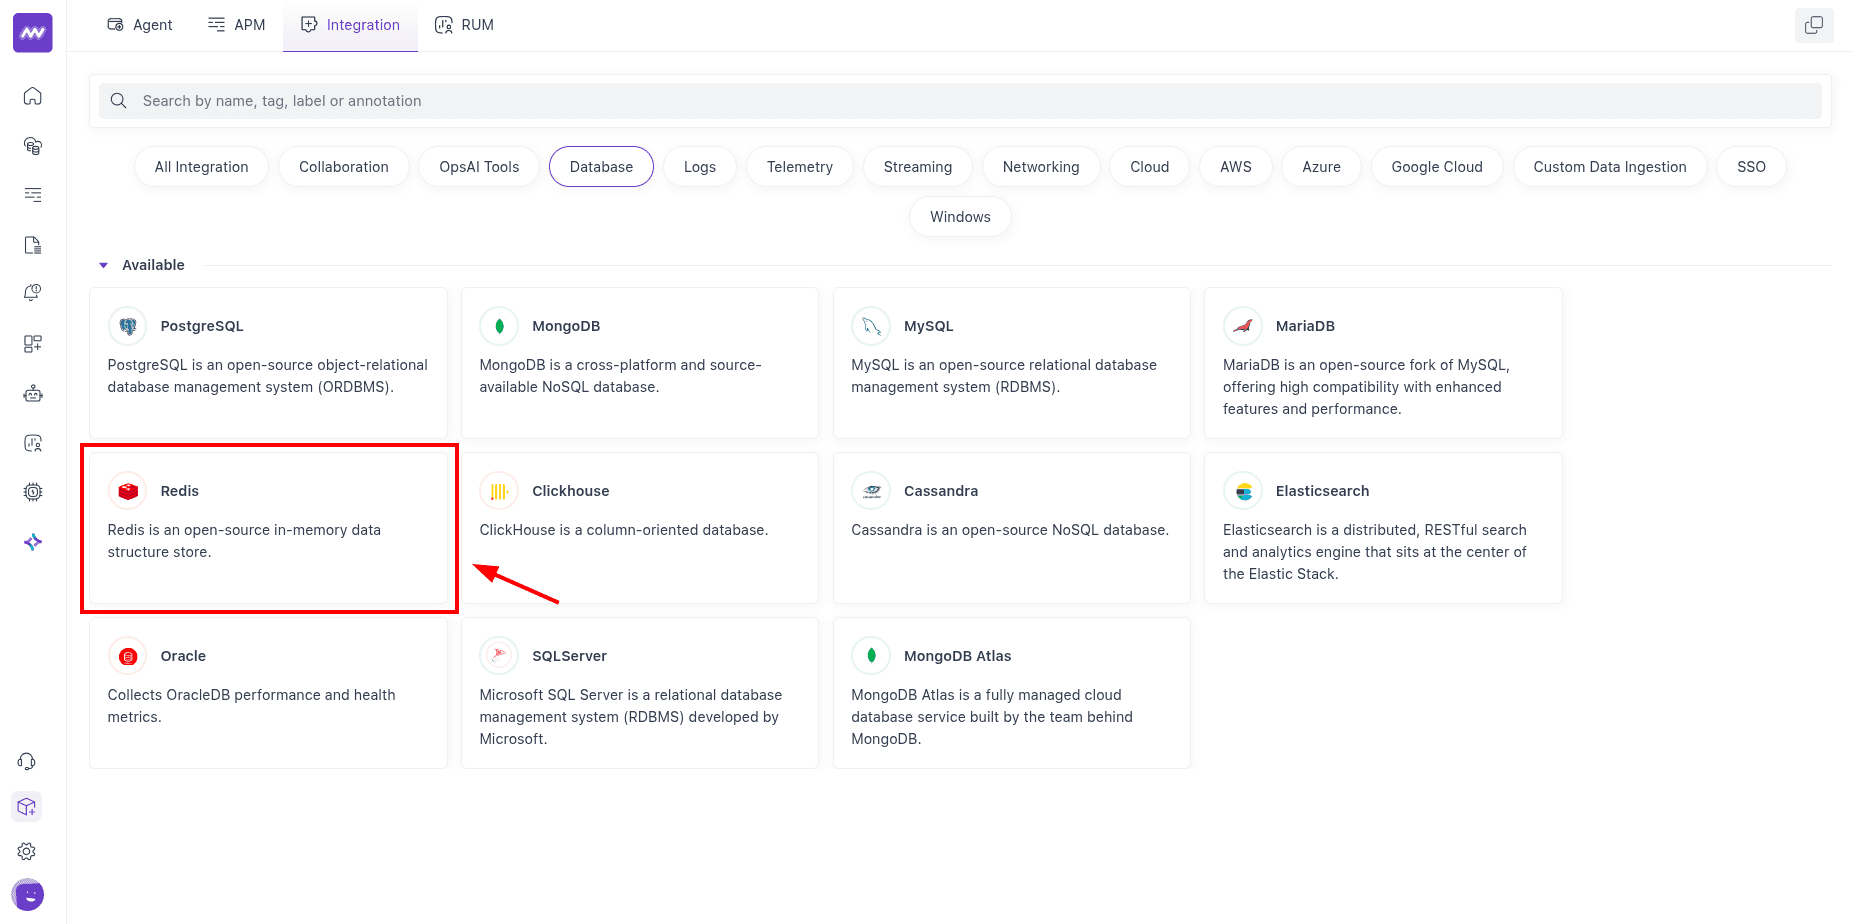
2 Access Integrations#
In Middleware, open Installations → All Integrations → Redis.
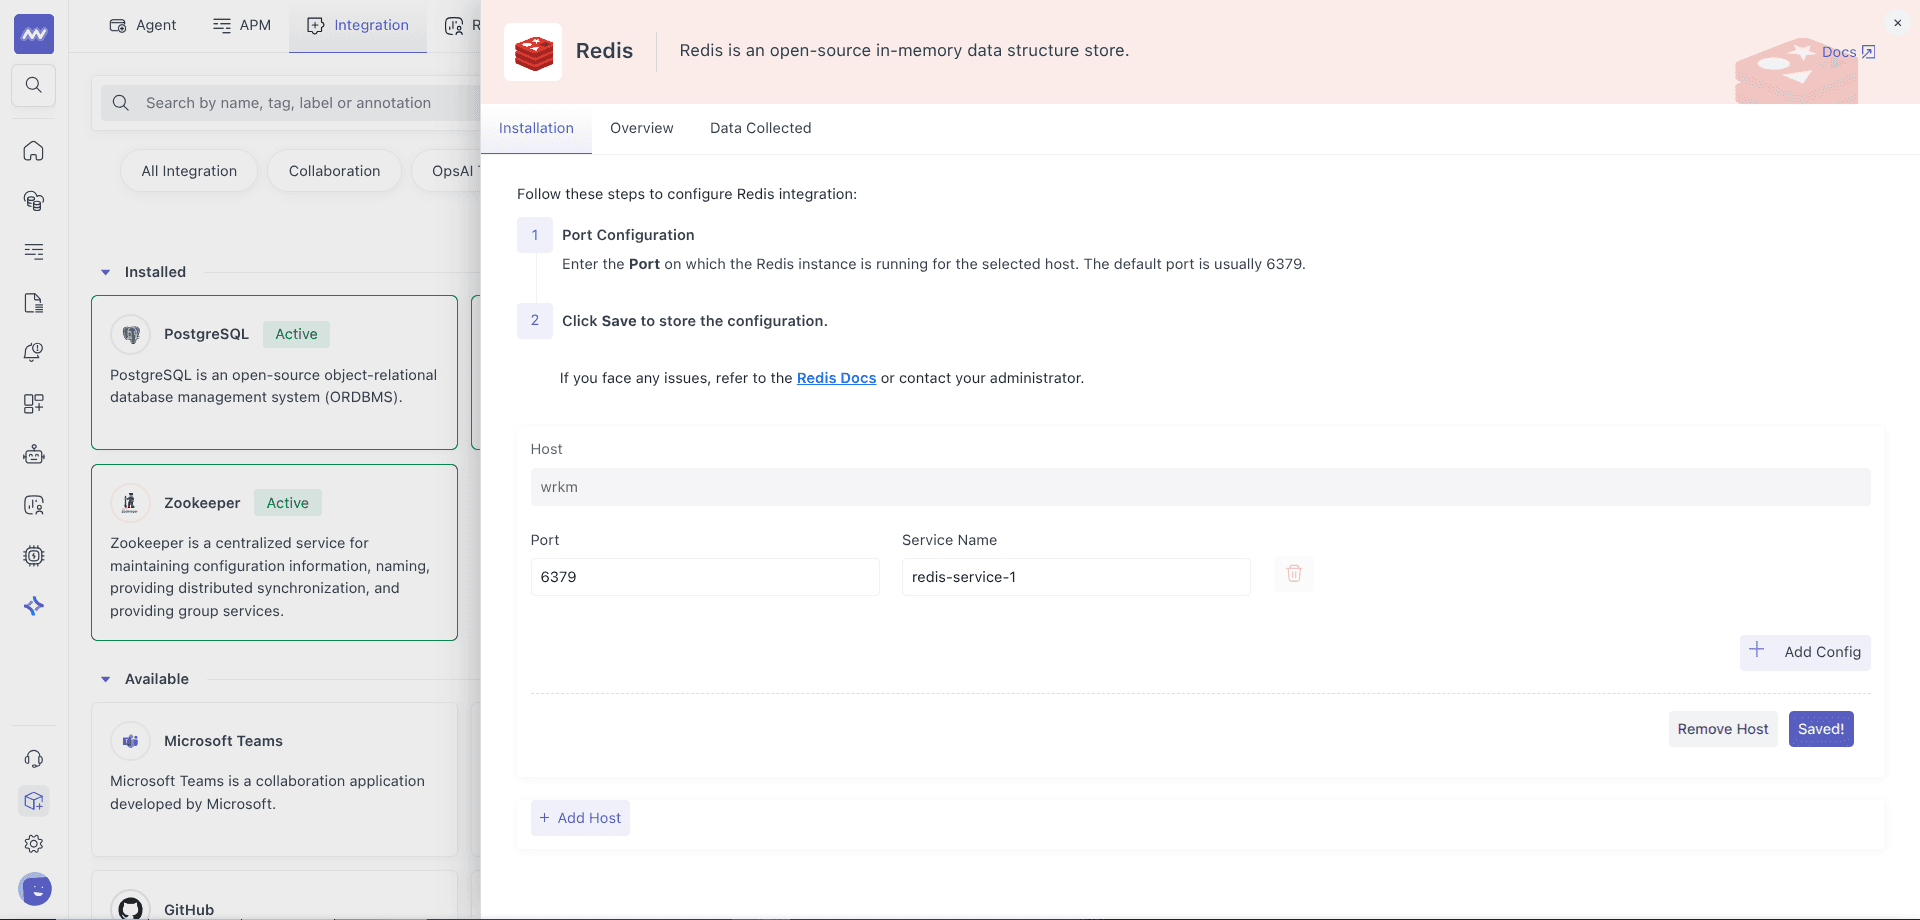
3 Enable Integration#
Select the host from the dropdown of Agent hosts, enter the port number and service name, and Save.
Visualize Analytics#
- A default Redis dashboard appears in Dashboard Builder after setup.
- To add custom charts, choose Add New Widget →
redisto browse available metrics.
Alerts#
Create alerts on any Redis metric: choose Detection Method: Database, Database Type: Redis, pick a metric, and set your conditions.
Metrics Collected#
| Metric | Description |
|---|---|
redis.maxmemory | Configured maxmemory value |
redis.role | Node’s role |
redis.cmd.calls | Total number of calls for a command |
redis.cmd.usec | Total time for all executions of this command |
redis.uptime | Number of seconds since server start |
redis.cpu.time | System CPU consumed since start |
redis.clients.connected | Client connections (excludes replica connections) |
redis.clients.max_input_buffer | Largest input buffer among current clients |
redis.clients.max_output_buffer | Longest output list among current clients |
redis.clients.blocked | Clients pending a blocking call |
redis.keys.expired | Total key expiration events |
redis.keys.evicted | Keys evicted due to maxmemory |
redis.connections.received | Connections accepted by the server |
redis.connections.rejected | Connections rejected due to maxclients |
redis.memory.used | Total bytes allocated by Redis |
redis.memory.peak | Historical max bytes consumed by Redis |
redis.memory.rss | Bytes allocated from operating system |
redis.memory.lua | Bytes used by the Lua engine |
redis.memory.fragmentation_ratio | Ratio between memory.rss and memory.used |
redis.rdb.changes_since_last_save | Number of changes since latest dump |
redis.commands | Number of commands processed per second |
redis.commands.processed | Total commands processed |
redis.net.input | Bytes read from the network |
redis.net.output | Bytes written to the network |
redis.keyspace.hits | Successful key lookups |
redis.keyspace.misses | Unsuccessful key lookups |
redis.latest_fork | Duration of latest fork (µs) |
redis.slaves.connected | Number of connected replicas |
redis.replication.backlog_first_byte_offset | Master offset of the replication backlog buffer |
redis.replication.offset | Current replication offset |
redis.db.keys | Number of keyspace keys |
redis.db.expires | Keys with expiration |
redis.db.avg_ttl | Average key TTL |
Troubleshooting#
- Integrations menu is missing: Ask an admin to grant your role Installation permissions in Settings.
- Agent can’t reach Redis: Test from the Agent host:
redis-cli -h <host> -p <port> PING(or add--tls --cacert <ca>for TLS). You should getPONG. Fix DNS/firewall/port or credentials if it fails. - Clustered/replicated setups show only one node: Add each node you want monitored (metrics are per instance/endpoint). You can sanity-check per node with
redis-cli INFOor sectioned calls likeINFO replication.
Need assistance or want to learn more about Middleware? Contact our support team at [email protected] or join our Slack channel.