Multistep Synthetic Monitoring
Multistep Synthetic Monitoring lets you chain several API steps into one monitor, so later steps can reuse data from earlier responses (e.g., take a product category from Step 1 and pass it into Step 2). This is ideal for simulating multi-call transactions and end-to-end flows.
Create a Multistep Monitor#
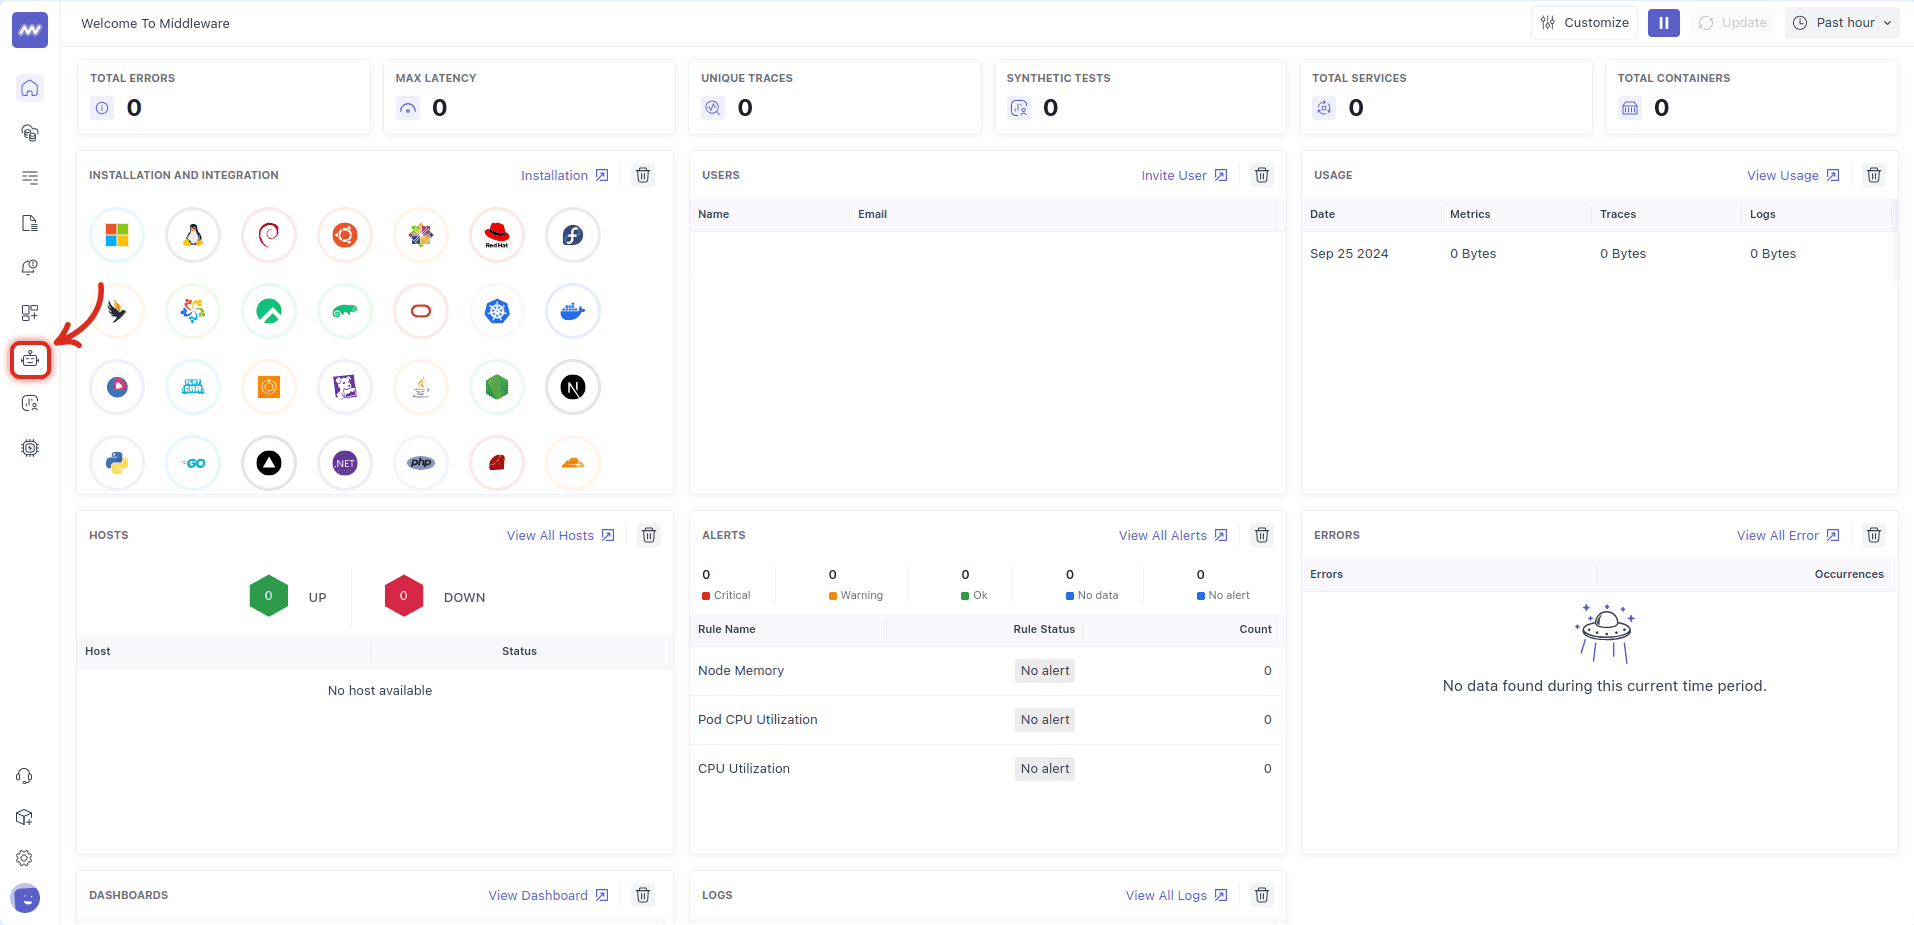
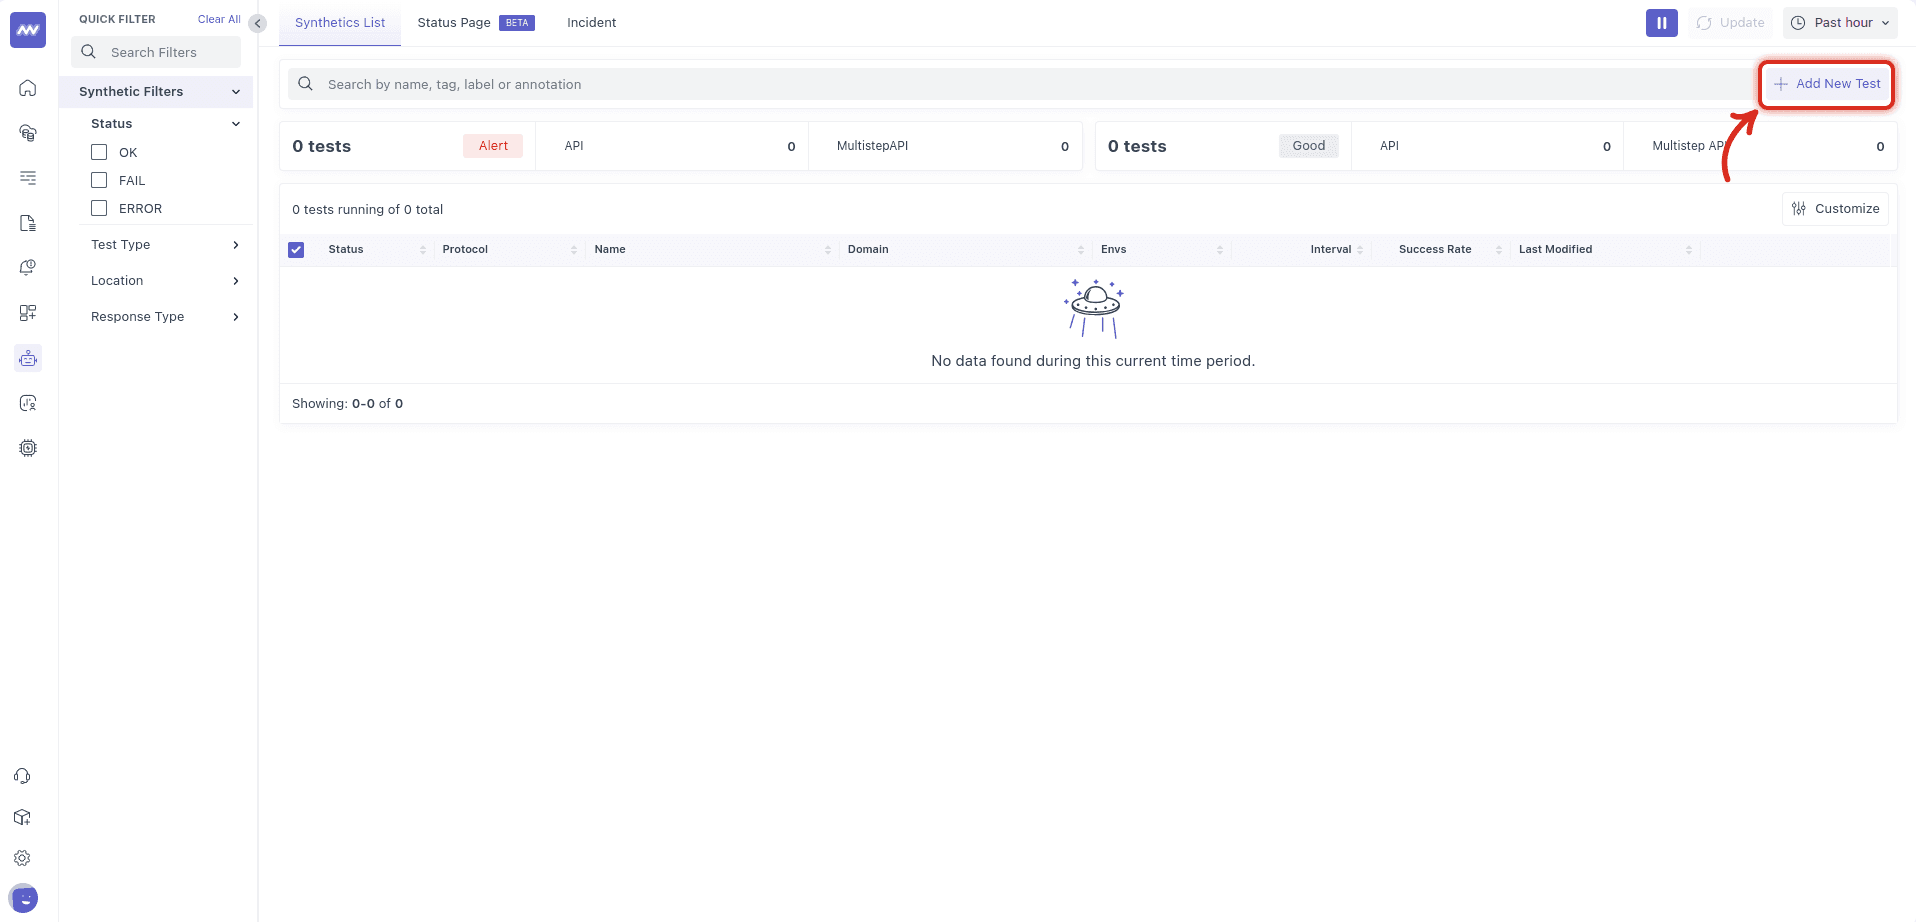
1. Open Synthetic Monitoring → Add New Test#
From the sidebar, open Synthetic Monitoring, then click Add New Test on the Synthetics List. This view also exposes filters for status, test type, location and response type, which helps later when you manage many monitors.
2. Choose Request Type#
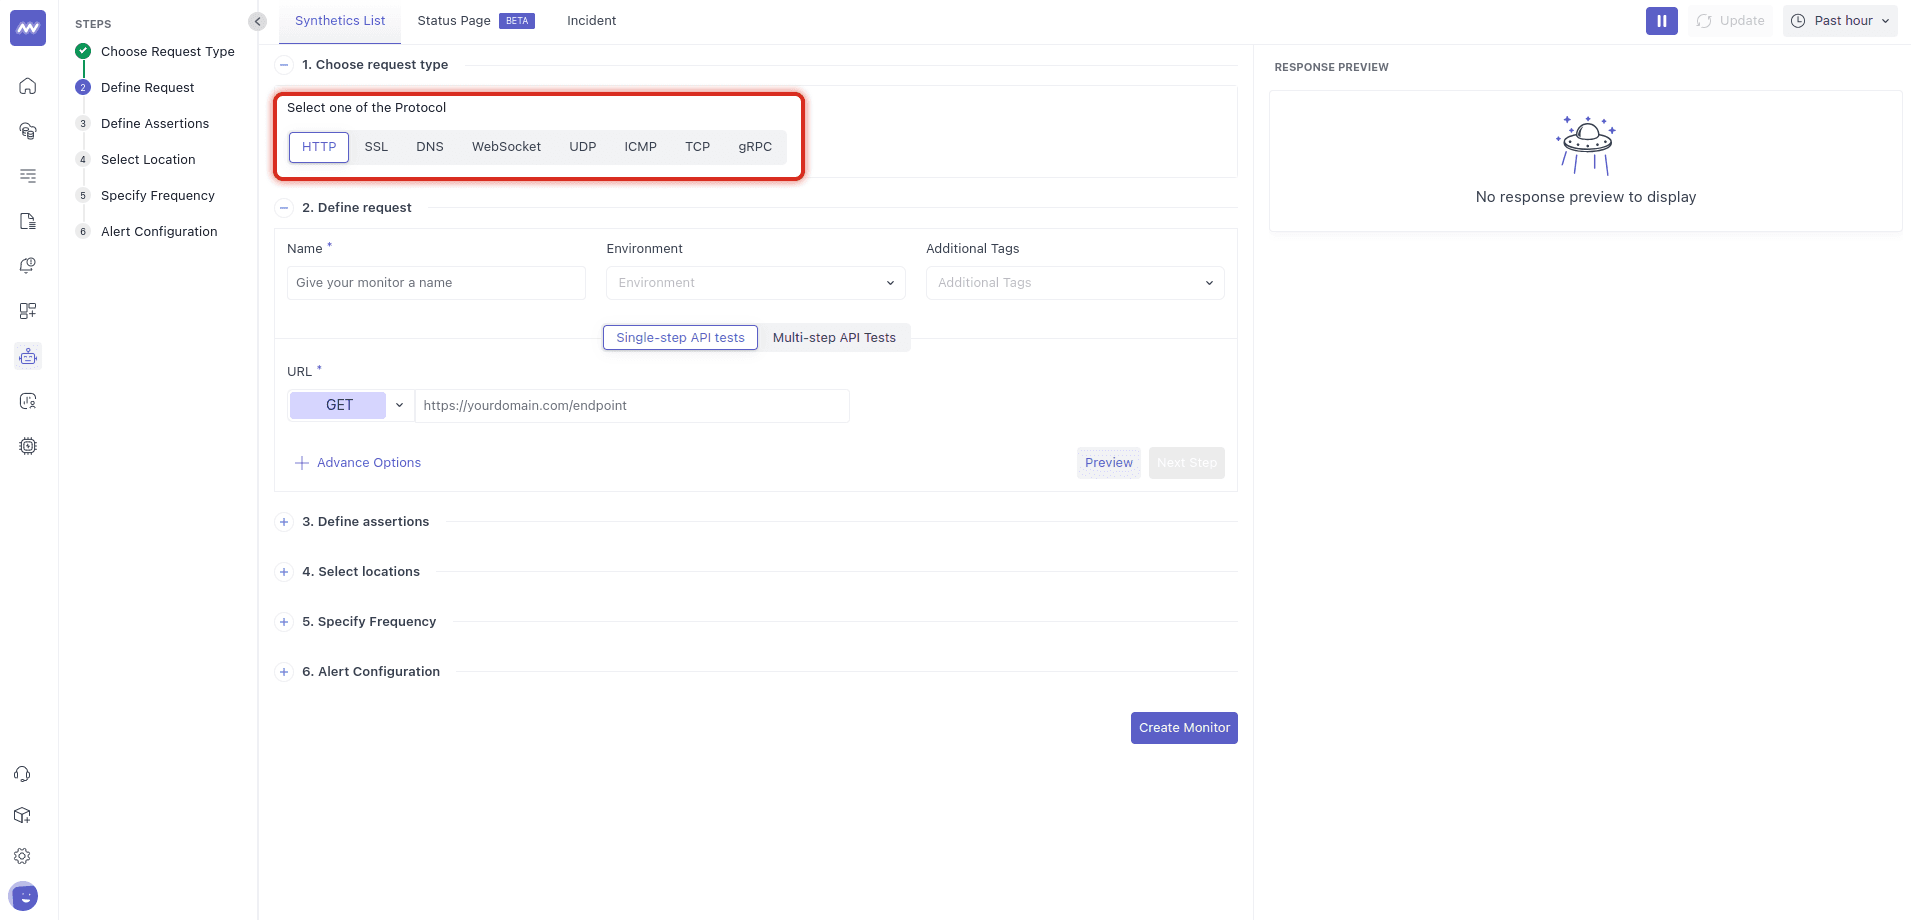
Select HTTP (you can also create monitors for SSL, DNS, WebSocket, UDP, ICMP, TCP, or gRPC). Multistep flows are built around HTTP in this guide.
3. Define the first step (Setup Monitor)#
Fill these fields in Define request:
- Name – a clear label (e.g.,
step-product). - Environment – tag the monitor by env.
- Additional tags – ownership/routing labels.
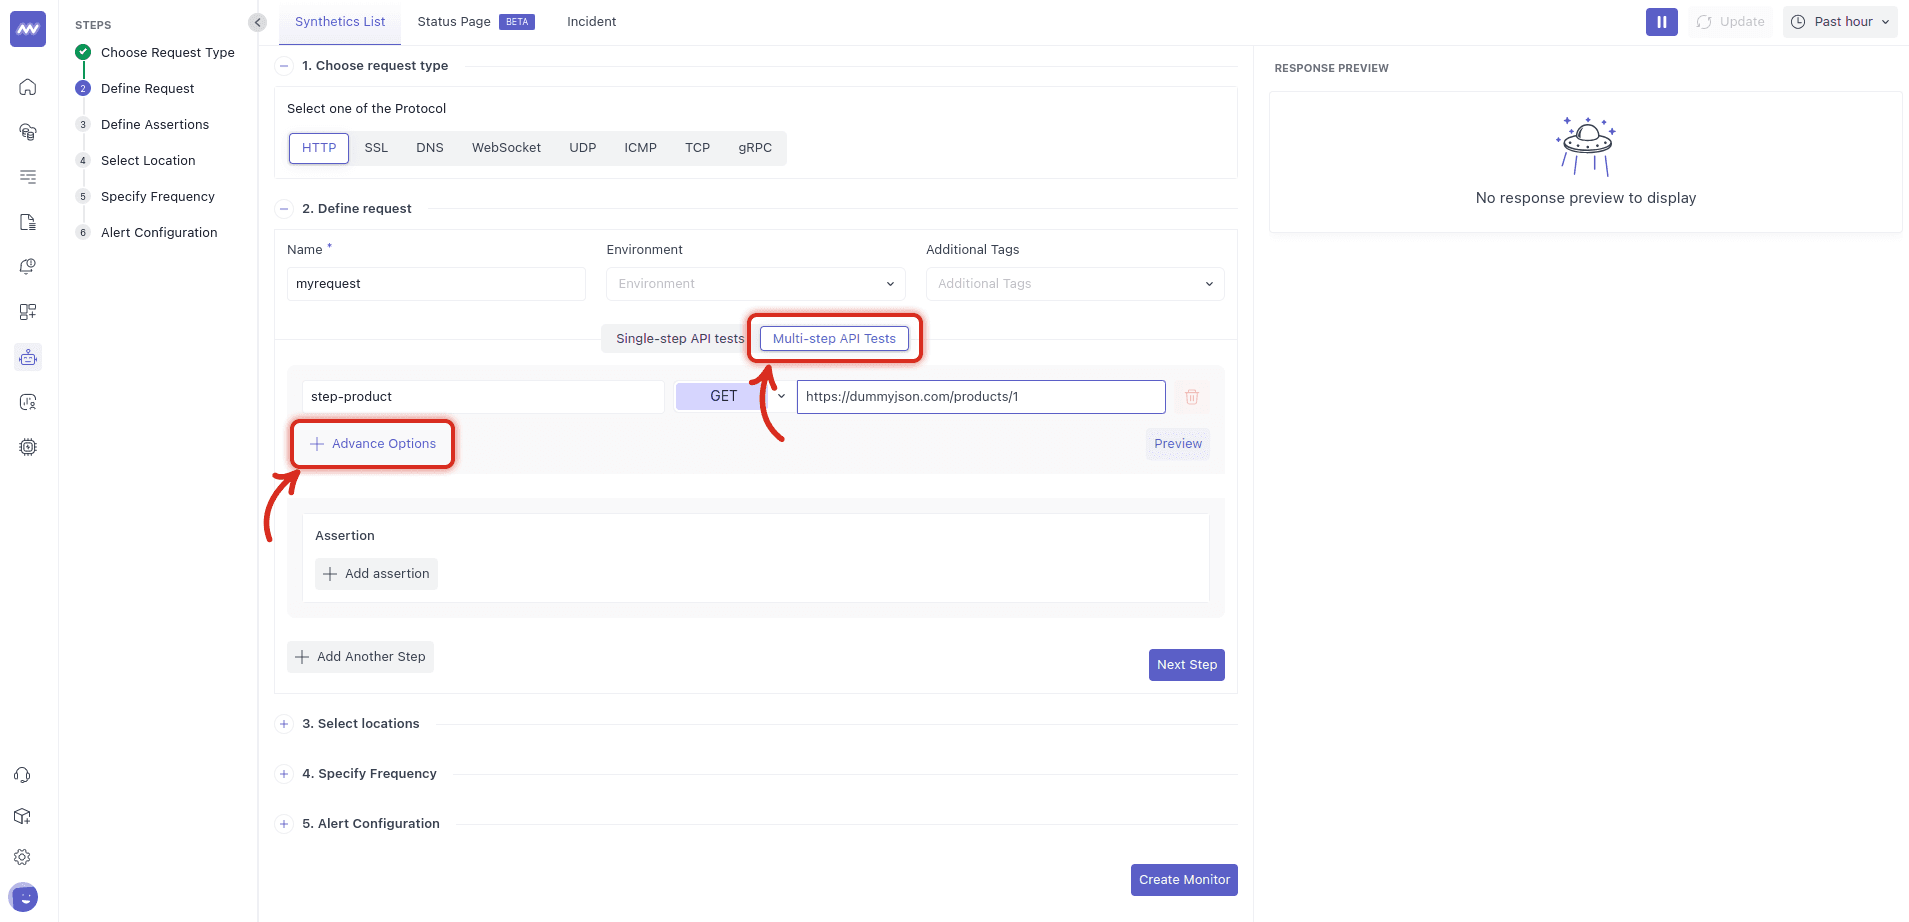
- Test Type – select Multi-step API Tests.
- HTTP method & URL – choose verb (GET/POST/DELETE…) and target URL.
- Advanced Options – open to configure HTTP and payload details (see below).
The UI shows the multistep option, a step label, and the URL/method entry point.
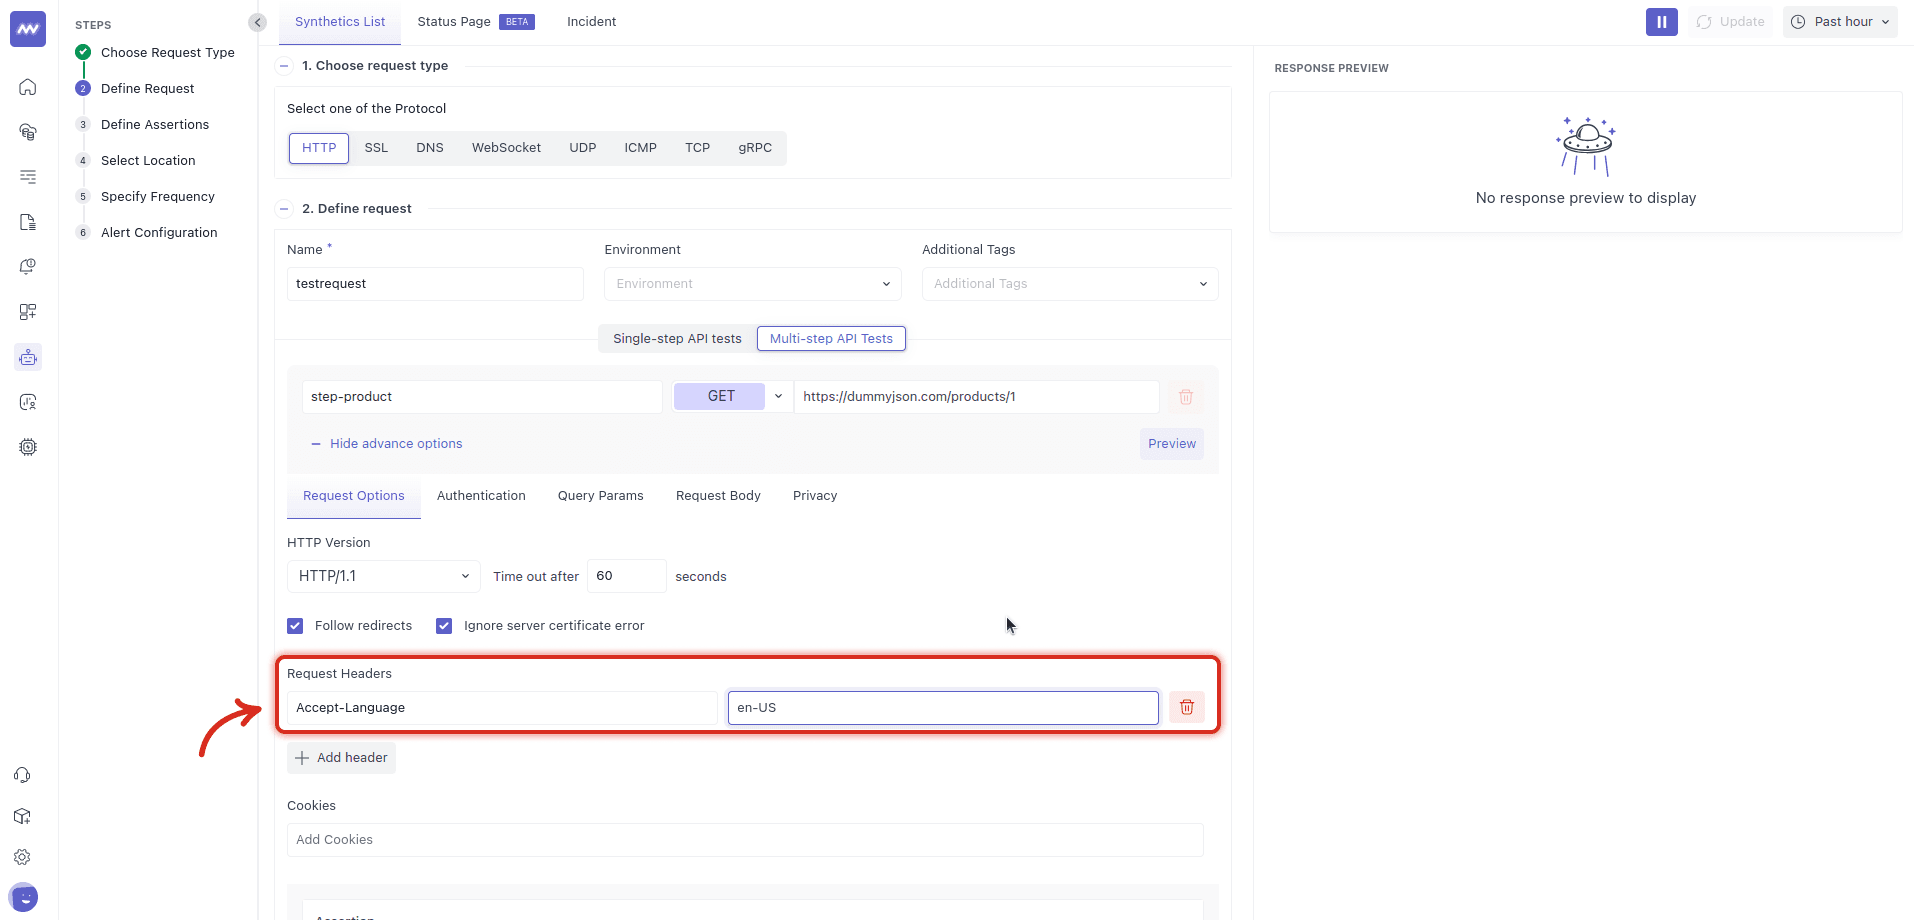
Advanced Options (what you can configure):
Under Advanced Options, you’ll find tabs for Request Options, Authentication, Query Params, Request Body, and Privacy. In Request Option, you can set HTTP version, timeout, whether to follow redirects, whether to ignore server certificate errors, plus add request headers and cookies (example header Accept-Language: en-US).
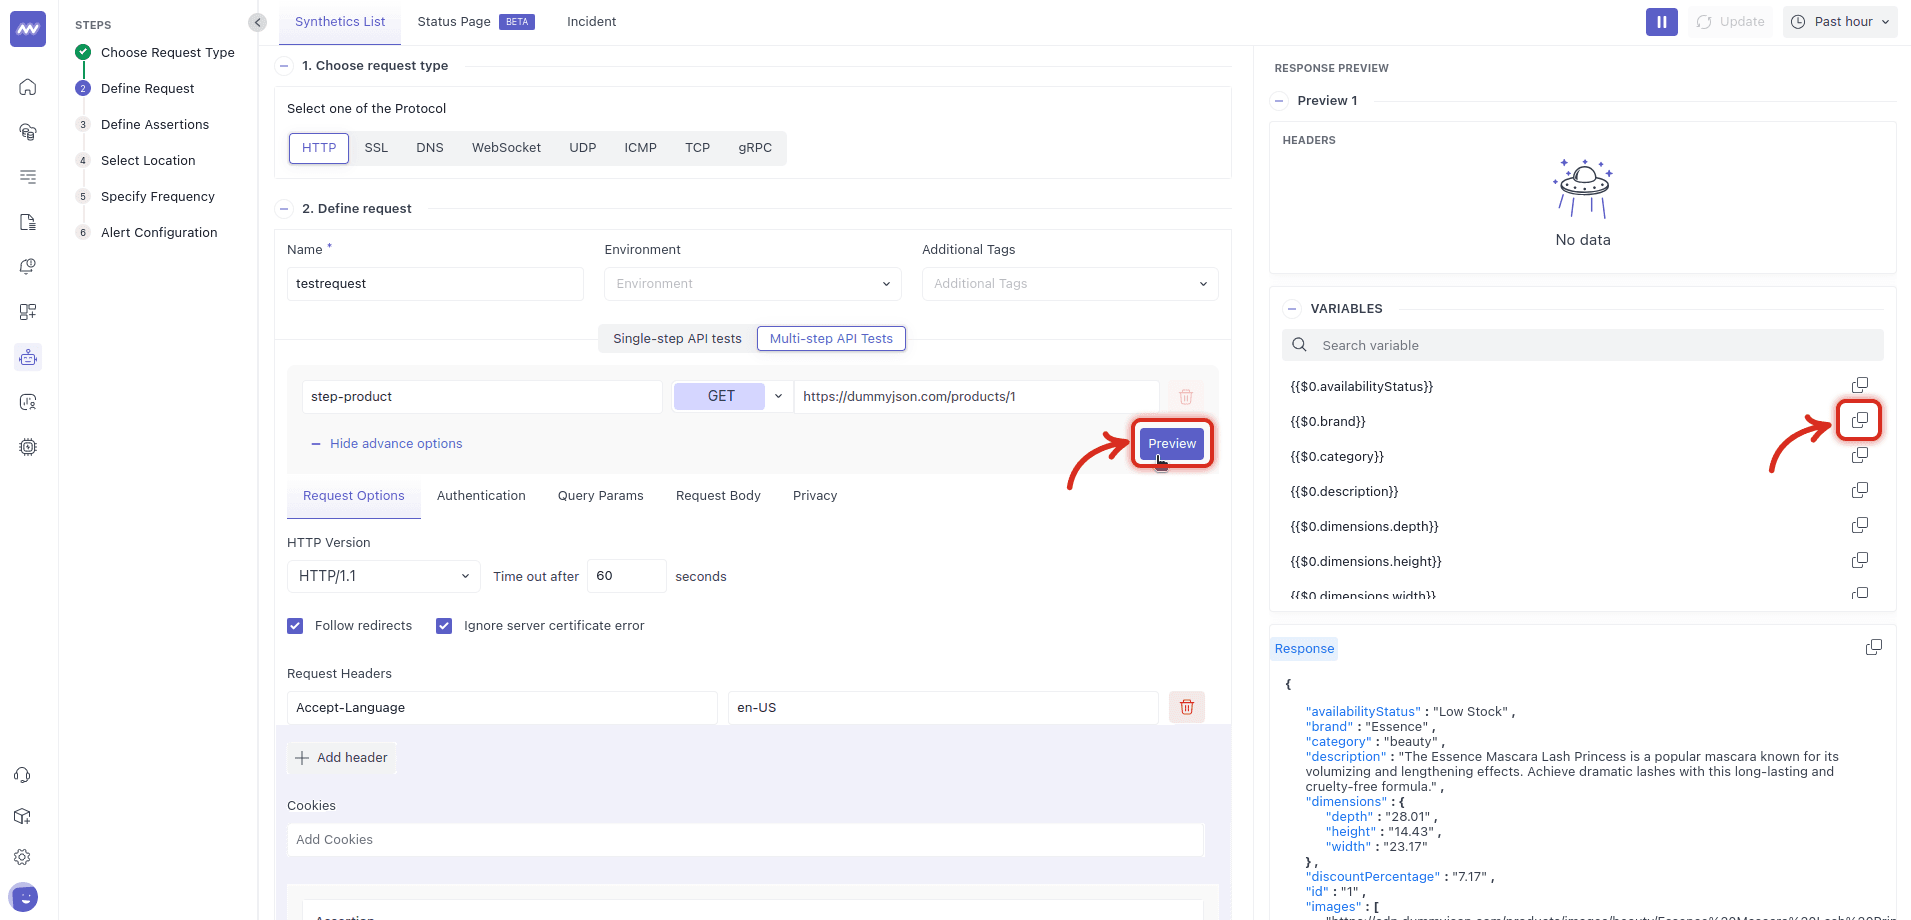
4. Preview and capture variables (this is the “glue”)#
Click Preview to issue the request. The right panel shows:
- Response (raw body)
- Headers
- VARIABLES – structured fields extracted for reuse across steps, each with a copy icon
Variables are named like {{$0.category}} where the number prefix is the step index (0 = first step). Copy what you need for later steps.
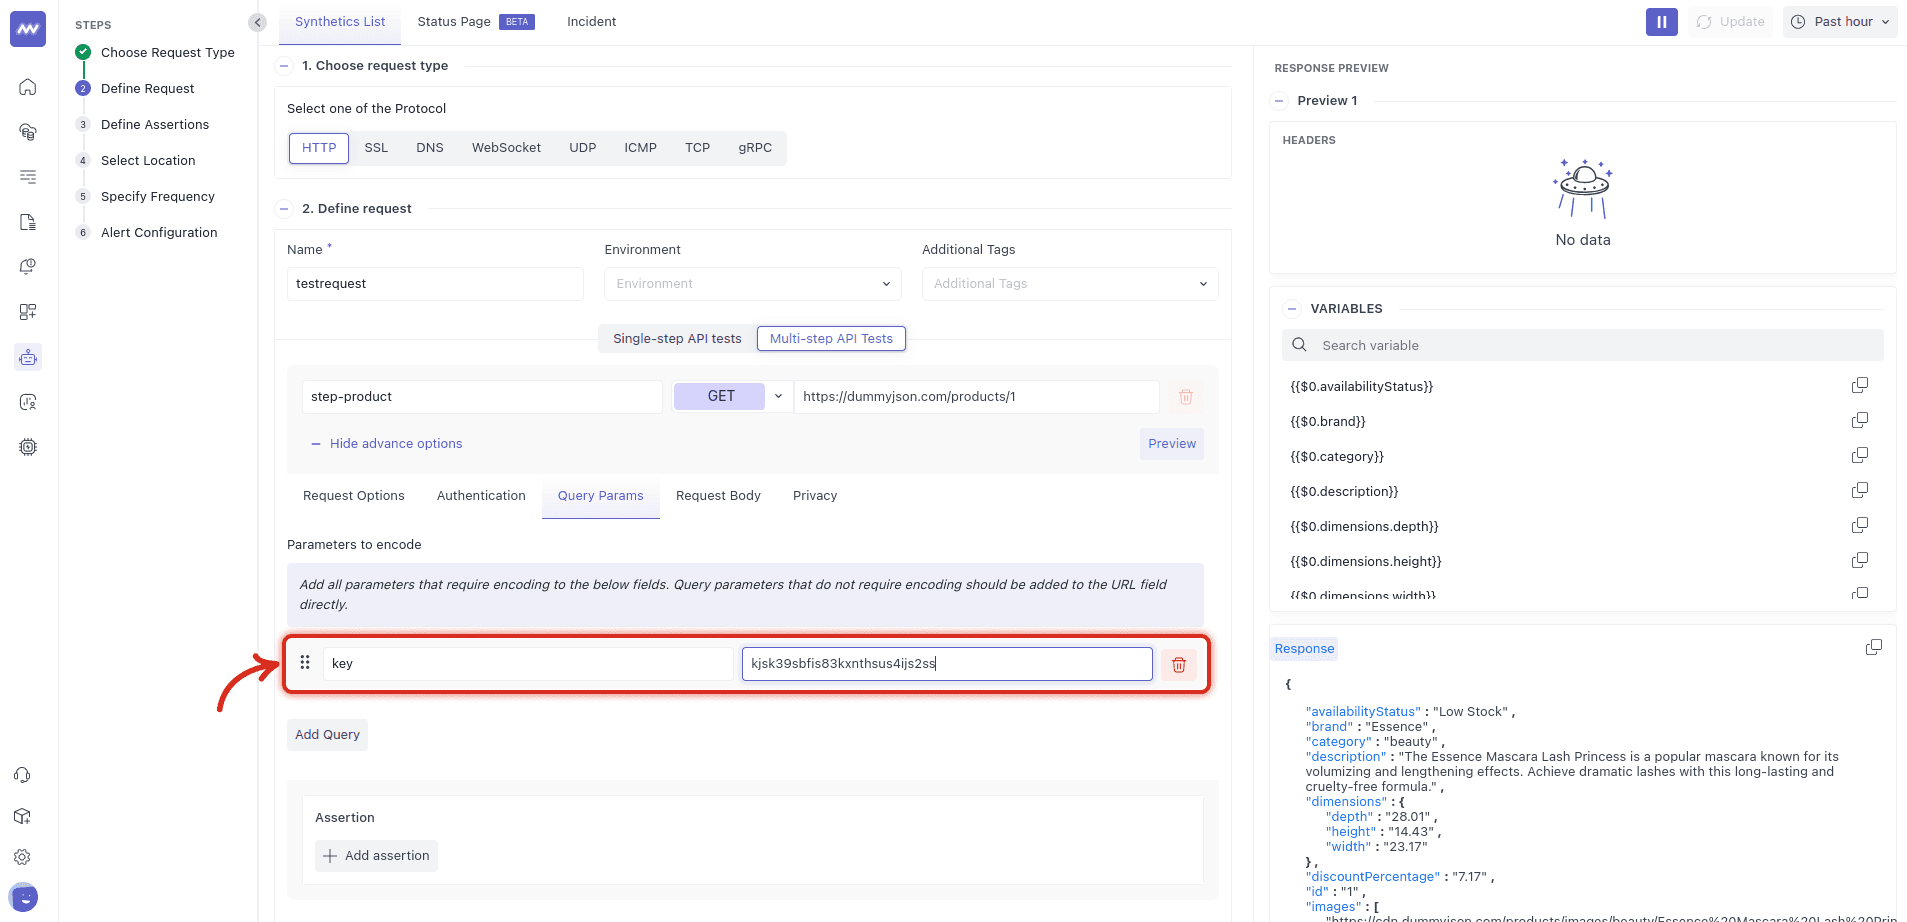
5. Add more steps and pass data forward#
Add a second step (e.g., step-search) and paste variables from Step 1 wherever you need them, such as URL path segments, Query Params, headers, or body.
- Go to Advanced Options → Query Params
- Name the parameter (e.g.,
category) - Paste the value from Request Preview (e.g.,
{{$0.category}})
This wires Step 2 to the output of Step 1.
6: Define assertions (applied to every step)#
Add rules like 'Status code is 200' or 'Response time < X'. Remember: all assertions run on every step in a multistep monitor, and keep them generic enough to fit each step’s response.
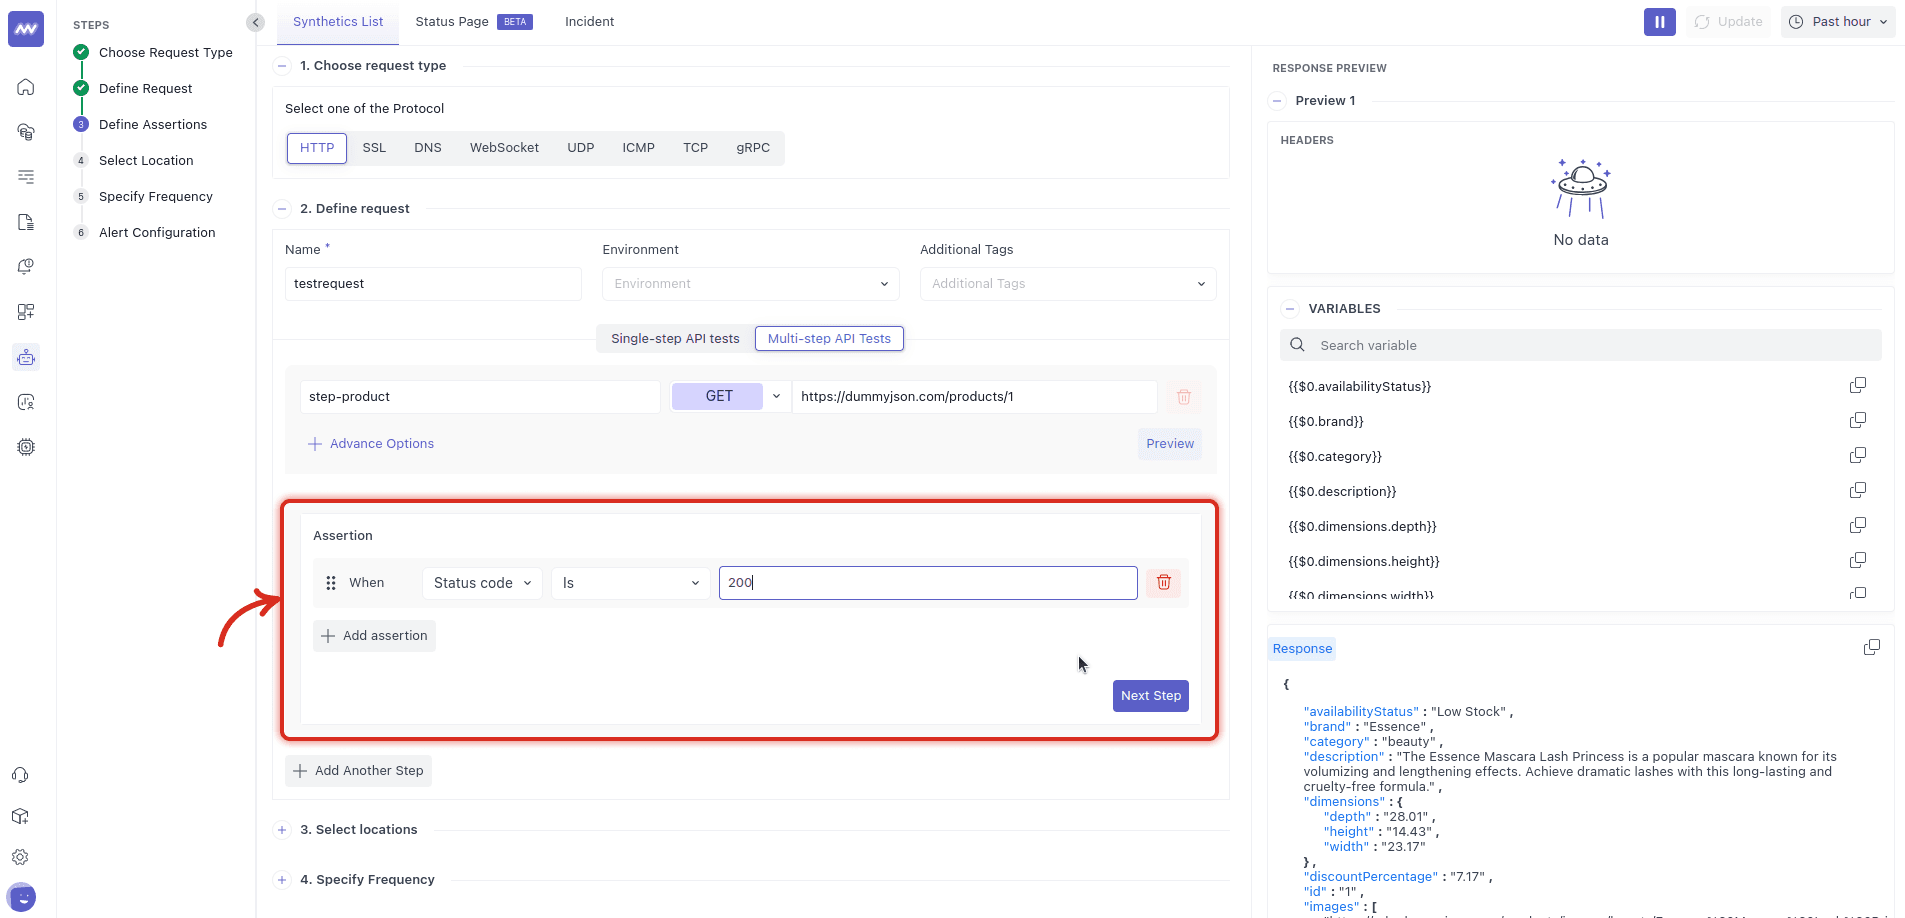
(The page reiterates this limitation.)
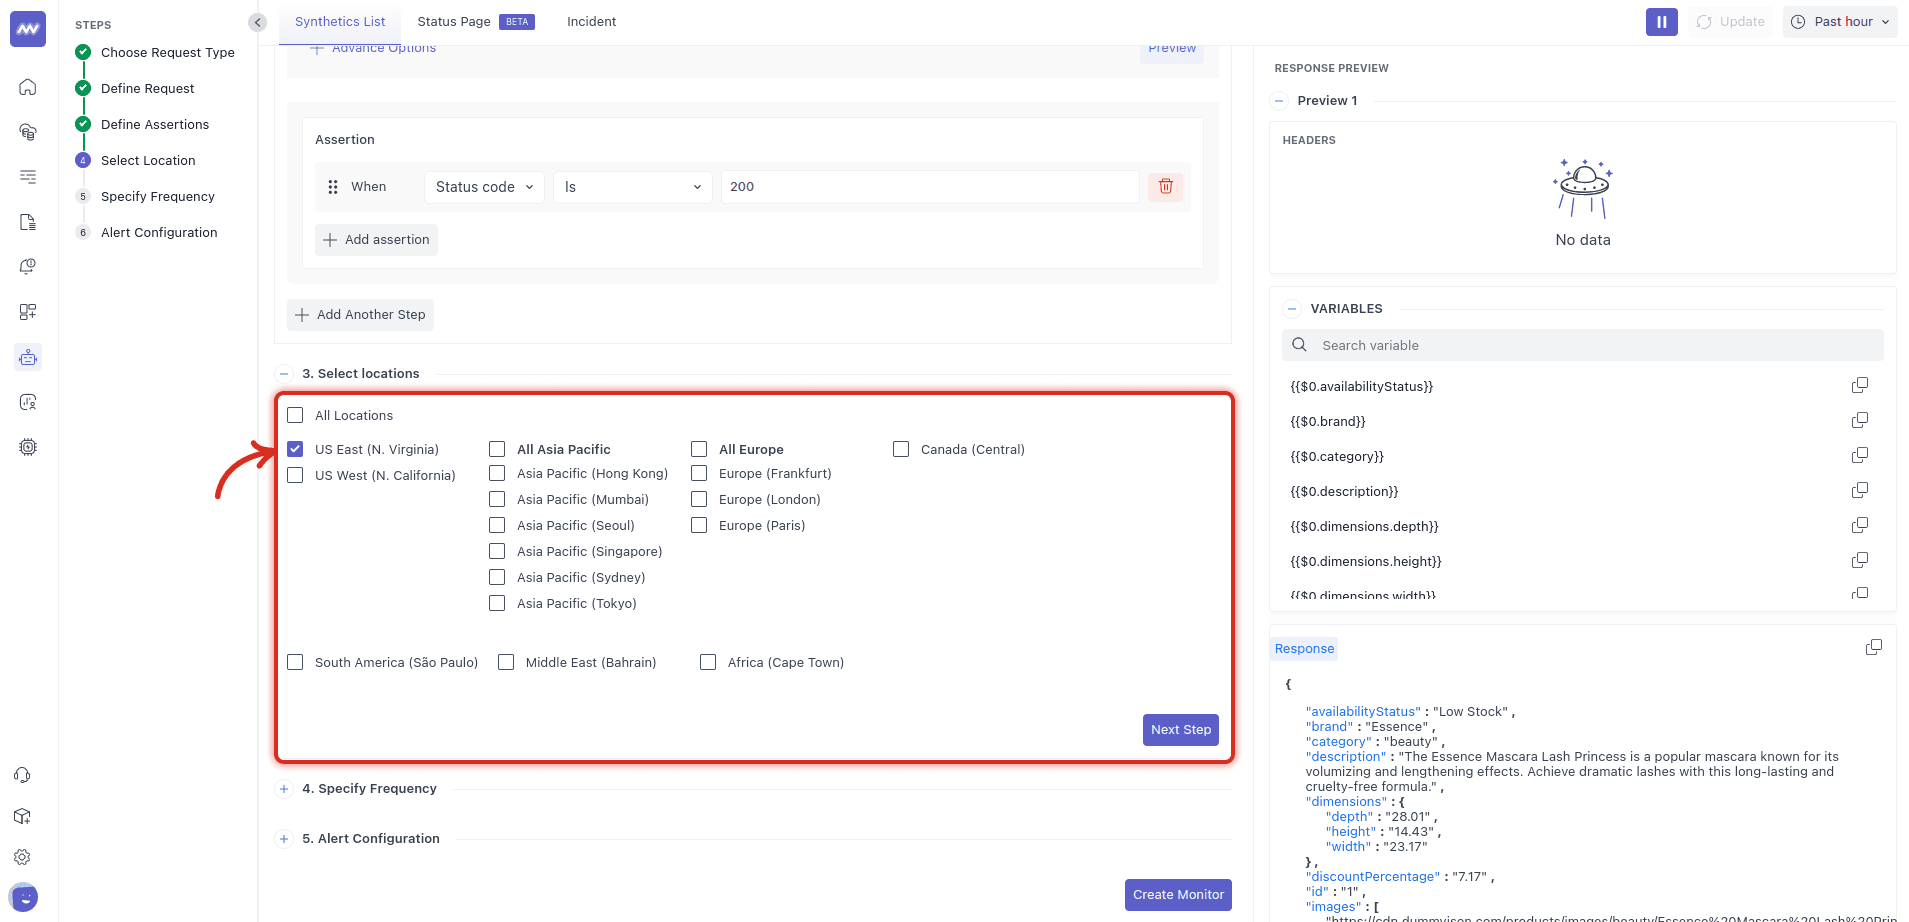
7. Select Locations#
Pick one or more regions (e.g., US East (N. Virginia), US West (N. California), Europe, APAC, etc.). Start with one region to validate, then expand to catch geo-specific issues (CDN, DNS, WAF).
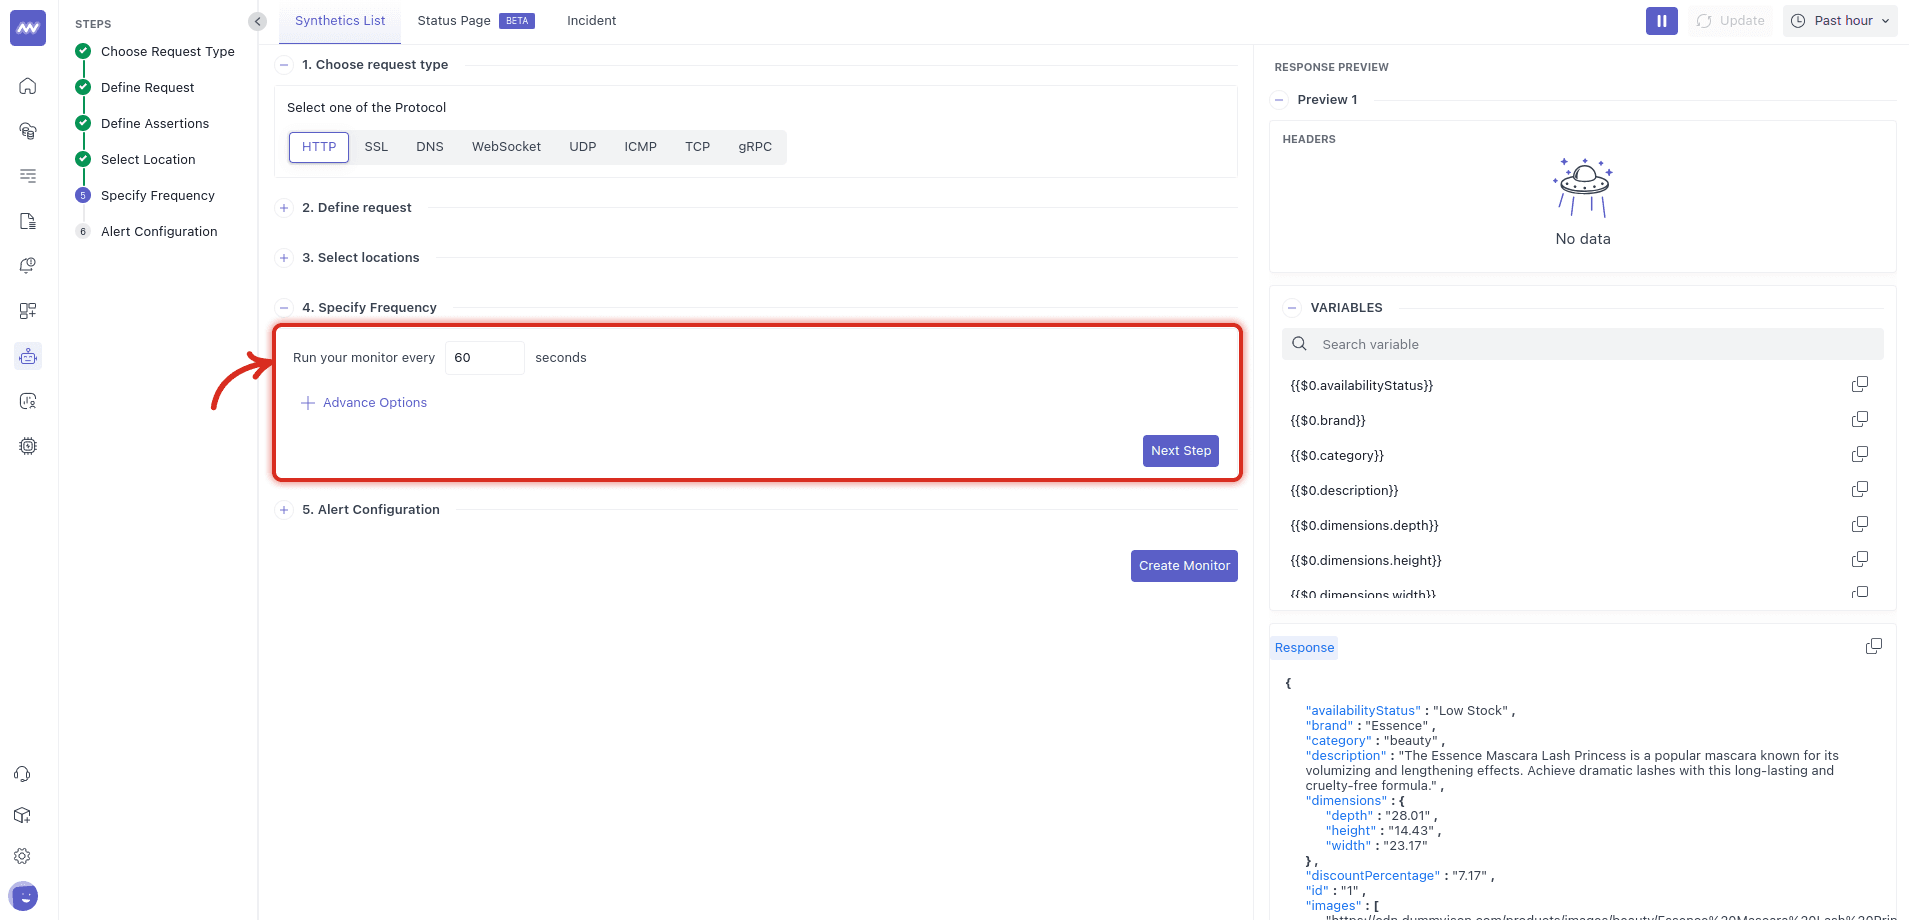
8. Set the Run Frequency#
Choose how often to run the monitor (the UI shows “Run your monitor every N seconds”).
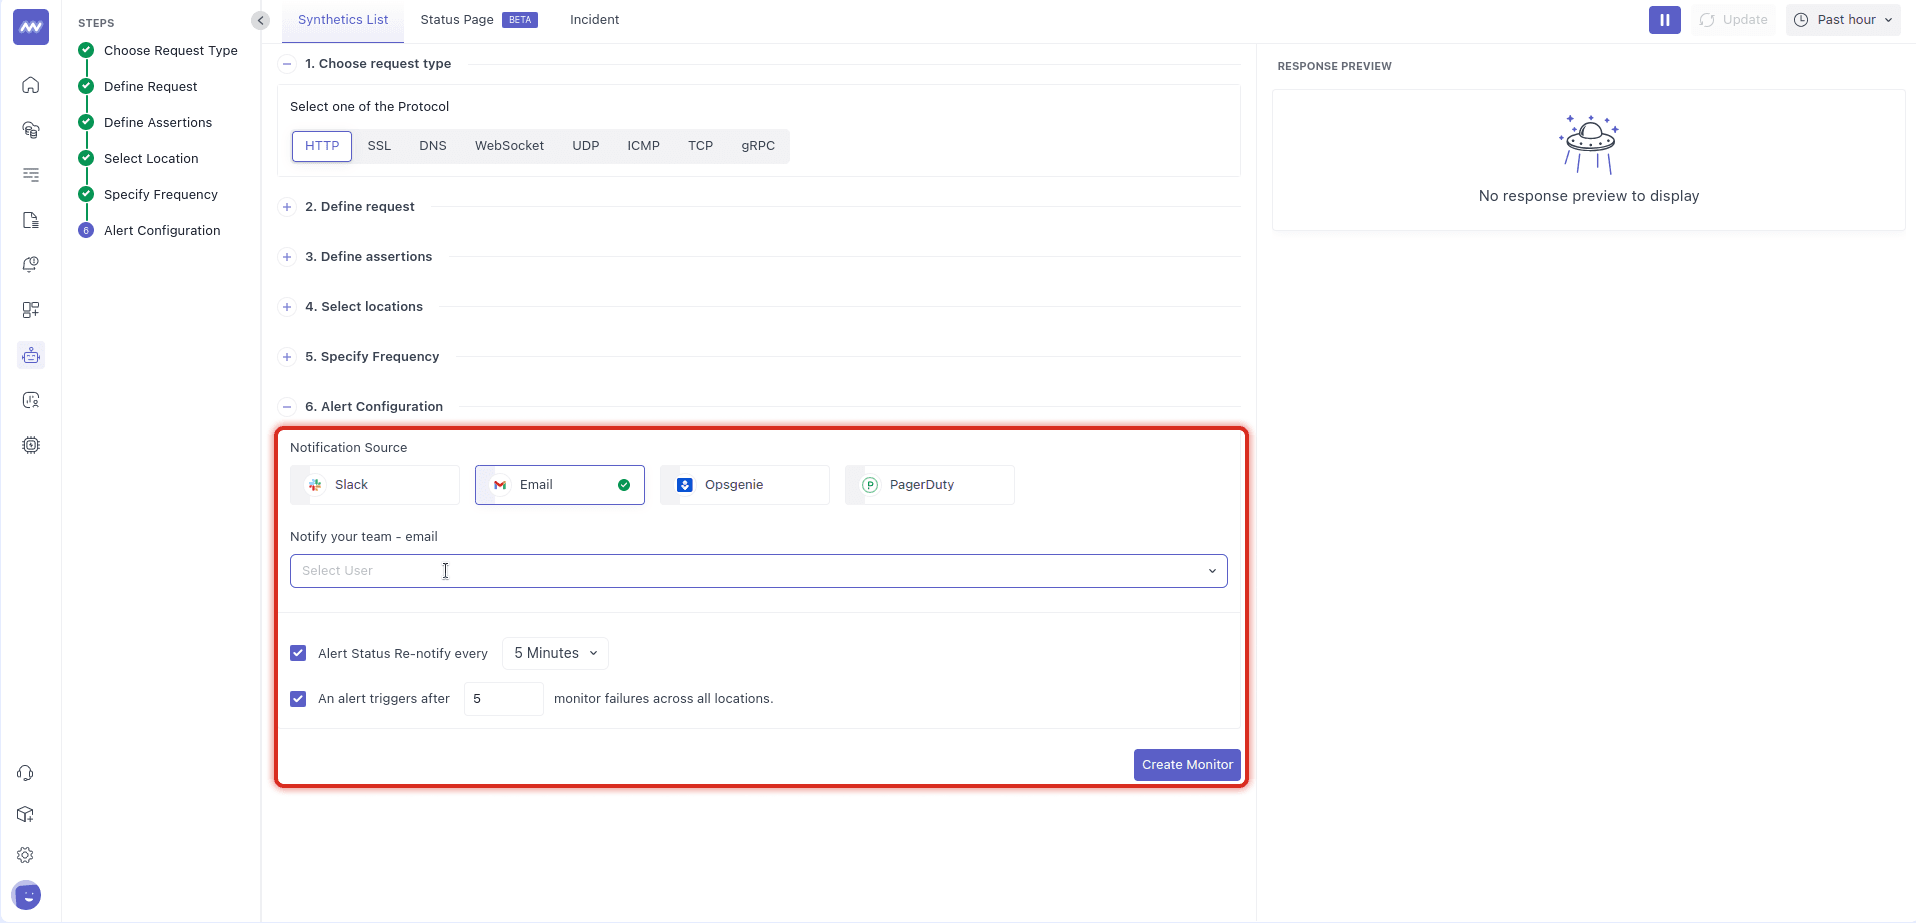
9. Configure Notifications#
Pick one or more Notification Sources (Email, Slack, Opsgenie, PagerDuty), select recipients/users, optionally re-notify on status, and set failure-count before triggering.
How Variable Passing Works#
- After you preview a step, the VARIABLES panel lists fields the monitor can reference later.
- Variables are referenced with the step index and field name, e.g.,
{{$0.category}}. - Paste these into URL, Query Params, Headers, or Request Body of subsequent steps to chain behavior.
- Because assertions are global in multistep today, design them to fit every step’s response.
Tips & Guardrails#
- Validate each step with Preview before adding the next; copy variables only after they appear in the VARIABLES panel.
- Make assertions portable (e.g., status/latency) since they’re applied to every step.
- Start with one location and moderate frequency, then scale up once stable (you can always add more regions and tighten thresholds).
Need assistance or want to learn more about Middleware? Contact our support team at [email protected] or join our Slack channel.