AWS RDS PostgreSQL Integration
AWS RDS for PostgreSQL monitoring is essential for tracking database performance, query behavior, and resource utilization in cloud environments. This guide explains how to set up AWS RDS PostgreSQL monitoring in Middleware using an EC2 host agent, enabling full observability into queries, metrics, and performance bottlenecks. The agent runs on an EC2 instance you control and connects to RDS over the network—not on the RDS instance itself.
Prerequisites#
- Middleware Host Agent on EC2: Install the Linux Host Agent on an EC2 instance that has network connectivity to your RDS endpoint. Follow Installing the Agent and the Linux Host Agent steps.
- Managed database: Do not attempt to install the Host Agent on RDS. RDS is a managed service; integration is always EC2 (agent) → AWS RDS for PostgreSQL using a credentials file on the EC2 host and the PostgreSQL integration in Middleware.
Retrieve connection details from AWS#
Gather the following before you configure Middleware:
- Endpoint and port: In the AWS console, open RDS → your DB instance → Connectivity & security. Copy the Endpoint (hostname) and Port (PostgreSQL is commonly
5432). - Database name: The initial database created with the instance, or another database you created in the cluster.
- Username and password: The master user you defined when creating the instance, or a dedicated monitoring user you create in SQL (see Step 2). Store passwords securely (for example in AWS Secrets Manager or your team’s vault); rotate them according to your policy.
Network connectivity#
- Inbound access controls: Allow the PostgreSQL port (typically TCP 5432) from your EC2 host network range (or equivalent trusted source) in your network access controls.
- Placement: The EC2 instance running the agent should live in subnets and route tables that can reach the RDS endpoint (same VPC is typical; cross-VPC requires peering or Transit Gateway and matching network access controls/routes).
- Verification: From the EC2 instance, test connectivity (for example with
psqlornc -zv <endpoint> <port>) before relying on the integration.
Setup#
1 Enable pg_stat_statements#
pg_stat_statements exposes per-statement stats that the integration relies on. On RDS you configure this with a DB parameter group, not by editing postgresql.conf on disk.
- In the AWS console, go to RDS → Parameter groups. Create a new parameter group (or modify a custom one) compatible with your engine version.
- Set parameters such as:
shared_preload_libraries— includepg_stat_statements(RDS may require a specific format for multiple libraries; follow AWS documentation for your engine version).pg_stat_statements.track=allpg_stat_statements.max=10000(or your chosen limit)track_io_timing=1
- Attach the parameter group to your DB instance and reboot the instance if AWS indicates a reboot is required for
shared_preload_librarieschanges to apply. - Connect to RDS (for example with
psqlfrom EC2 or a bastion) and run as a user with sufficient privileges (for example a user inrds_superuseror equivalent for your setup):
1CREATE EXTENSION IF NOT EXISTS pg_stat_statements;
2SELECT calls, query FROM pg_stat_statements LIMIT 1;
You should see a row once statements have executed (your values will differ):
1calls | query
2-------+-------------------------------
3     8 | SELECT * FROM t WHERE field = $1
2 (optional): Create a least-privileged user#
If you do not want to use the master user for monitoring, create a read-only user with minimal privileges. Run against the RDS endpoint (for example from the EC2 instance using psql):
1CREATE USER lpu WITH PASSWORD 'pass';Verify:
1\duGrant minimal access:
1-- allow connections to the database you'll monitor
2GRANT CONNECT ON DATABASE <your_db_name> TO lpu;
3
4-- permit reading statement stats
5GRANT SELECT ON pg_stat_statements TO lpu;
6
7-- permit reading global stats where needed
8GRANT pg_read_all_stats TO lpu;
Test with the lpu account:
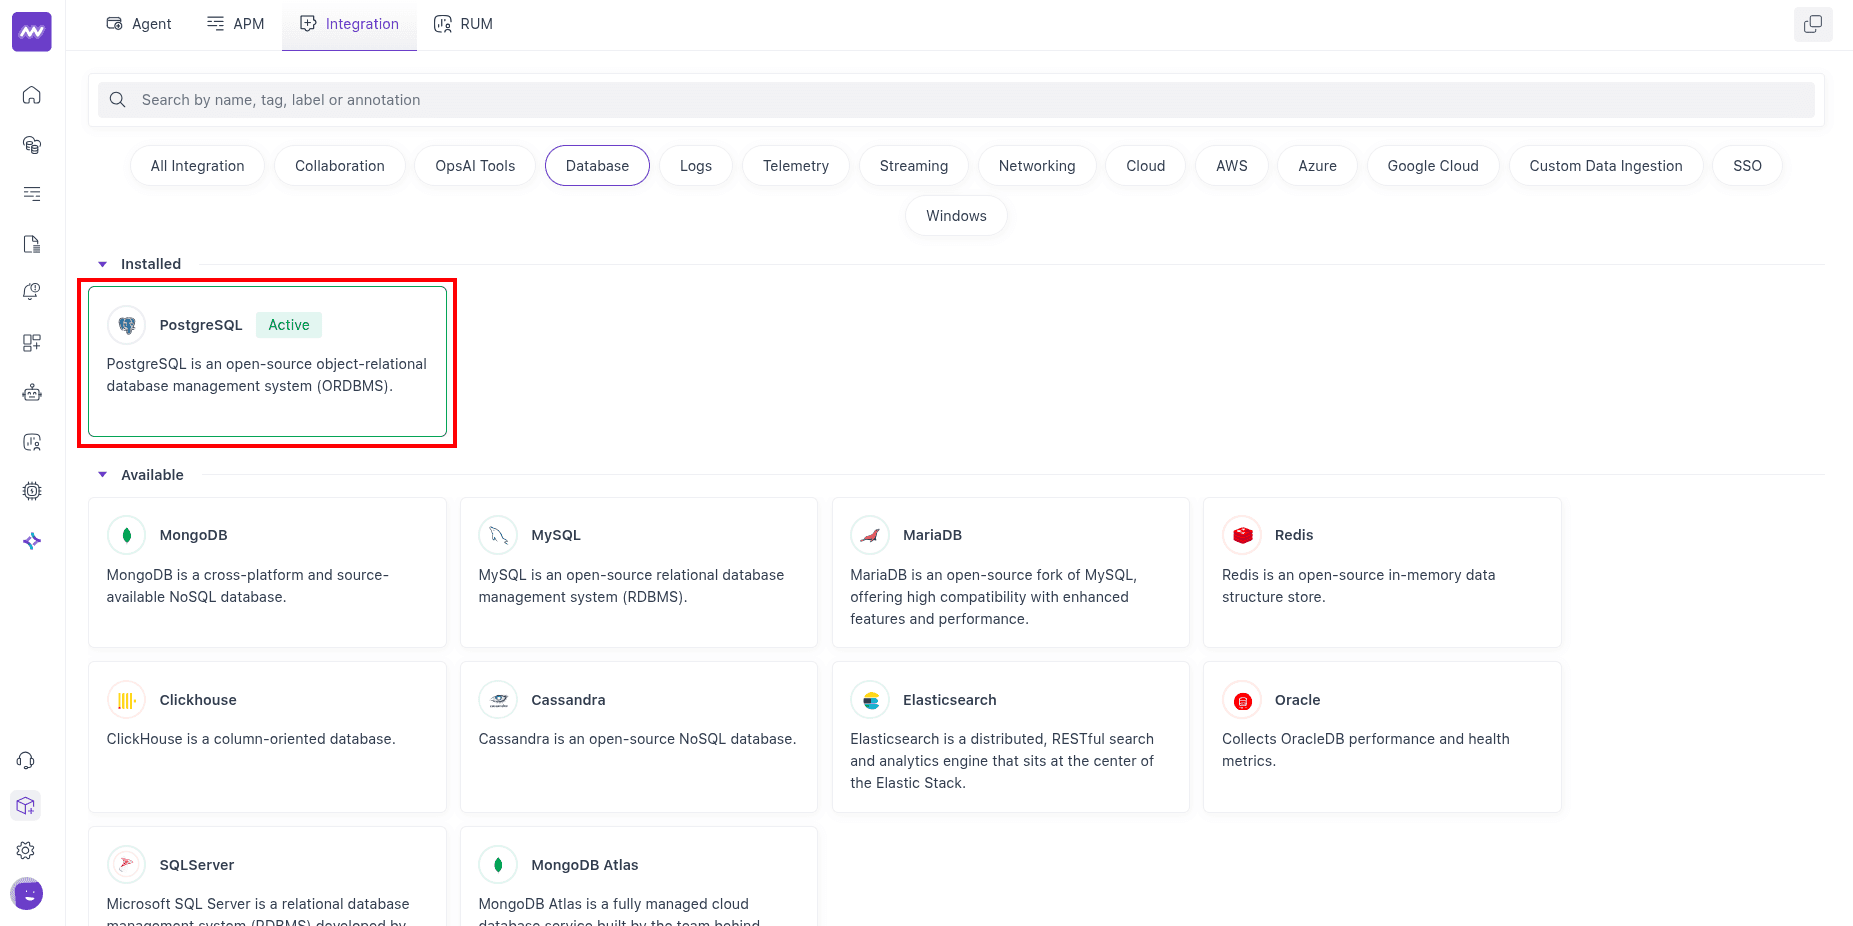
1SELECT calls, query FROM pg_stat_statements LIMIT 1;3 Open the integration in Middleware#
In Middleware, go to Installations → All Integrations → PostgreSQL.
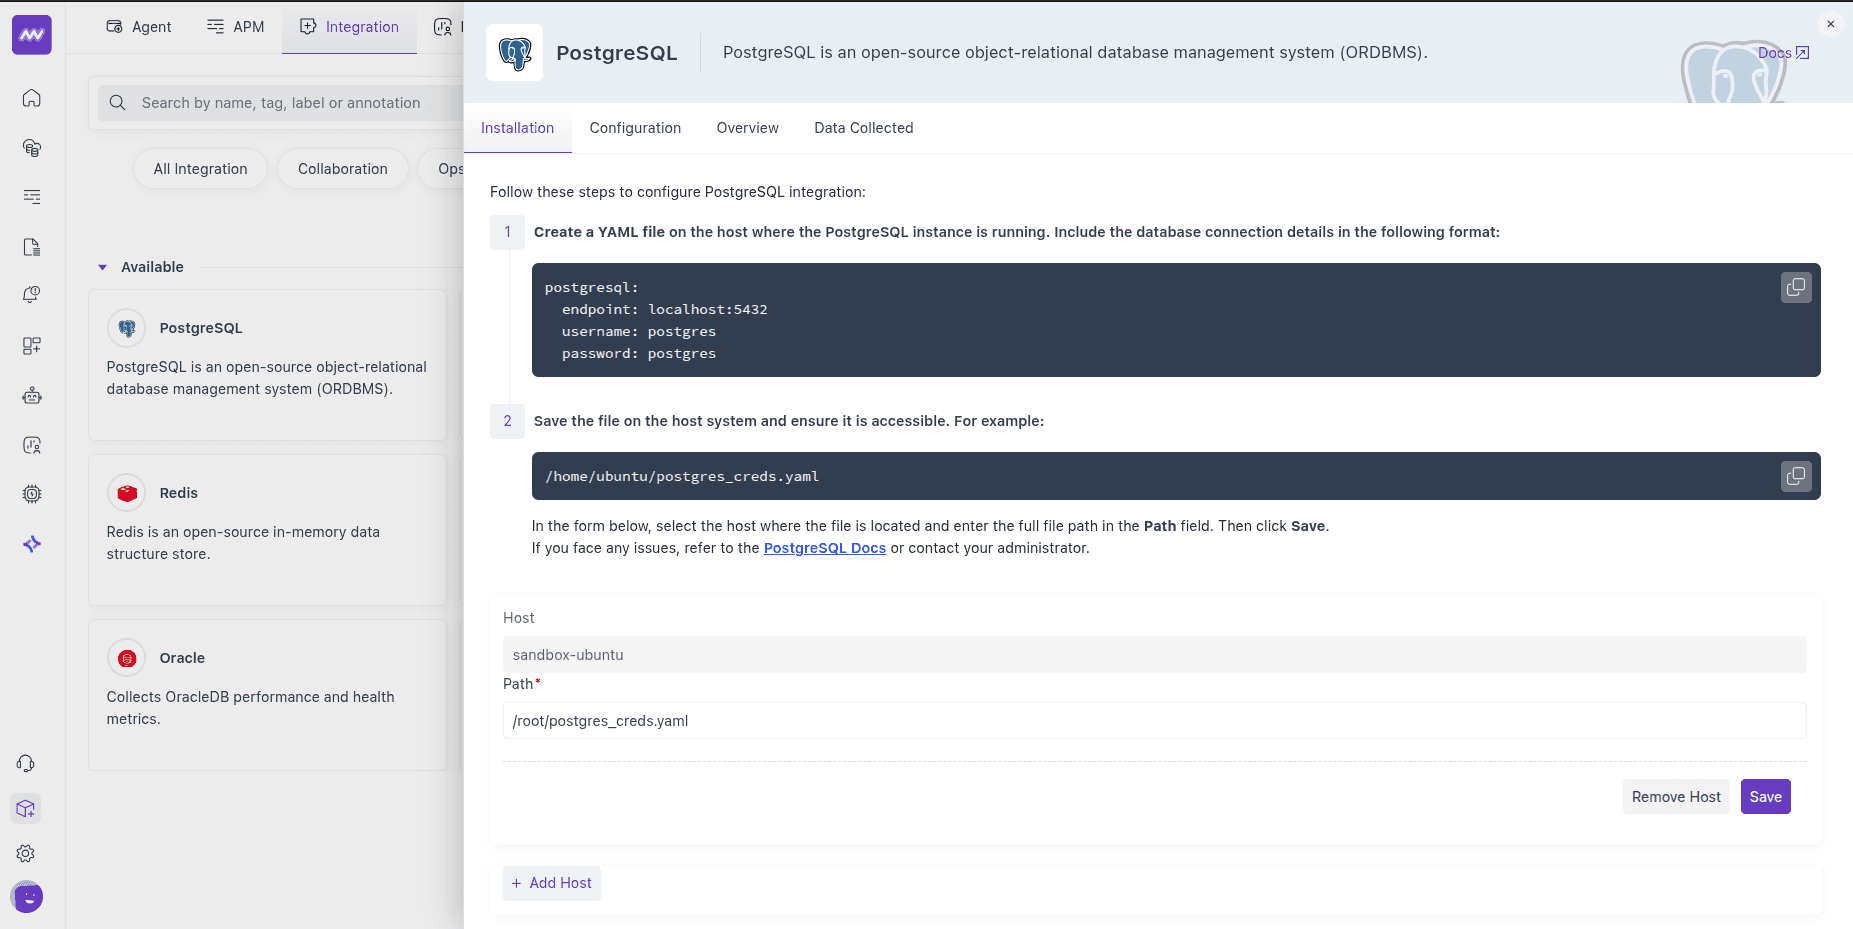
4 Fill the integration form#
In the PostgreSQL integration form:
- Select the EC2 host (from the dropdown) where the Middleware Host Agent runs.
- Enter the required connection details:
- Database name
- RDS endpoint
- Username
- Password
- (Optional) Query Collection:
- Query Sample Collection captures sampled query activity (query text, state, wait events, and client/application details) for troubleshooting.
- Top Query Collection captures aggregated high-impact query metrics (calls, rows, block I/O, and planning/execution timings) from
pg_stat_statements.
- (Optional) Schema Collection captures database schema and table metadata for schema visibility in Middleware.
- TLS Settings:
- If
Allow InsecureisfalseandSkip Certificate Verificationisfalse, provide the CA certificate file path. - For AWS RDS, download the CA bundle on the EC2 host and use that path in the form:
1curl -O https://truststore.pki.rds.amazonaws.com/global/global-bundle.pem
- If
5 Save and enable the integration#
- Click Save.
Once saved, the integration starts ingesting metrics from your RDS instance.
Visualise your Data#
Default PostgreSQL dashboard#
After setup, Middleware adds a PostgreSQL dashboard to the Dashboard Builder. Use it as a starting point to explore key DB metrics without building widgets from scratch.
Create custom widgets#
When adding a widget, choose data source postgresql to browse all exposed metrics and craft charts for your SLOs or run-book checks.
Alerts#
You can alert on any PostgreSQL metric. Create a rule using Database as the detection method and PostgreSQL as the database type; the Metrics dropdown then lists all available metrics for this integration. Configure conditions, thresholds, and recipients as usual.
Metrics Collected#
The following metrics are emitted when enabled in the PostgreSQL receiver (names and descriptions align with the integration’s metric definitions). RDS PostgreSQL uses the same metric set as self-hosted PostgreSQL.
Core Engine & Storage#
| Metric Name | Description |
|---|---|
postgresql.backends | The number of backends. |
postgresql.blocks_read | The number of blocks read (tagged by block read source). |
postgresql.buffer_hit | The number of disk block hits in the buffer cache, thereby avoiding database reads, tagged with database name. |
postgresql.db_size | The database disk usage. |
postgresql.database.count | Number of user databases. |
Tables, Indexes & Maintenance#
| Metric Name | Description |
|---|---|
postgresql.table.count | Number of user tables in a database. |
postgresql.table.size | Disk space used by a table. |
postgresql.table.vacuum.count | Number of times a table has manually been vacuumed. |
postgresql.table_bloat | Estimated table bloat ratio (actual pages / expected pages); 1.0 indicates no bloat. |
postgresql.analyzed | Number of times a table has been manually analyzed. |
postgresql.autoanalyzed | Number of times a table has been automatically analyzed. |
postgresql.autovacuumed | Number of times a table has been automatically vacuumed. |
postgresql.index.scans | The number of index scans on a table. |
postgresql.index.size | The size of the index on disk. |
postgresql.index.blocks_read | The number of disk blocks read by this index (tagged by source). |
postgresql.index.rows_read | The number of index entries returned by scans on this index. |
postgresql.index_bloat | Estimated index bloat ratio (actual pages / expected pages); 1.0 indicates no bloat. |
TOAST#
| Metric Name | Description |
|---|---|
postgresql.toast.blocks_hit | Number of TOAST block hits. |
postgresql.toast.index.blocks_read | Number of TOAST index block reads. |
postgresql.toast.size | Size of TOAST table. |
Transactions & Row Activity#
| Metric Name | Description |
|---|---|
postgresql.commits | The number of commits. |
postgresql.rollbacks | The number of rollbacks. |
postgresql.rows | The number of rows in the database (tagged by row state). |
postgresql.rows_deleted | Rows deleted by queries in this database, tagged with relation name. |
postgresql.rows_fetched | Rows fetched by queries in this database, tagged with relation name. |
postgresql.rows_inserted | Rows inserted by queries in the database, tagged with relation name. |
postgresql.rows_updated | Rows updated by queries in the database, tagged with relation name. |
postgresql.operations | The number of database row operations (tagged by operation: ins, upd, del, hot_upd). |
Checkpointing & Background Writer#
| Metric Name | Description |
|---|---|
postgresql.bgwriter.checkpoint.count | The number of checkpoints performed (tagged by checkpoint type). |
postgresql.bgwriter.duration | Total time spent writing and syncing files to disk by checkpoints (tagged by duration type). |
postgresql.bgwriter.maxwritten | Number of times the background writer stopped a cleaning scan because it had written too many buffers. |
postgresql.bgwriter.buffers.writes | Number of buffers written (tagged by buffer source). |
postgresql.bgwriter.buffers.allocated | Number of buffers allocated. |
Connections & Limits#
| Metric Name | Description |
|---|---|
postgresql.connection.count | The number of active connections to this database; when DBM is enabled, tagged with state, application name, database, and user. |
postgresql.connection.max | Configured maximum number of client connections allowed. |
Statement-level (via pg_stat_statements)#
| Metric Name | Description |
|---|---|
postgresql.query.count | Number of times the statement was executed (tagged with query_text, query_id). |
postgresql.query.total_exec_time | Total wait time of the normalised timed events (nanoseconds; tagged with query_text, query_id). |
Replication & WAL#
| Metric Name | Description |
|---|---|
postgresql.replication.data_delay | The amount of data delayed in replication (tagged with replication client). |
postgresql.wal.age | Age of the oldest WAL file (requires WAL with at least one replica). |
postgresql.wal.count | Number of WAL files. |
postgresql.wal.lag | Time between flushing recent WAL locally and receiving notification that the standby completed an operation (tagged by operation and replication client; requires WAL with at least one replica). |
postgresql.wal.size | Total size of WAL files. |
Live Row Estimates#
| Metric Name | Description |
|---|---|
postgresql.live_rows | The approximate number of live rows, tagged with relation name. |
Active Transaction Duration#
| Metric Name | Description |
|---|---|
postgresql.transactions.duration.max | Max duration of active transactions. |
postgresql.transactions.duration.sum | Sum of duration of active transactions. |
Troubleshooting#
“Integrations” menu not visible
If you do not see Integrations in Middleware, your account probably lacks Installation permissions. Ask an admin to add Installation to your role in Settings.
No metrics or connection failures
- Confirm outbound access from EC2 to RDS and inbound PostgreSQL access on RDS from the EC2 network path (or correct CIDR).
- Confirm the credentials file uses the RDS endpoint and port reachable from EC2.
- Verify
pg_stat_statementsis enabled and the database user has the grants from Step 2.
Need assistance or want to learn more about Middleware? Contact our support team at [email protected] or join our Slack channel.