Custom Metrics (API)
Collect any business or platform signal as custom metrics and visualise it alongside your Host/Kubernetes/Service telemetry in Middleware.
You can send metrics in two ways:
- HTTP (OTLP/JSON): Simple
curl/scripted pushes to/v1/metrics - OpenTelemetry SDKs: Instrument your app and export to Middleware over OTLP
Option A: Send custom data with cURL (OTLP/JSON)#
POST your payload to OTLP Metrics HTTP endpoint:
1curl -X POST "https://<MW_UID>.middleware.io:443/v1/metrics" \
2  -H "Accept: application/json" \
3  -H "Content-Type: application/json" \
4  -H "Authorization: <MW_API_KEY>" \
5  -d @- << 'EOF'
6{
7  "resource_metrics": [
8    {
9      "resource": {
10        "attributes": [
11          { "key": "mw.resource_type", "value": { "string_value": "custom" } },
12          { "key": "service.name", "value": { "string_value": "custom-metrics-pusher" } }
13        ]
14      },
15      "scope_metrics": [
16        {
17          "metrics": [
18            {
19              "name": "swap-usage",
20              "description": "SWAP usage",
21              "unit": "By",
22              "gauge": {
23                "data_points": [
24                  {
25                    "attributes": [
26                      { "key": "device", "value": { "string_value": "nvme0n1p4" } }
27                    ],
28                    "time_unix_nano": 1759743015000000000,
29                    "asInt": 4000500678
30                  }
31                ]
32              }
33            }
34          ]
35        }
36      ]
37    }
38  ]
39}
40EOF
Notes:
- Use
asIntfor integer values orasDoublefor floating-point values. time_unix_nanois the event timestamp; if omitted, the backend may use its receive time.- You can send multiple metrics in the same batch; add them to the
metricsarray. - To attach the metric to an existing resource (host/pod/service/etc.), add the required resource attribute(s) (see tables below).
Option B: Send custom metrics via OpenTelemetry#
If you want to send custom metrics via your codebase, you need to install the OpenTelemetry Python SDK:
1pip install opentelemetry-api opentelemetry-sdk opentelemetry-exporter-otlpYou can use the template codebase given below to send custom metrics:
1import time
2from opentelemetry import metrics
3from opentelemetry.sdk.metrics import MeterProvider
4from opentelemetry.sdk.resources import Resource
5from opentelemetry.sdk.metrics.export import PeriodicExportingMetricReader
6from opentelemetry.exporter.otlp.proto.grpc.metric_exporter import OTLPMetricExporter
7
8# Configure OTLP exporter for Middleware
9exporter = OTLPMetricExporter(
10    endpoint="https://ruplp.middleware.io",  # no /v1/metrics for gRPC
11    headers={"authorization": "<MW_API_KEY>"},
12)
13
14# Attach resource attributes (choose one of the options shown in the tables below)
15resource = Resource.create({
16    "mw.resource_type": "custom",
17    "service.name": "custom-metrics-pusher"
18})
19
20metric_reader = PeriodicExportingMetricReader(exporter)
21provider = MeterProvider(resource=resource, metric_readers=[metric_reader])
22metrics.set_meter_provider(provider)
23
24meter = metrics.get_meter(__name__)
25
26counter = meter.create_counter(
27    name="custom_counter",
28    description="Counts something custom",
29    unit="1",
30)
31
32histogram = meter.create_histogram(
33    name="custom_histogram",
34    description="Records histogram data",
35    unit="ms",
36)
37
38while True:
39    counter.add(1, attributes={"environment": "production", "region": "us-east-1"})
40    histogram.record(100, attributes={"operation": "database_query"})
41    time.sleep(5)
For other languages (Node.js/Go/Java, etc.), configure the OTLP/gRPC or OTLP/HTTP exporter and set the same endpoint and authorization header.
Ingest into existing Middleware resource types#
Attach the required resource attribute so the metric lands in the correct dataset:
| Type | Required resource attributes | Data set stored in |
|---|---|---|
host | host.id | Host Metrics |
k8s.node | k8s.node.uid | K8s Node Metrics |
k8s.pod | k8s.pod.uid | K8s Pod Metrics |
k8s.deployment | k8s.deployment.uid | K8s Deployment Metrics |
k8s.daemonset | k8s.daemonset.uid | K8s DaemonSet Metrics |
k8s.replicaset | k8s.replicaset.uid | K8s ReplicaSet Metrics |
k8s.statefulset | k8s.statefulset.uid | K8s StatefulSet Metrics |
k8s.namespace | k8s.namespace.uid | K8s Namespace Metrics |
service | service.name | Service Metrics |
os | os.type | OS Metrics |
Example (host):
Add to the resource.attributes:
1{ "key": "host.id", "value": { "string_value": "ip-10-0-0-12" } }Ingest pure custom data (no existing type)#
If your metric doesn’t belong to an existing resource, set:
1{ "key": "mw.resource_type", "value": { "string_value": "custom" } }These metrics appear under the Custom Metrics dataset in the UI and can be charted, alerted, and filtered using any attributes you attach.
Verify Delivery#
- Send a test data point.
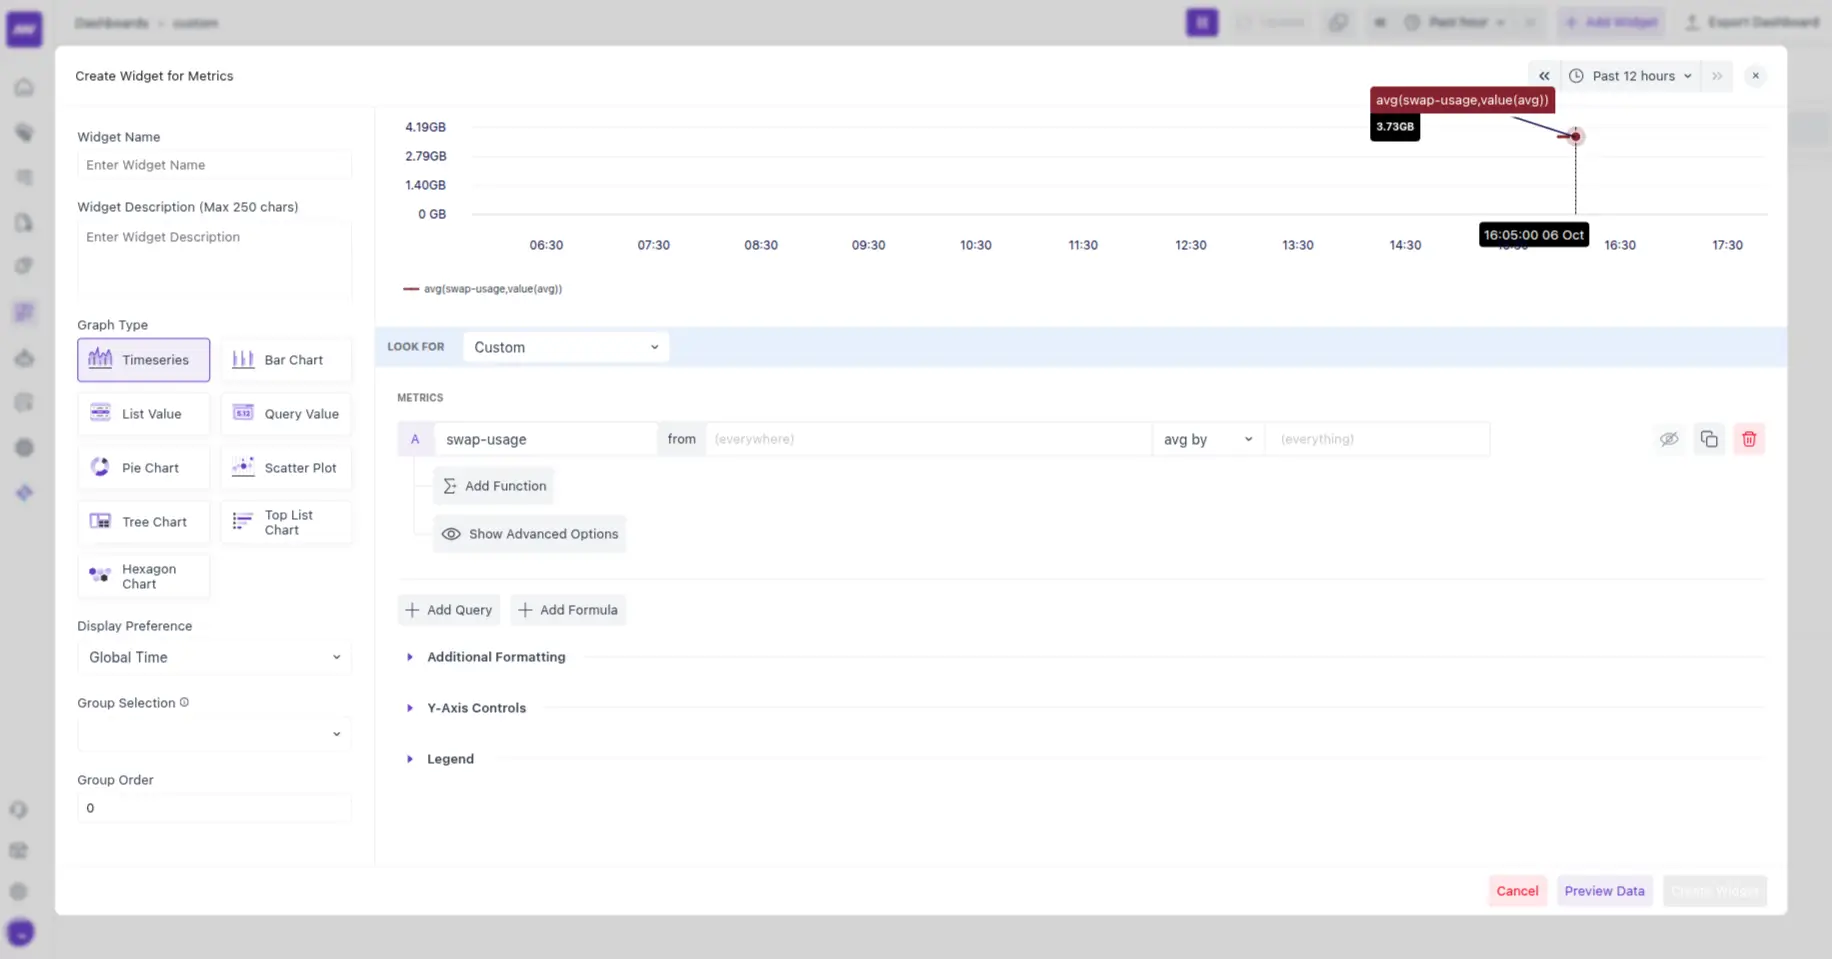
- In the dashboard, open dashboard builder → Create a new or open an existing dashboard and add a metrics widget.
- Under the Look for menu, select Custom, and the data should start showing in the selected dashboard.
Troubleshooting (quick)#
- 401/403: Check the
Authorizationheader (noBearer), that the key is active, and you’re hitting the correct region. - 400/422: Validate OTLP structure — ensure
resource_metrics[*].scope_metrics[*].metrics[*]contains one ofgauge/sum/histogramwith adata_pointsarray. - No data visible: Confirm
mw.resource_typeor the correct resource attribute (e.g.,host.id) is set. Ensure timestamps are realistic nanoseconds. - High cardinality: Reduce dynamic attribute values; prefer enums/buckets.
- gRPC exporters: Use endpoint without
/v1/metricsand keep TLS enabled (port 443).
Need assistance or want to learn more about Middleware? Contact our support team at [email protected] or join our Slack channel.