MongoDB Atlas Integration
The MongoDB Atlas integration ingests performance, health, and operational metrics (connections, ops rates, replication lag, CPU/memory, disk I/O, etc.) from your Atlas clusters into Middleware for dashboards and alerts.
Prerequisites#
- MongoDB Atlas account with an M10 or higher tier cluster (M0 free tier doesn’t expose the metrics API endpoints needed).
- Whitelist the Middleware’s collector IP for Atlas API access: 48.217.209.253. This IP can change, and if metrics stop flowing, contact MW Customer Support to verify the current IP.
Configuration Overview#
Atlas is integrated via the MongoDB Atlas API. You’ll create an API Key with Organization Read Only permission, whitelist the collector IP, then paste the key pair into the Middleware integration form.
1 Create a MongoDB Atlas API Key#
- Log in to Atlas.
- Go to Identity & Access → Applications → API Keys → Add New.
- Add a description for the key.
- Under Organization Permissions, select Organization Read Only.
- Click Next and copy both Public Key and Private Key (you won’t be able to view the private key again).
- Add
48.217.209.253to the API access list. - Create API Key.
(Optional) Verify API Key access
Run the Atlas API test calls (HTTP Digest) with your key pair:
1# Test organization access
2curl -u "<PUBLIC_KEY>:<PRIVATE_KEY>" \
3  --digest \
4  "https://cloud.mongodb.com/api/atlas/v1.0/orgs"
5
6# Test project access
7curl -u "<PUBLIC_KEY>:<PRIVATE_KEY>" \
8  --digest \
9  "https://cloud.mongodb.com/api/atlas/v1.0/groups"
Replace the placeholders with your actual values.
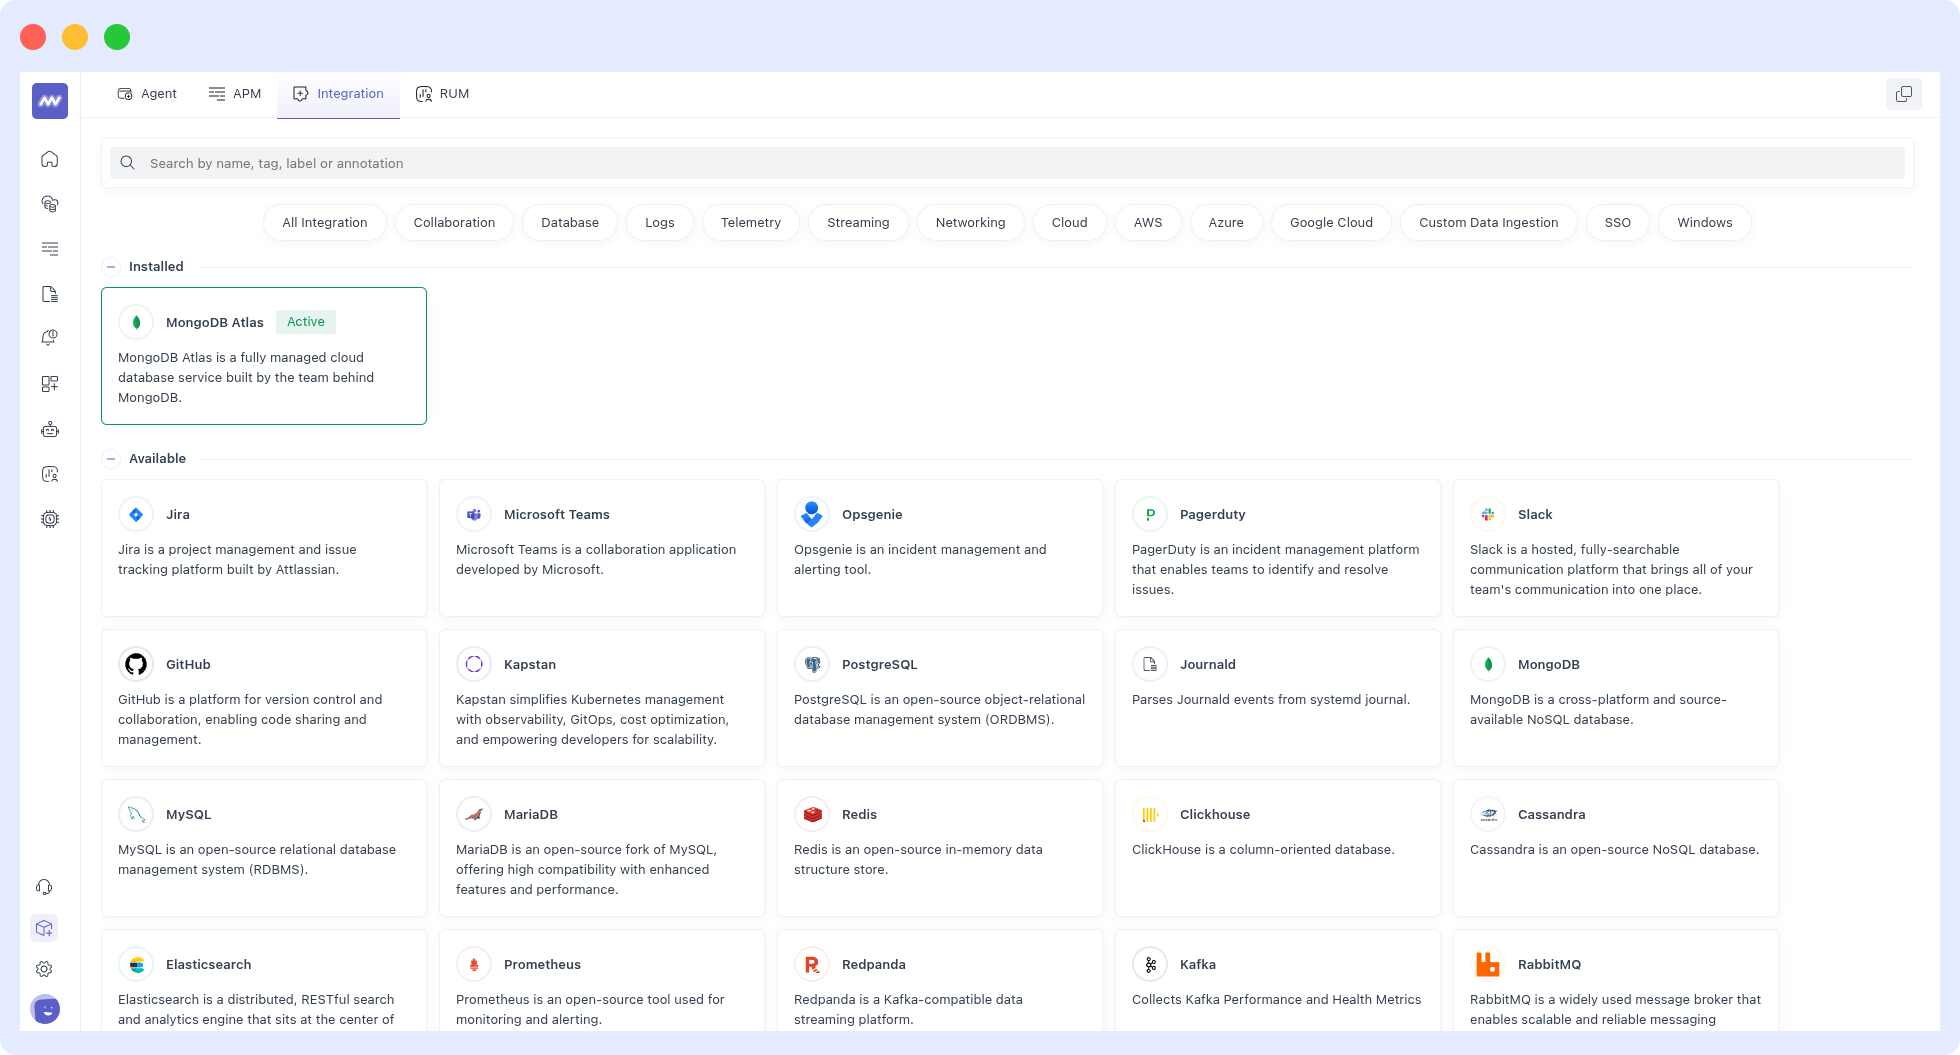
2 Open the MongoDB Atlas integration in Middleware#
Installations → All Integrations → MongoDB Atlas.
3 Fill in the Configuration#
Enter the required fields exactly as they appear in Atlas; leave the defaults unless you have a reason to change them.
Required fields (as shown on the form):
- Public Key: Your Atlas API public key
- Private Key: Your Atlas API private key
- Collection Interval (optional): default 3m
- Granularity: default PT1M
- Storage: Default file_storage
Projects (optional)
- Project Name
- Include Clusters / Exclude Clusters: Specify one of these (not both) to control which clusters are collected.
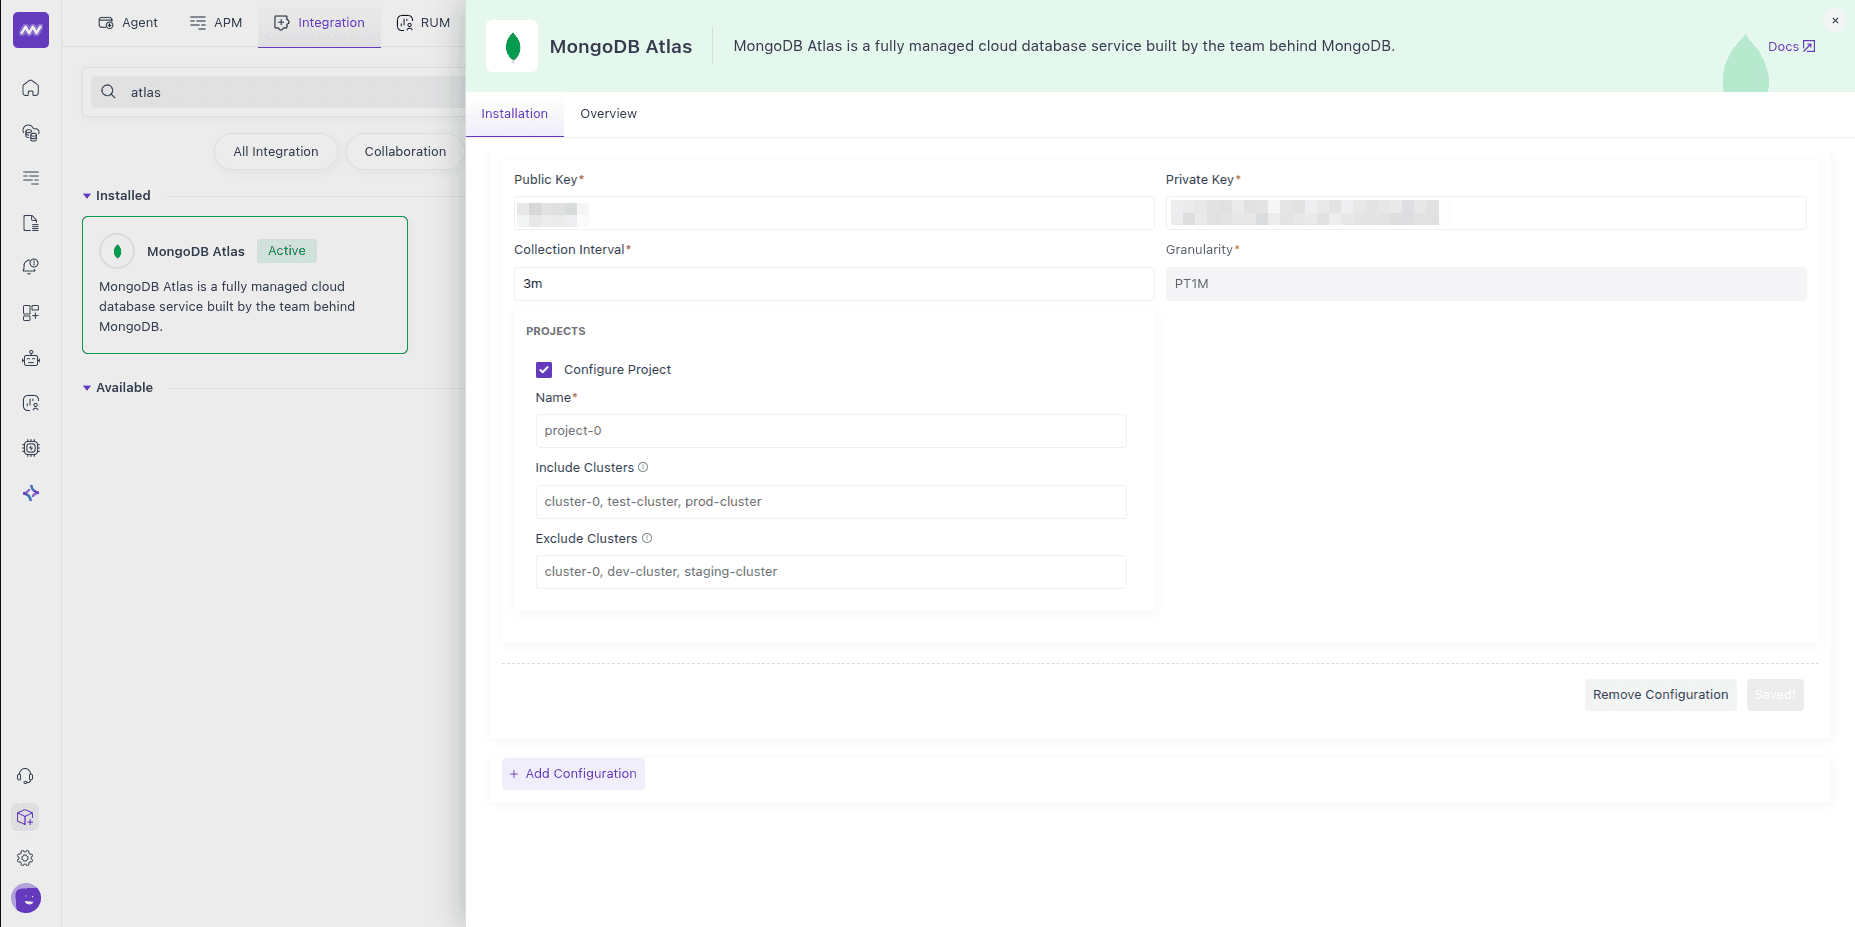
Save the configuration to start collection. Middleware connects to Atlas via the API and begins pulling metrics shortly after.
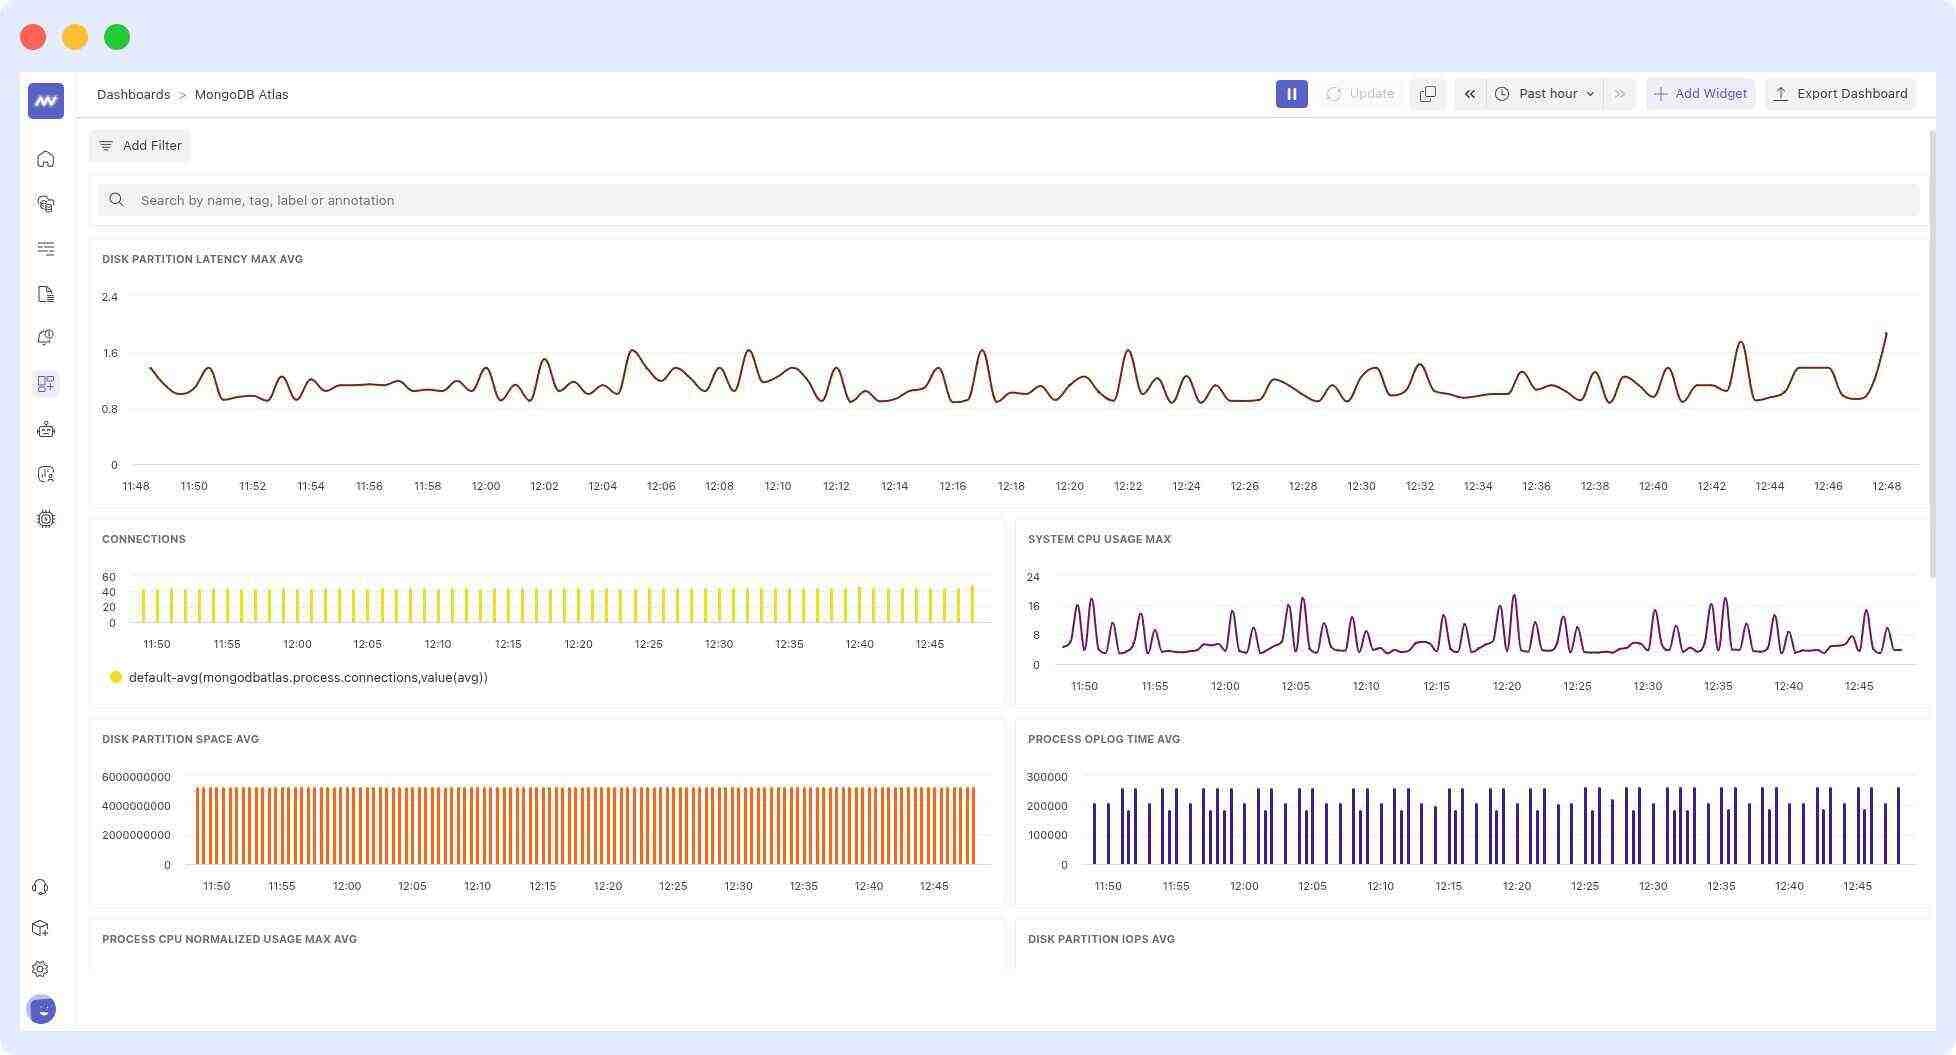
Visualize Analytics#
Default Dashboard#
A ready-made MongoDB Atlas dashboard appears in Dashboard Builder after a successful setup (use it to validate data flow, then customize as needed).
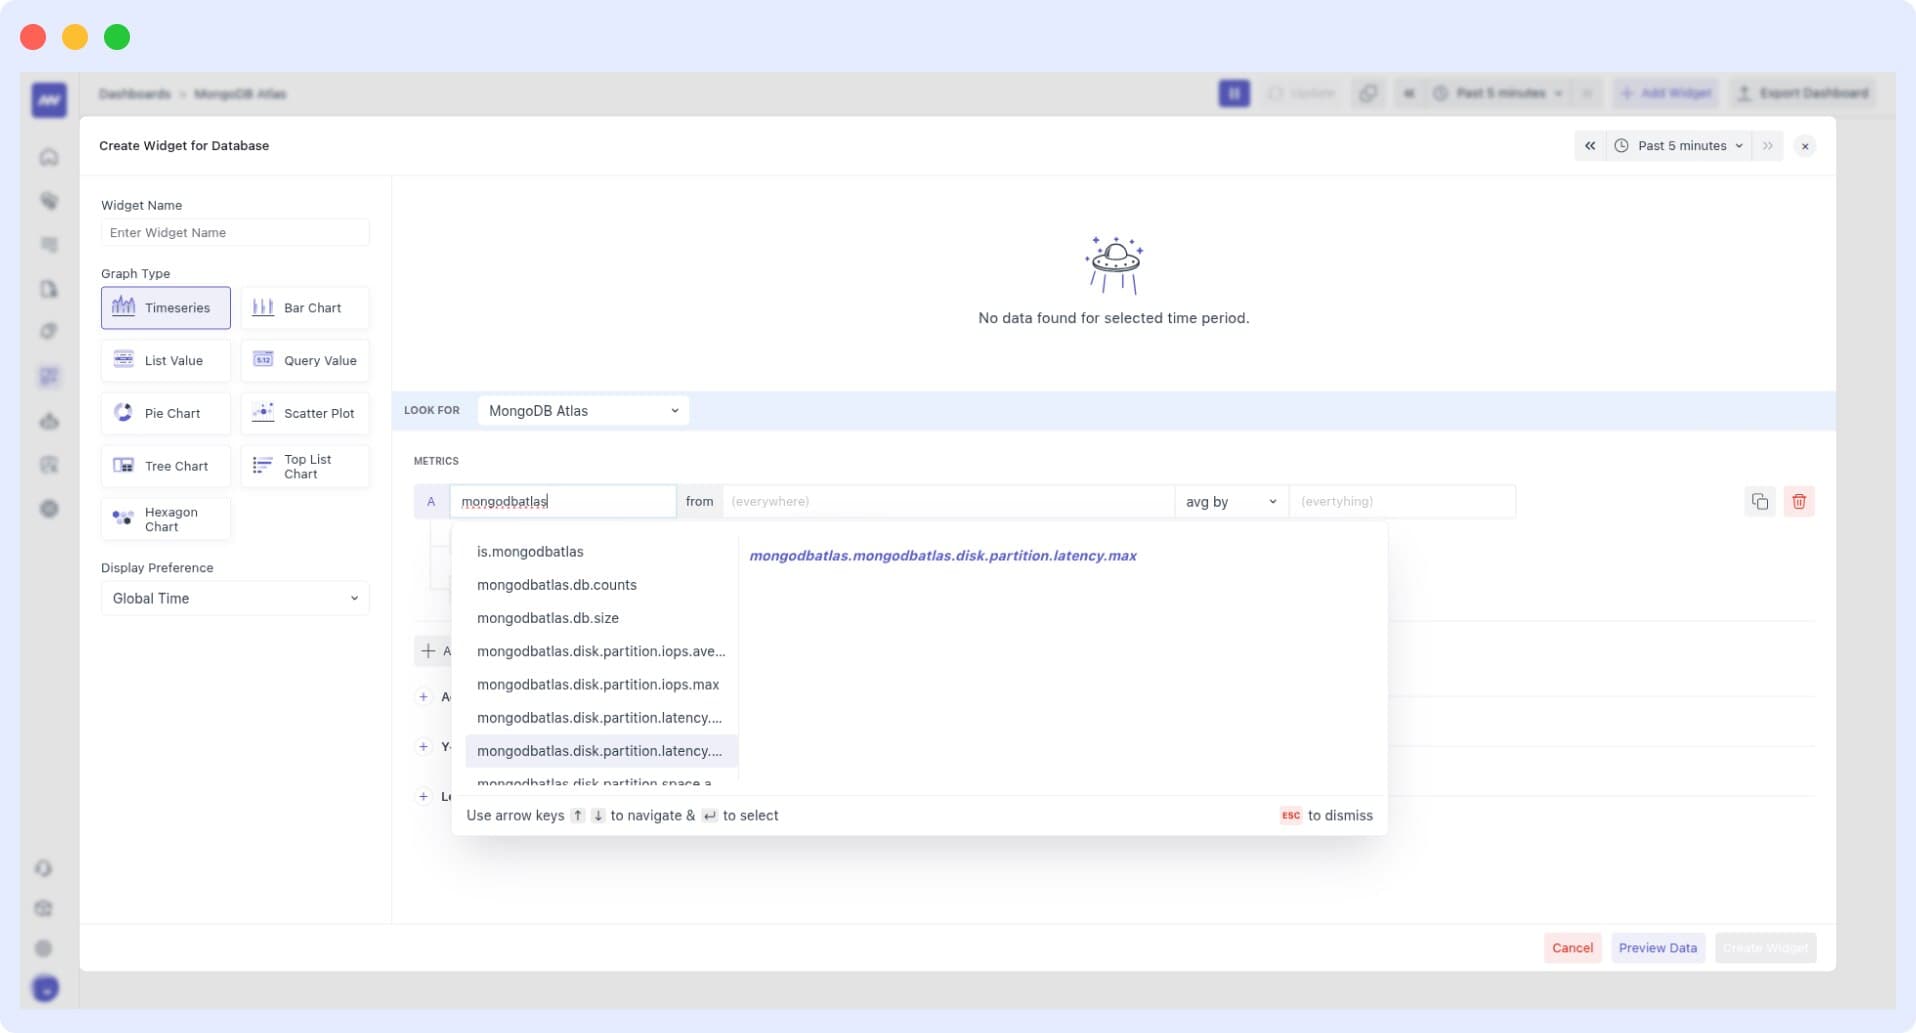
Create a custom widget#
- Select Widget Dashboard Navigate to the Create Widget screen:
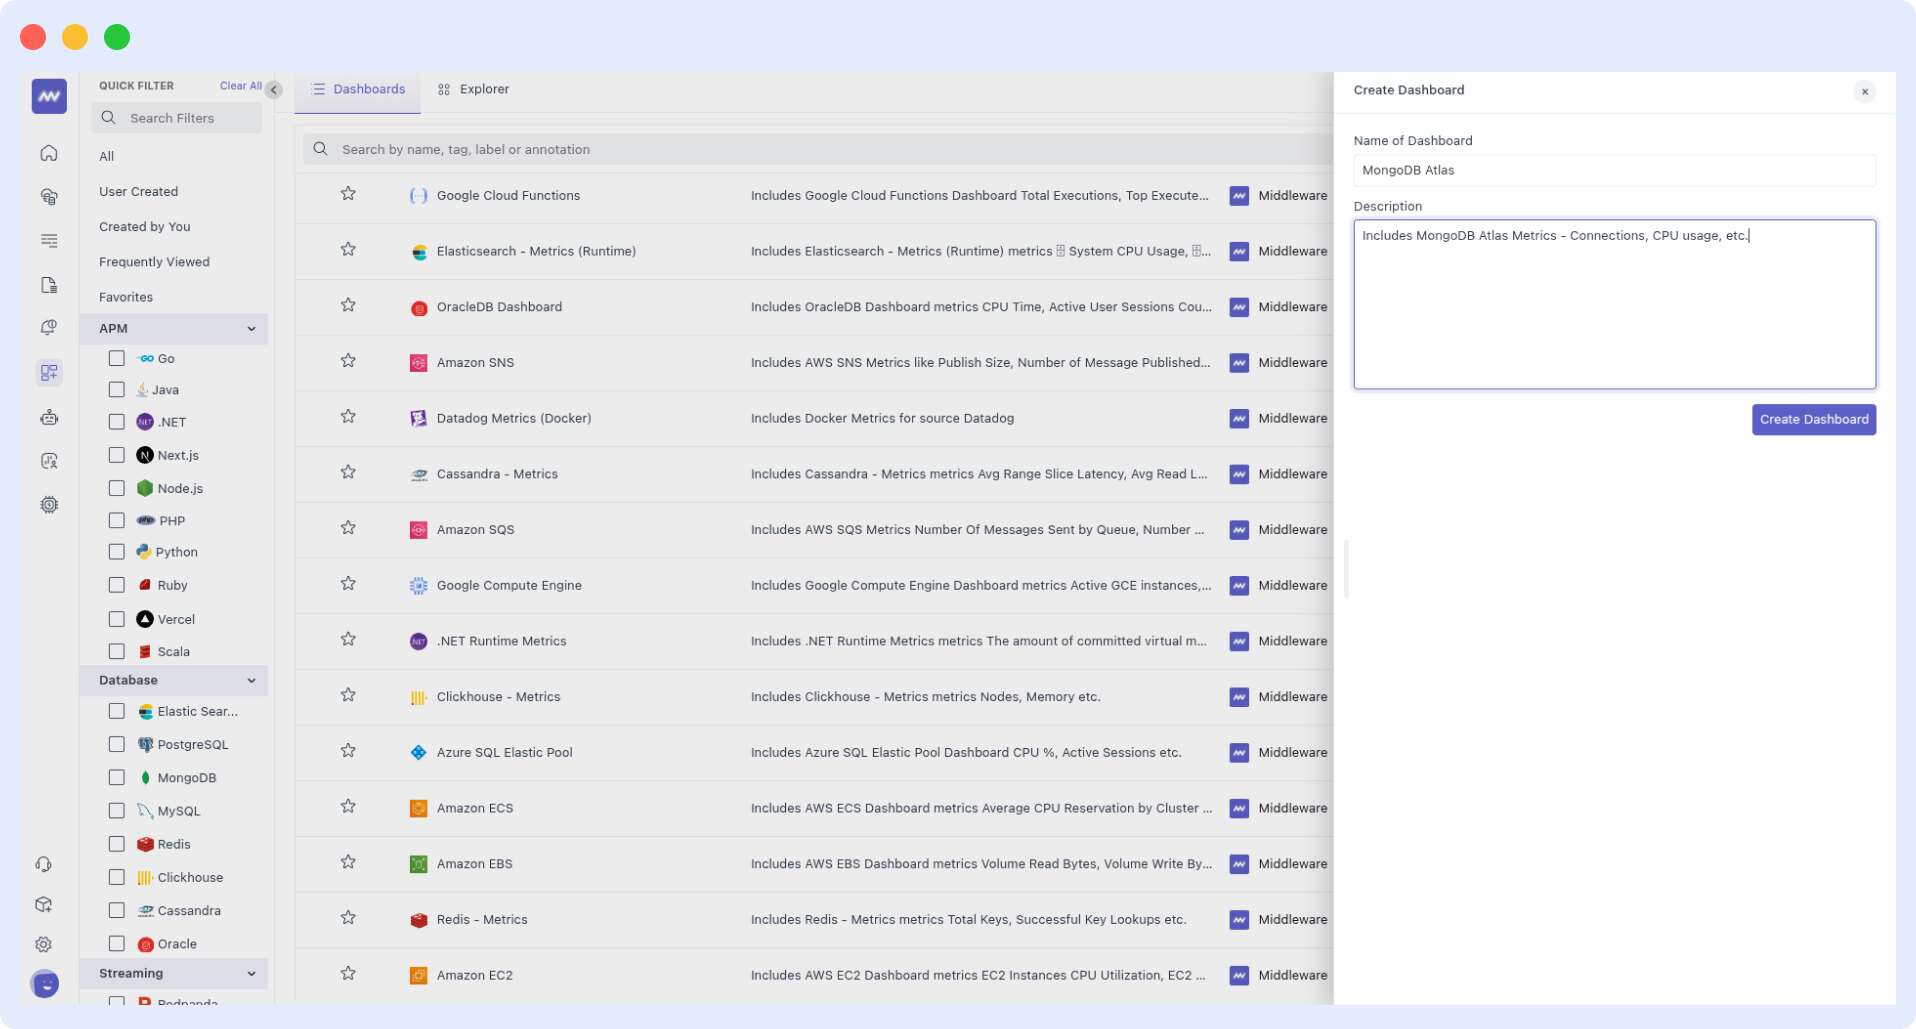
- Add Widget → Database → MongoDB Atlas; pick your metric(s), filters, and time range, then preview and save:
Alerts#
You can alert on any MongoDB Atlas metric. When creating a rule, choose Detection method: Database and Database type: MongoDB Atlas to see all Atlas metrics in the Metrics dropdown, then set your conditions.
Metrics Collected#
| Metric | Description |
|---|---|
mongodbatlas.process.asserts | Number of assertions per |
mongodbatlas.process.background_flush | Amount of data flushed in the background |
mongodbatlas.process.cache.io | Cache throughput (per second) |
mongodbatlas.process.cache.ratio | Cache ratios represented as (%) |
mongodbatlas.process.cache.size | Cache sizes |
mongodbatlas.process.connections | Number of current connections |
mongodbatlas.process.cpu.usage.max | CPU Usage (%) |
mongodbatlas.process.cpu.usage.average | CPU Usage (%) |
mongodbatlas.process.cpu.children.usage.max | CPU Usage for child processes (%) |
mongodbatlas.process.cpu.children.usage.average | CPU Usage for child processes (%) |
mongodbatlas.process.cpu.children.normalized.usage.max | CPU Usage for child processes, normalized to pct |
mongodbatlas.process.cpu.children.normalized.usage.average | CPU Usage for child processes, normalized to pct |
mongodbatlas.process.cpu.normalized.usage.max | CPU Usage, normalized to pct |
mongodbatlas.process.cpu.normalized.usage.average | CPU Usage, normalized to pct |
mongodbatlas.process.cursors | Number of cursors |
mongodbatlas.process.db.storage | Storage used by the database |
mongodbatlas.process.db.document.rate | Document access rates |
mongodbatlas.process.global_lock | Number and status of locks |
mongodbatlas.process.index.btree_miss_ratio | Index miss ratio (%) |
mongodbatlas.process.index.counters | Indexes |
mongodbatlas.process.journaling.commits | Journaling commits |
mongodbatlas.process.journaling.data_files | Data file sizes |
mongodbatlas.process.journaling.written | Journals written |
mongodbatlas.process.memory.usage | Memory Usage |
mongodbatlas.process.network.io | Network IO |
mongodbatlas.process.network.requests | Network requests |
mongodbatlas.process.oplog.time | Execution time by operation |
mongodbatlas.process.oplog.rate | Execution rate by operation |
mongodbatlas.process.db.operations.rate | DB Operation Rates |
mongodbatlas.process.db.operations.time | DB Operation Times |
mongodbatlas.process.page_faults | Page faults |
mongodbatlas.process.db.query_executor.scanned | Scanned objects |
mongodbatlas.process.db.query_targeting.scanned_per_returned | Scanned objects per returned |
mongodbatlas.process.restarts | Restarts in last hour |
mongodbatlas.system.paging.usage.max | Swap usage |
mongodbatlas.system.paging.usage.average | Swap usage |
mongodbatlas.system.paging.io.max | Swap IO |
mongodbatlas.system.paging.io.average | Swap IO |
mongodbatlas.system.cpu.usage.max | System CPU Usage (%) |
mongodbatlas.system.cpu.usage.average | System CPU Usage (%) |
mongodbatlas.system.memory.usage.max | System Memory Usage |
mongodbatlas.system.memory.usage.average | System Memory Usage |
mongodbatlas.system.network.io.max | System Network IO |
mongodbatlas.system.network.io.average | System Network IO |
mongodbatlas.system.cpu.normalized.usage.max | System CPU Normalized to pct |
mongodbatlas.system.cpu.normalized.usage.average | System CPU Normalized to pct |
mongodbatlas.process.tickets | Tickets |
mongodbatlas.disk.partition.iops.max | Disk partition iops |
mongodbatlas.disk.partition.iops.average | Disk partition iops |
mongodbatlas.disk.partition.throughput | Disk throughput |
mongodbatlas.disk.partition.usage.max | Disk partition usage (%) |
mongodbatlas.disk.partition.usage.average | Disk partition usage (%) |
mongodbatlas.disk.partition.utilization.max | Max % time requests are issued/serviced by the partition |
mongodbatlas.disk.partition.utilization.average | % time requests are issued/serviced by the partition |
mongodbatlas.disk.partition.latency.max | Disk partition latency |
mongodbatlas.disk.partition.latency.average | Disk partition latency |
mongodbatlas.disk.partition.space.max | Disk partition space |
mongodbatlas.disk.partition.space.average | Disk partition space |
mongodbatlas.disk.partition.queue.depth | Disk queue depth |
mongodbatlas.db.size | Database feature size |
mongodbatlas.db.counts | Database feature size |
mongodbatlas.system.fts.memory.usage | Full-text search |
mongodbatlas.system.fts.disk.used | Full text search disk usage |
mongodbatlas.system.fts.cpu.usage | Full-text search CPU (%) |
mongodbatlas.system.fts.cpu.normalized.usage | Full-text search CPU (normalized %) |
Need assistance or want to learn more about Middleware? Contact our support team at [email protected] or join our Slack channel.