Trace an LLM application end to end
This walkthrough takes a customer-support chatbot from a single API call to production monitoring with the middleware-llmobs SDK. By the end you'll have:
- every OpenAI call traced as an LLM span,
- conversations grouped by session and attributed to a user,
- automated evaluation scoring production traffic,
- a loop for reviewing low scores and iterating on your prompt.
Start with the first trace, then layer on the rest.
1. Get your first trace#
The simplest way to start is to call register(auto_instrument=True), make a standard OpenAI request, and view the resulting LLM trace in Middleware.
Install the Middleware SDK, the OpenAI instrumentation, and the OpenAI client:
1pip install middleware-llmobs openinference-instrumentation-openai openaiExport your Middleware endpoint, key, and OpenAI key. Replace <MW_UID> and <MW_API_KEY> with the values from your Middleware account:
1export OTEL_EXPORTER_OTLP_ENDPOINT="https://<MW_UID>.middleware.io:443"
2export OTEL_EXPORTER_OTLP_HEADERS="Authorization=<MW_API_KEY>,X-Trace-Source=openinference"
3export OPENAI_API_KEY="<your-openai-key>"1from middleware.llmobs import register
2import openai
3
4# Register once at startup. auto_instrument=True picks up the installed
5# OpenAI instrumentation, so every chat.completions.create() becomes an LLM span.
6providers = register(service_name="support-chatbot", auto_instrument=True)
7client = openai.OpenAI()
8
9# AUTO: no decorator, no manual span. Auto-instrumentation spans this call
10# on its own, capturing prompt, response, model, and token usage.
11response = client.chat.completions.create(
12 model="gpt-4o-mini",
13 messages=[
14 {"role": "system", "content": "You are a concise technical writer."},
15 {"role": "user", "content": "Summarise OpenTelemetry in one sentence."},
16 ],
17 temperature=0.2,
18)
19print(response.choices[0].message.content)
20
21# Flush so the span leaves the process before the script exits.
22providers.tracer.force_flush()In Middleware, open LLM Observability and select the support-chatbot service. You'll see an LLM span carrying the model name, input messages, assistant response, and prompt/completion token usage, with no manual instrumentation at all.
The force_flush() call matters for short-lived processes such as scripts, CLI tools, and serverless functions. A long-running server doesn't need it on every request: the batch processor exports in the background and flushes at shutdown.
2. Structure the chatbot into spans#
A real chatbot does more than one call. Break it into named steps so each shows up as its own span under one trace. You get a tracer from the providers object that register() returns, then decorate your functions:
@tracer.chainmarks a sequential workflow or orchestration step. Use it for the top-level pipeline.@taskmarks a generic step inside it.
Both are for your own (non-model) code. The OpenAI call is spanned automatically by auto-instrumentation, you don't decorate it.
1from middleware.llmobs import register, task
2import openai
3
4providers = register(service_name="support-chatbot", auto_instrument=True)
5tracer = providers.tracer.get_tracer(__name__)   # OpenInference tracer: .chain / .agent / .tool
6client = openai.OpenAI()
7
8SYSTEM_PROMPT = (
9    "You are a helpful customer support agent for Acme Corp. "
10    "Answer concisely, friendly, and accurately. If you don't know, say so."
11)
12
13@task(name="generate_response")   # MANUAL: @task spans this step
14def generate_response(user_message: str) -> str:
15    # AUTO: auto-instrumentation spans this OpenAI call, nested under generate_response
16    completion = client.chat.completions.create(
17        model="gpt-4o-mini",
18        messages=[
19            {"role": "system", "content": SYSTEM_PROMPT},
20            {"role": "user", "content": user_message},
21        ],
22    )
23    return completion.choices[0].message.content
24
25@tracer.chain   # MANUAL: chain span for the overall workflow; everything below nests under it
26def support_chatbot(user_message: str) -> str:
27    return generate_response(user_message)
28
29print(support_chatbot("How do I reset my password?"))
30providers.tracer.force_flush()
Calling support_chatbot nests the spans into one trace. The chain and task decorators open your two named spans; auto-instrumentation adds the LLM span underneath, no manual span needed:
1chain: support_chatbot           (manual, @tracer.chain)   root span
2  └── task: generate_response    (manual, @task)
3        └── chat completion       (auto)                    model, messages, response, token usage
Open a trace to see that structure as a waterfall, with the chain span over the task span over the auto-instrumented LLM call:
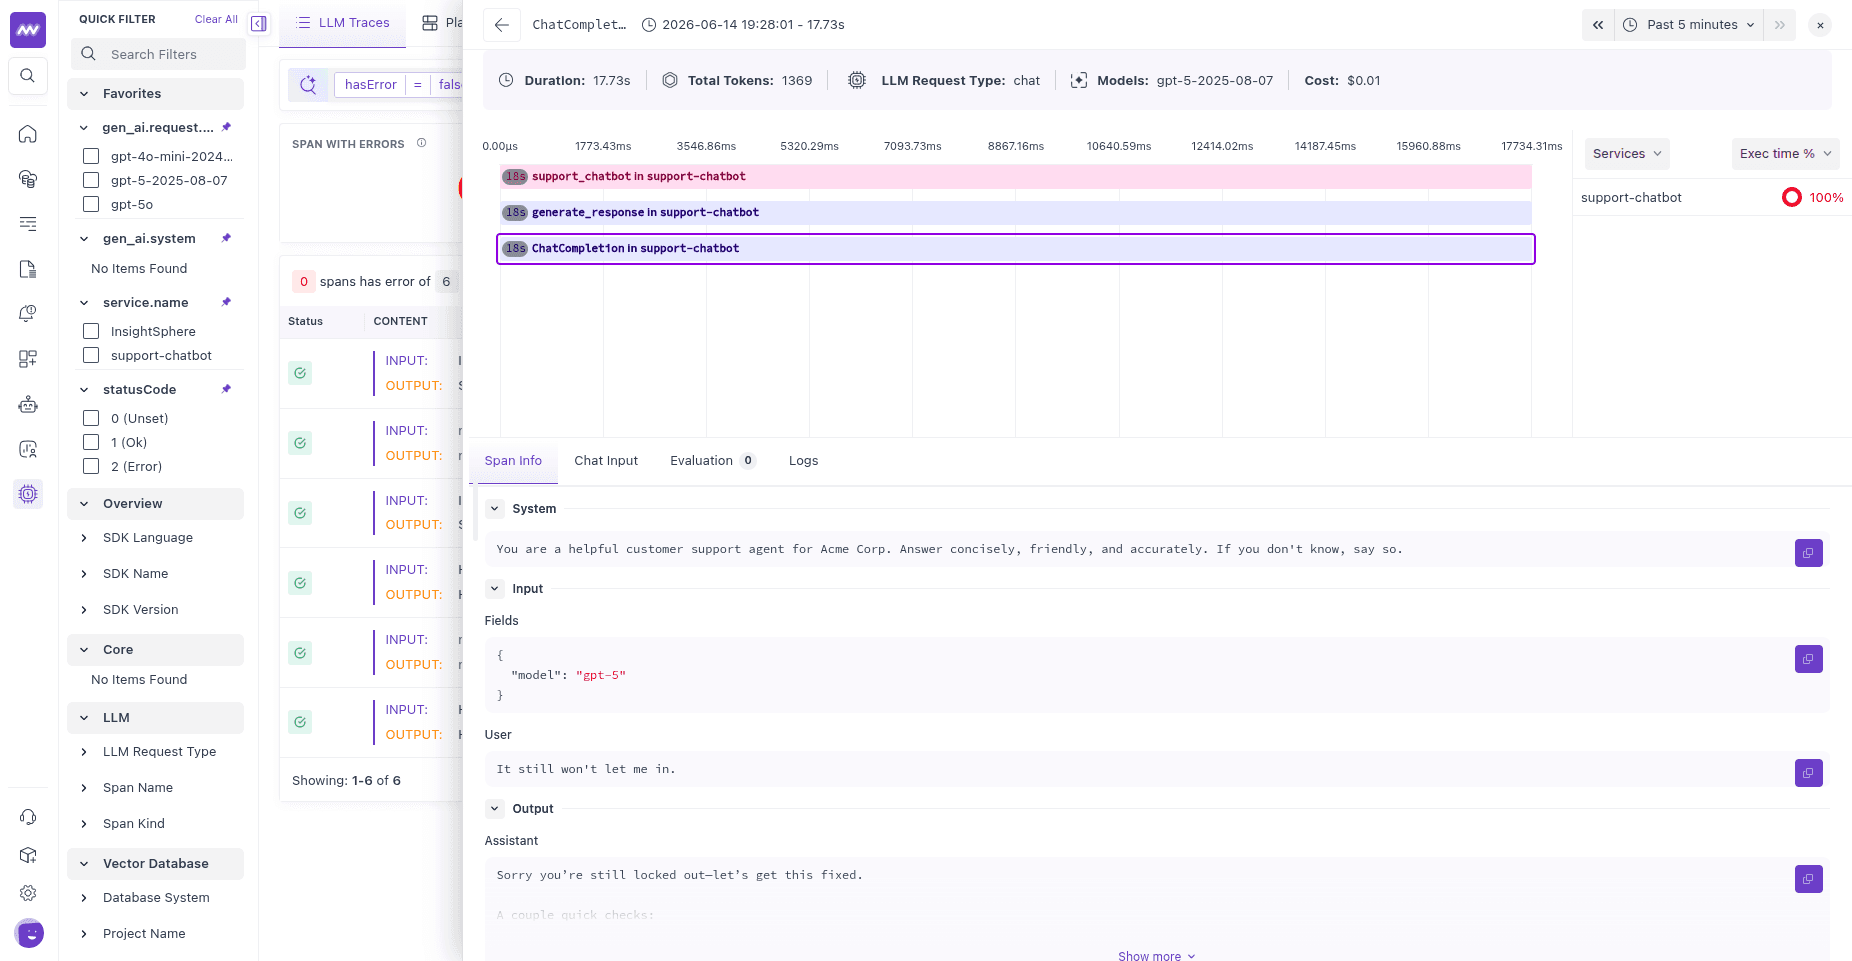
providers.tracer.get_tracer(...) returns an OpenInference tracer with decorators for each span kind: @tracer.chain, @tracer.agent, @tracer.tool, @tracer.llm. The SDK's standalone @task, @retriever, and @embedding decorators cover the common cases without pulling a tracer; mix and match.
3. Add session and user context#
To follow a multi-turn conversation and attribute traffic to a customer, wrap a turn in using_session, using_user, and using_metadata. Every span created inside inherits that context.
1from middleware.llmobs import using_session, using_user, using_metadata
2
3def handle_turn(user_message: str, customer_id: str, thread_id: str) -> str:
4    with using_session(session_id=thread_id), \
5         using_user(user_id=customer_id), \
6         using_metadata({"feature": "support_chat"}):
7        return support_chatbot(user_message)
8
9# Two turns sharing one thread are grouped into a single session in the UI.
10handle_turn("How do I reset my password?", customer_id="user_123", thread_id="conv_abc")
11handle_turn("It still won't let me in.",   customer_id="user_123", thread_id="conv_abc")
All spans from a thread share a session ID, so you can open a conversation and follow every turn in order. Filtering by user ID shows one customer's traffic, latency, and cost across sessions. The feature metadata is what you'll scope evaluations to in the next step. For more on this, see Track sessions & users.
4. Evaluate the responses#
Tracing shows you what happened. Evaluation tells you whether it was any good. Two ways to score this chatbot in Middleware:
Server-side, no code. Create an LLM-as-a-judge evaluator in the UI that scores every support response automatically. In LLM Traces → Evaluation → Add Evaluator, write a judge that rates support quality (answers the question, friendly tone, accurate), set a Score output with a passing threshold, and scope it with an Evaluate On filter so it only runs on this chatbot's spans. See Server-side evaluations.
In code. Score a response yourself and submit it with submit_evaluation, or run your own judge with LLMJudge:
1from middleware.llmobs import submit_evaluation
2
3@tracer.chain
4def support_chatbot(user_message: str) -> str:
5    answer = generate_response(user_message)
6    submit_evaluation(
7        label="answered",
8        value=bool(answer.strip()),     # bool -> boolean
9        assessment="pass" if answer.strip() else "fail",
10    )
11    return answer
For a quality judge that grades the answer with a model, see Evaluate with an LLM-as-judge. For deterministic checks, see Write a custom evaluator.
5. Monitor and iterate#
Once a server-side evaluator is published, scores attach to spans as they arrive. Your ongoing loop:
- Watch the trend. Evaluation scores export as metrics (
gen_ai.evaluations.*); chart the pass rate and alert when it drops. - Review the failures. Filter traces by
gen_ai.evaluation.verdict = fail(or a low score) and read the judge's reasoning next to the input and output that produced it. - Fix the cause. Adjust the system prompt, model, or retrieval, then watch the pass rate on the next batch of traffic.
Production data feeds evaluation, evaluation surfaces what to fix, and the fix deploys back to production.
Next steps#
- Track sessions & users for multi-turn conversations.
- Evaluate with an LLM-as-judge to score answer quality with a model.
- Trace and evaluate a RAG pipeline if your chatbot retrieves context.