Query Metrics
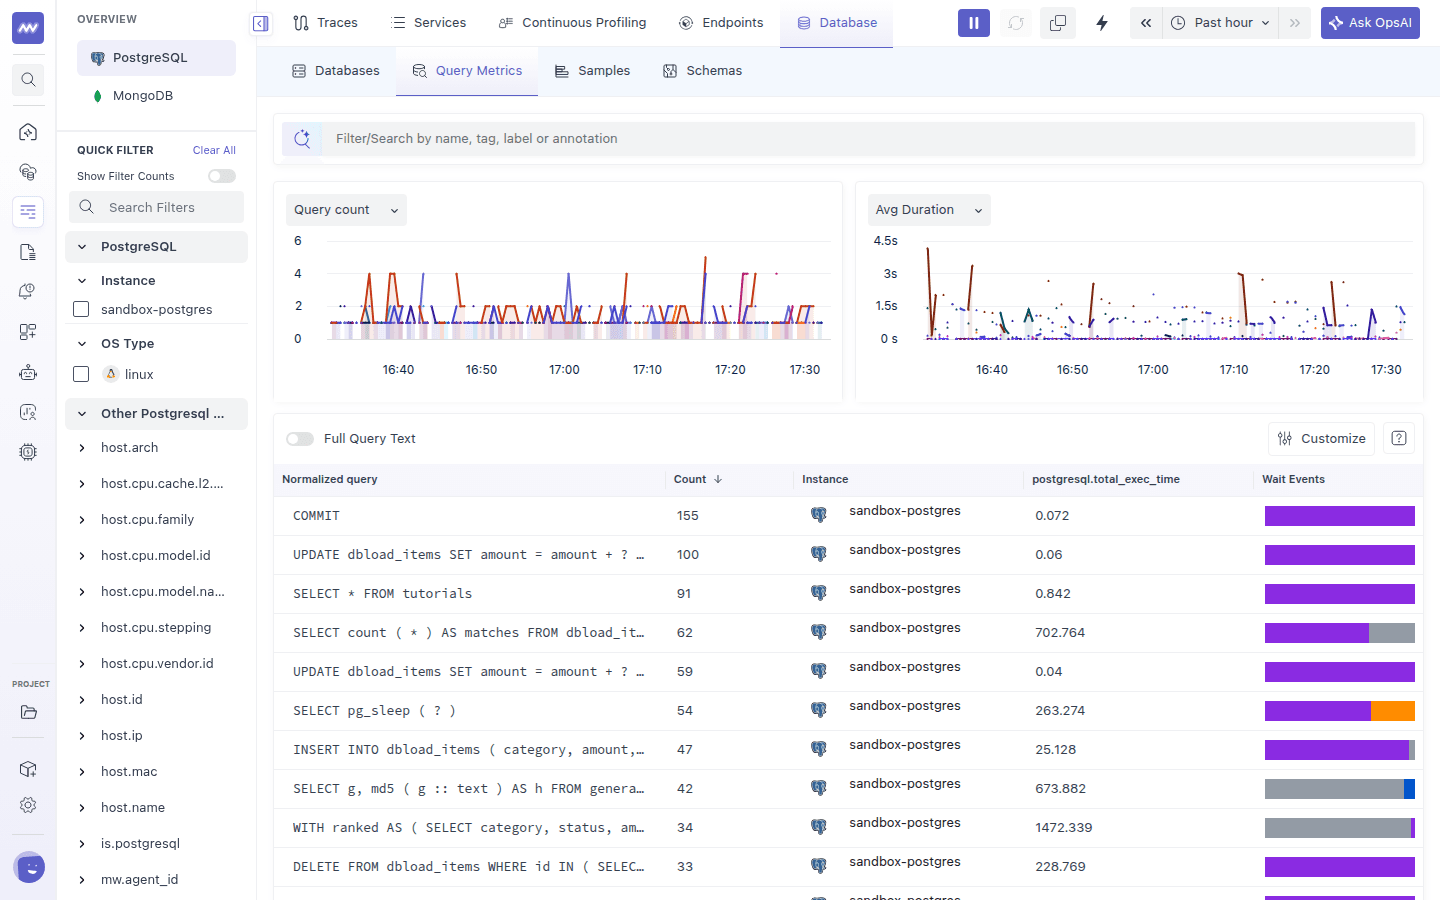
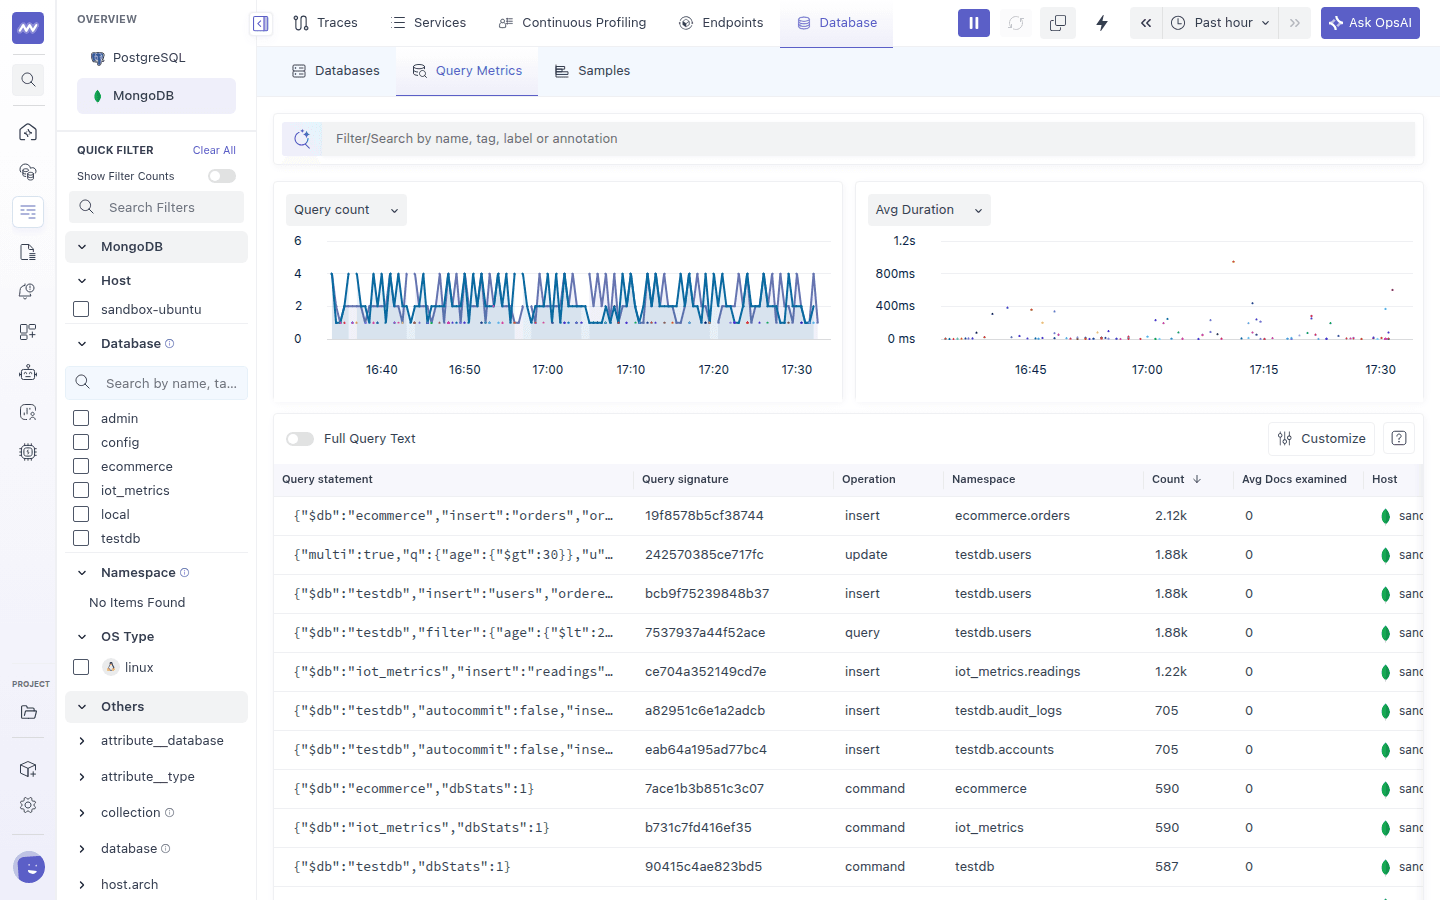
The Query Metrics tab groups executions of the same query together, so you can rank queries by how often they run and how long they take. PostgreSQL queries are grouped by normalized query text per instance. MongoDB operations are grouped by query signature per host.
Open it from APM → Database → Query Metrics, and select the engine in the Overview list.
Charts#
Two charts at the top show trends for the queries in the table. Choose the metric for each chart from its dropdown:
- Query count
- Total Duration
- Avg Duration
- P95 Duration
Each line is one query. Hover over a chart to see the value for each query. Your chart choices are remembered.
For PostgreSQL, counts and durations are calculated from query samples, so Count is the number of sampled executions. See How It Works.
Query Table#
| Column | Description |
|---|---|
| Normalized query | Query text with literal values replaced by ? |
| Count | Number of sampled executions in the time range |
| Avg Duration | Average execution time, with a bar scaled to the slowest query |
| Total Duration | Sum of execution time across samples |
| Instance | The PostgreSQL instance the query ran on |
| Wait Events | A stacked bar showing which wait event groups the query's samples were in. Hover over it to see the count and percentage per wait event type. |
Default columns:
| Column | Description |
|---|---|
| Query statement | The operation as JSON, for example {"$db":"shop","find":"orders",...} |
| Query signature | Hash that identifies the shape of the operation |
| Operation | insert, query, update, remove, command, getmore, and so on |
| Namespace | database.collection |
| Count | Number of profiled executions |
| Avg Duration / Total Duration | Operation time from the profiler |
| Avg Docs examined | Average documents scanned per execution |
| Host | The MongoDB host |
Optional columns: Avg Keys examined, Avg Returned, Avg Modified, Avg Inserted, Avg Deleted, Avg Keys Inserted, Avg Write Conflicts, Avg Yields, Avg CPU Time, Avg Planning Time, and Avg Response Length.
Table controls:
- Full Query Text: shows complete query text instead of truncating it.
- Customize: choose which columns to show, then click Apply Changes.
- Sort by clicking a column header. Use the search bar at the top of the page to filter by query text.
Query Details#
Click a query to open its detail panel.
- View Query Samples opens the Samples tab filtered to this query.
- Filter to Query adds the instance and query to the page search, so every tab shows only this query.
The top of the panel shows the instance, the Query text, Tags collected from recent executions, and Avg Duration, Total Duration, and Count charts.
PostgreSQL#
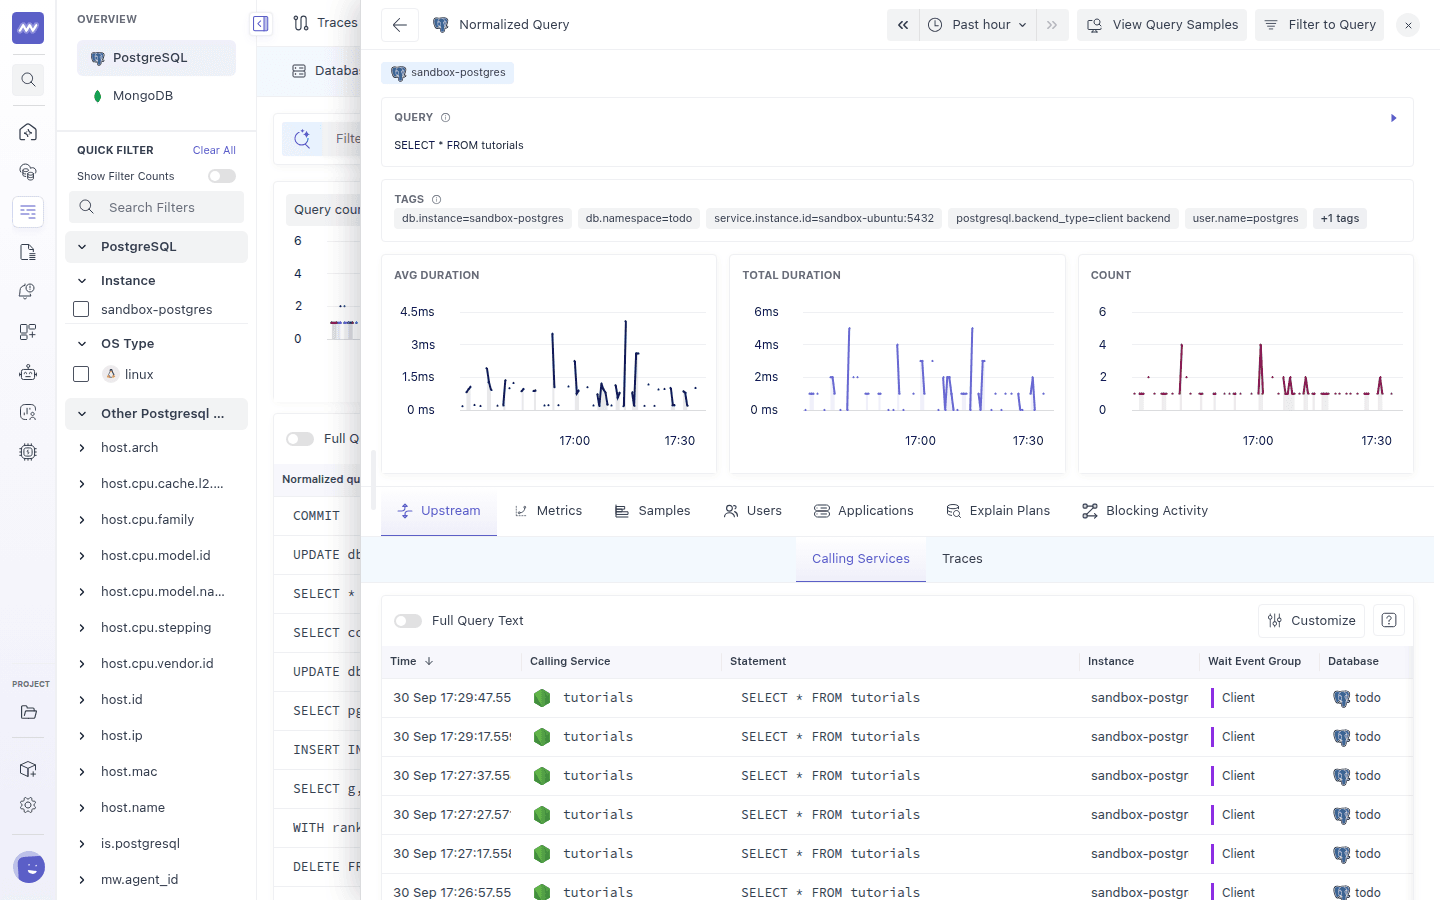
Click the arrow next to Query to format the SQL. Tags include db.instance, db.namespace (database), service.instance.id, backend type, user.name, and the client address.
| Tab | What it shows |
|---|---|
| Upstream | Calling Services: the APM services that sent this query. Traces: the APM spans linked to the query's samples, with Open in Traces. Needs APM trace correlation. |
| Metrics | Count and durations, plus average rows, shared block hits, reads, dirtied and written blocks, temp block reads and writes, and block read and write time. Block, row, and I/O time charts need Top Query Collection, and I/O time needs track_io_timing. |
| Samples | The samples for this query, with the activity chart |
| Users | Samples, average duration, and total duration per database user |
| Applications | Samples, average duration, and total duration per application_name |
| Explain Plans | The latest execution plan for this query. See Explain Plans. |
| Blocking Activity | Blocking Overview and Blocking Samples for this query |
MongoDB#
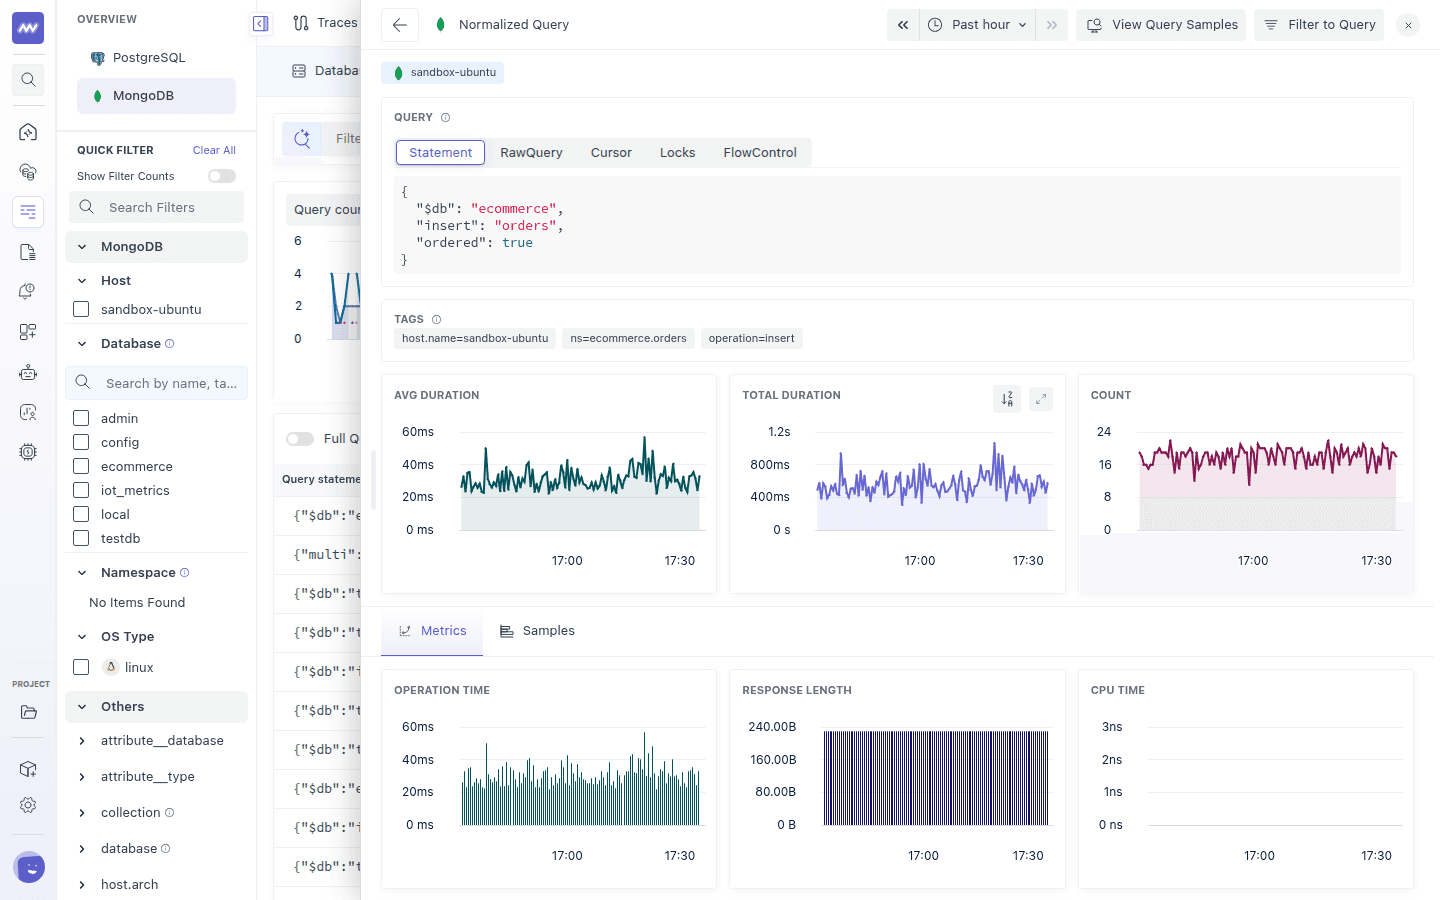
The Query section has five views of the latest execution: Statement, RawQuery, Cursor, Locks, and FlowControl. Tags include the host, namespace, operation, plan summary, and query ID.
| Tab | What it shows |
|---|---|
| Metrics | Operation time, response length, CPU time, and documents and keys examined, inserted, returned, matched, modified, and deleted, plus write conflicts |
| Samples | Individual executions of this operation |
Explain Plans (PostgreSQL) #
The Explain Plans tab shows the most recent plan the agent captured for the query within the selected time range. Plans come from Top Query Collection and are produced with EXPLAIN, so the query is never executed to get them.
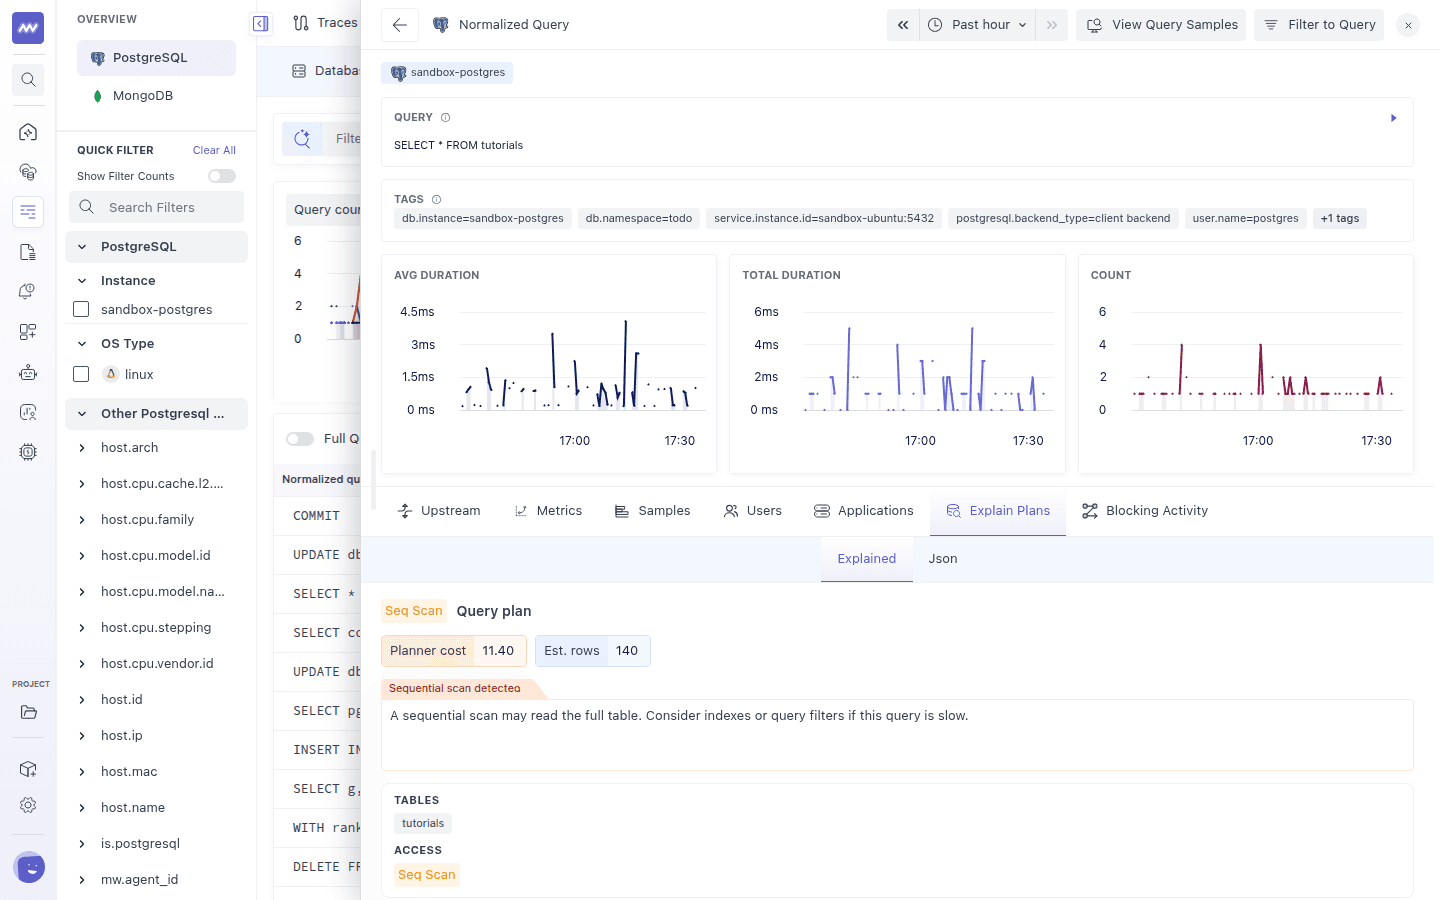
Two views are available:
- Explained: a readable plan tree.
- Json: the raw
EXPLAIN (FORMAT JSON)output.
The Explained view contains:
- Plan summary: the root operation (for example
Seq Scan,Hash Join,Index Scan), Planner cost, Est. rows (or Actual rows when present), and Planning and Execution time when available. - Sequential scan detected: a warning shown when any step reads a full table. Consider adding an index or a more selective filter if the query is slow.
- Tables, Indexes, and Access: the tables and indexes the plan touches, and the scan and join methods it uses.
- Plan steps: every plan node, nested under its parent. Each node shows its type, Planner cost (startup → total), estimated rows, loops, workers, the table or index it reads, and details such as
Filter,Index Cond,Hash Cond, andSort Key.
If no plan is available, the tab shows "No explain plan found for this query in the selected time range." See PostgreSQL troubleshooting.
Wait Events and Blocking (PostgreSQL) #
Every PostgreSQL query sample records the wait event the session was in when sampled. Wait events show why a query is slow: waiting on locks, disk, the client, or internal resources.
| Wait event group | What the session was doing |
|---|---|
| No wait event | Running, not waiting. Shown in green, labelled Activity in charts and — in tables. |
| Lock | Waiting for a heavyweight lock held by another session (row or table locks) |
| LWLock | Waiting for a lightweight internal lock, such as a buffer mapping or WAL lock |
| IO | Waiting for a disk read or write |
| Client | Waiting for the client application to send or read data |
| IPC | Waiting for another server process |
| BufferPin | Waiting to access a data buffer another process is using |
| Activity | A background process waiting for work. Uses the same green as running queries. |
| Timeout | Waiting for a timeout to expire |
| Extension | Waiting inside an extension |
Wait event groups appear in the Wait Events column of the query table, in the Load By Wait Group column of the instance list, in the instance Average Load chart, and in the Samples tab.
Blocking: when a session waits on a Lock, PostgreSQL reports which sessions block it. Database Monitoring uses this to separate root blocking queries (the queries holding the lock) from waiting queries. The Blocking Overview table lists:
| Column | Description |
|---|---|
| Root blocking query | The query at the head of the lock chain |
| Tables | Tables involved |
| Max block time | Longest time another query waited on it |
| Total block time | Sum of wait time it caused |
| Occurrences | Number of blocking events |
Blocking Samples lists the individual samples, including Blocking Pids. You can find blocking data in the instance Summary → Blocking Queries section, the instance Queries tab, and each query's Blocking Activity tab.
Need assistance or want to learn more about Middleware? Get in touch with us via our Contact Us or join our Slack channel.