OpsAI Settings
OpsAI Settings is the central control panel for configuring how OpsAI monitors, investigates, and helps resolve issues across your environment.
From here, you can choose what OpsAI monitors across Kubernetes clusters, APM services, and RUM apps, enable or disable Auto Investigation for each source, configure notifications, and centralize alerts from Middleware and third-party tools.
When Auto Investigation is enabled, OpsAI continuously analyzes available signals such as metrics, logs, and traces. It correlates telemetry across related entities and recent changes, performs root cause analysis (RCA), and proposes a fix that you can review and apply.
Prerequisites#
- For Kubernetes: Install the Kube Agent with
opsai.enabled=trueand verify that the cluster is visible in Middleware. - For APM: Instrument the service and ensure it is reporting traces to Middleware.
- For RUM: Install the RUM snippet in your application and ensure it is sending data to Middleware.
Connect your GitHub or Bitbucket repository so OpsAI can read the files related to an error through the MCP server. With the repository linked, OpsAI delivers far more accurate, code-level fixes for APM and RUM issues.
Open OpsAI Settings#
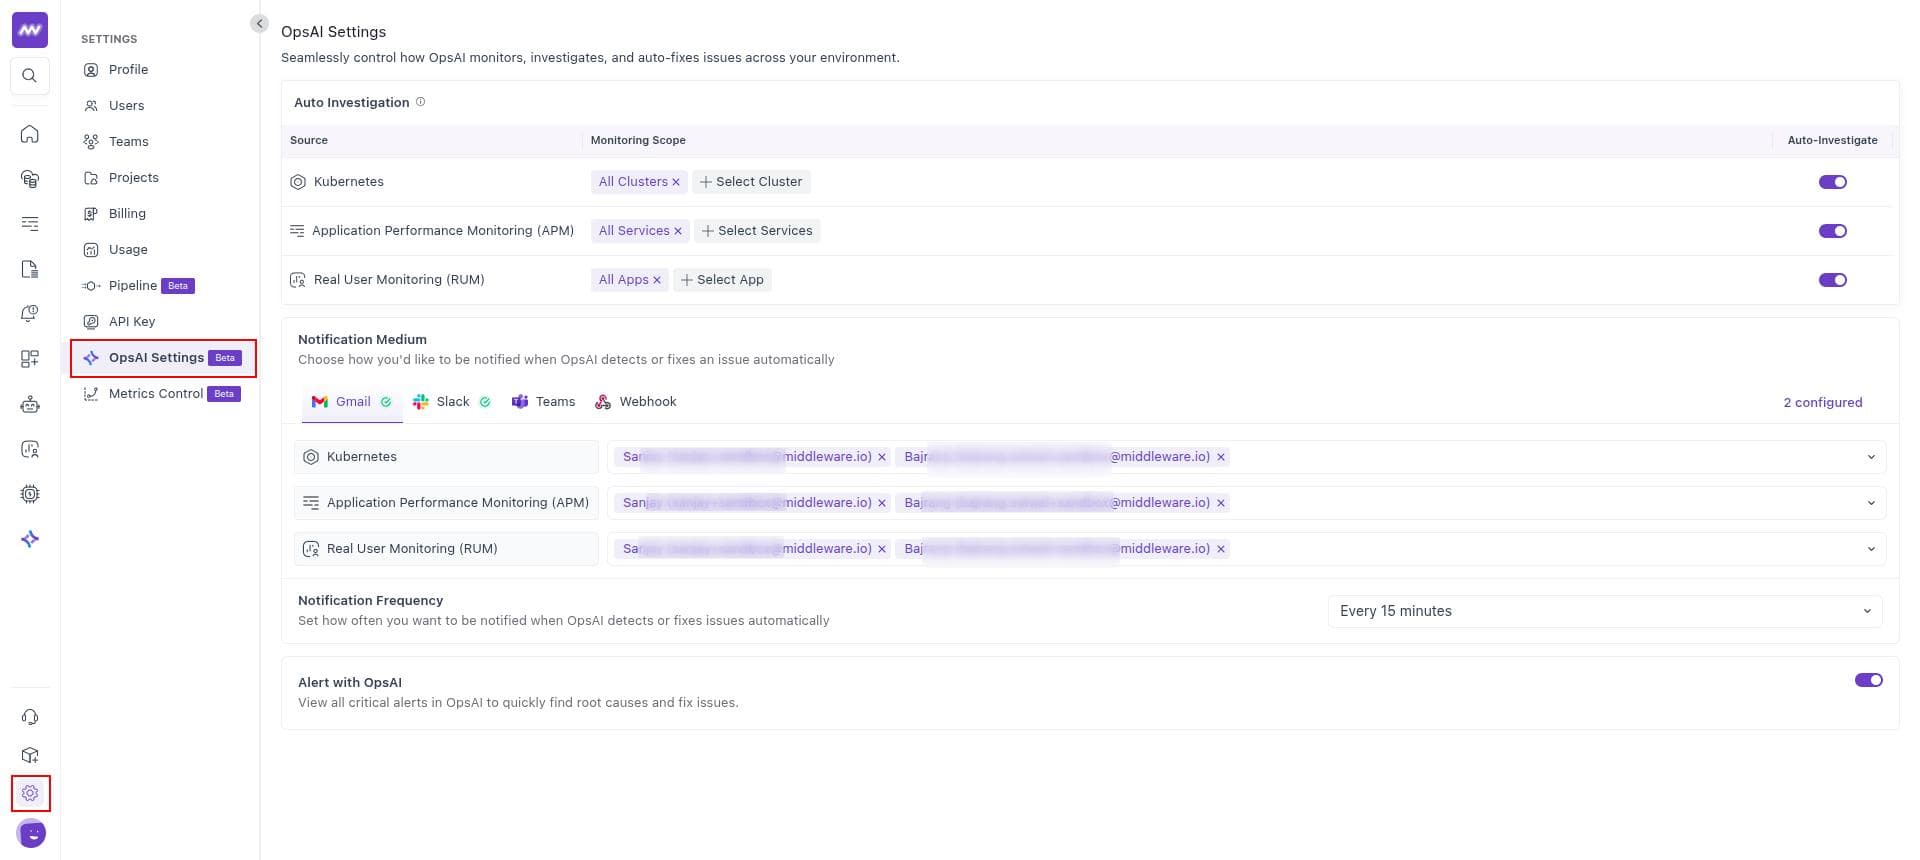
Go to Settings → OpsAI Settings.
This page is divided into four sections: Auto Investigation, Notification Medium, Notification Frequency, and Alert with OpsAI.
Auto Investigation#
The Auto Investigation section lists every source OpsAI can monitor. For each source, you define the Monitoring Scope (which entities to watch) and enable or disable Auto-Investigate:
- Kubernetes: Set the Monitoring Scope to All Clusters, or select the Specific Clusters you want OpsAI to watch, then flip the Auto-Investigate toggle.
- Application Performance Monitoring (APM): Choose All Services as the Monitoring Scope, or narrow it down to the Specific Services that are relevant, and turn on the Auto-Investigate toggle.
- Real User Monitoring (RUM): Keep the Monitoring Scope at All Apps, or pick the Specific Apps you care about, and enable the Auto-Investigate toggle.
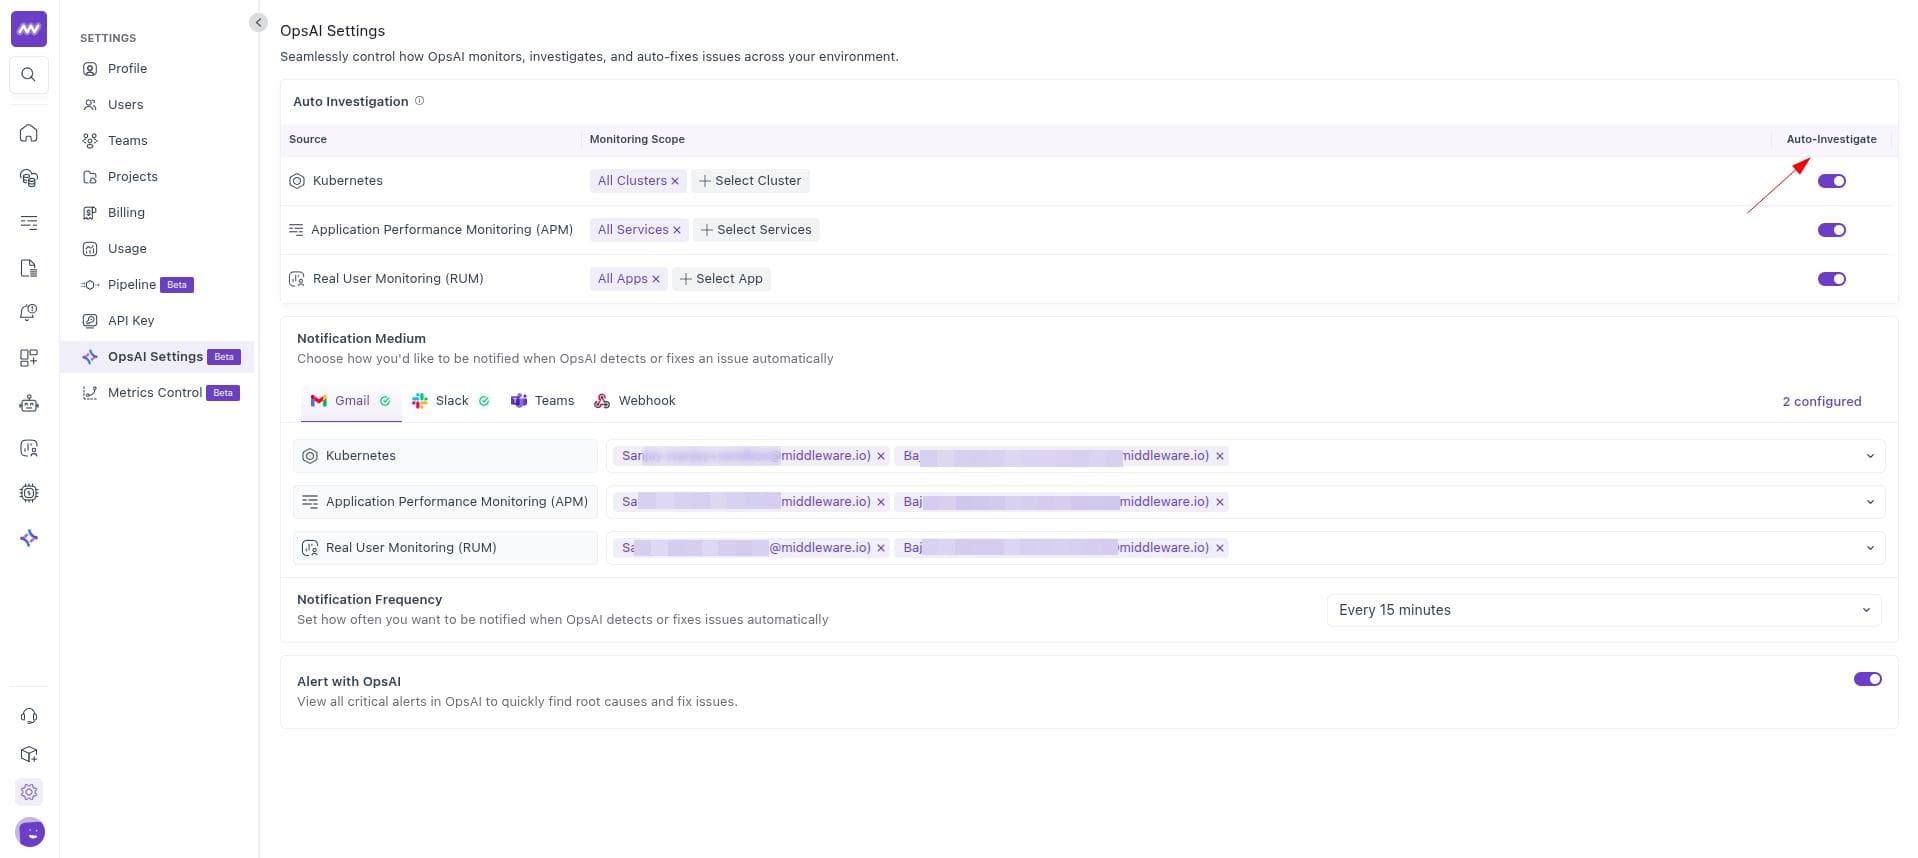
When Auto-Investigate is enabled for a source, OpsAI automatically investigates issues within the defined scope and proposes a fix. You remain in control and decide whether to apply it.
Set the scope per source#
Each source has its own scope, so you can keep OpsAI focused on the workloads that matter:
- Kubernetes: Keep All Clusters, or click Select Cluster to pick one or more specific clusters. Only clusters where the agent is installed with
opsai.enabled=trueappear in this list. - APM: Keep All Services, or click Select Services to choose the specific backend services OpsAI should auto-investigate.
- RUM: Keep All Apps, or click Select App to choose the specific RUM applications OpsAI should auto-investigate.
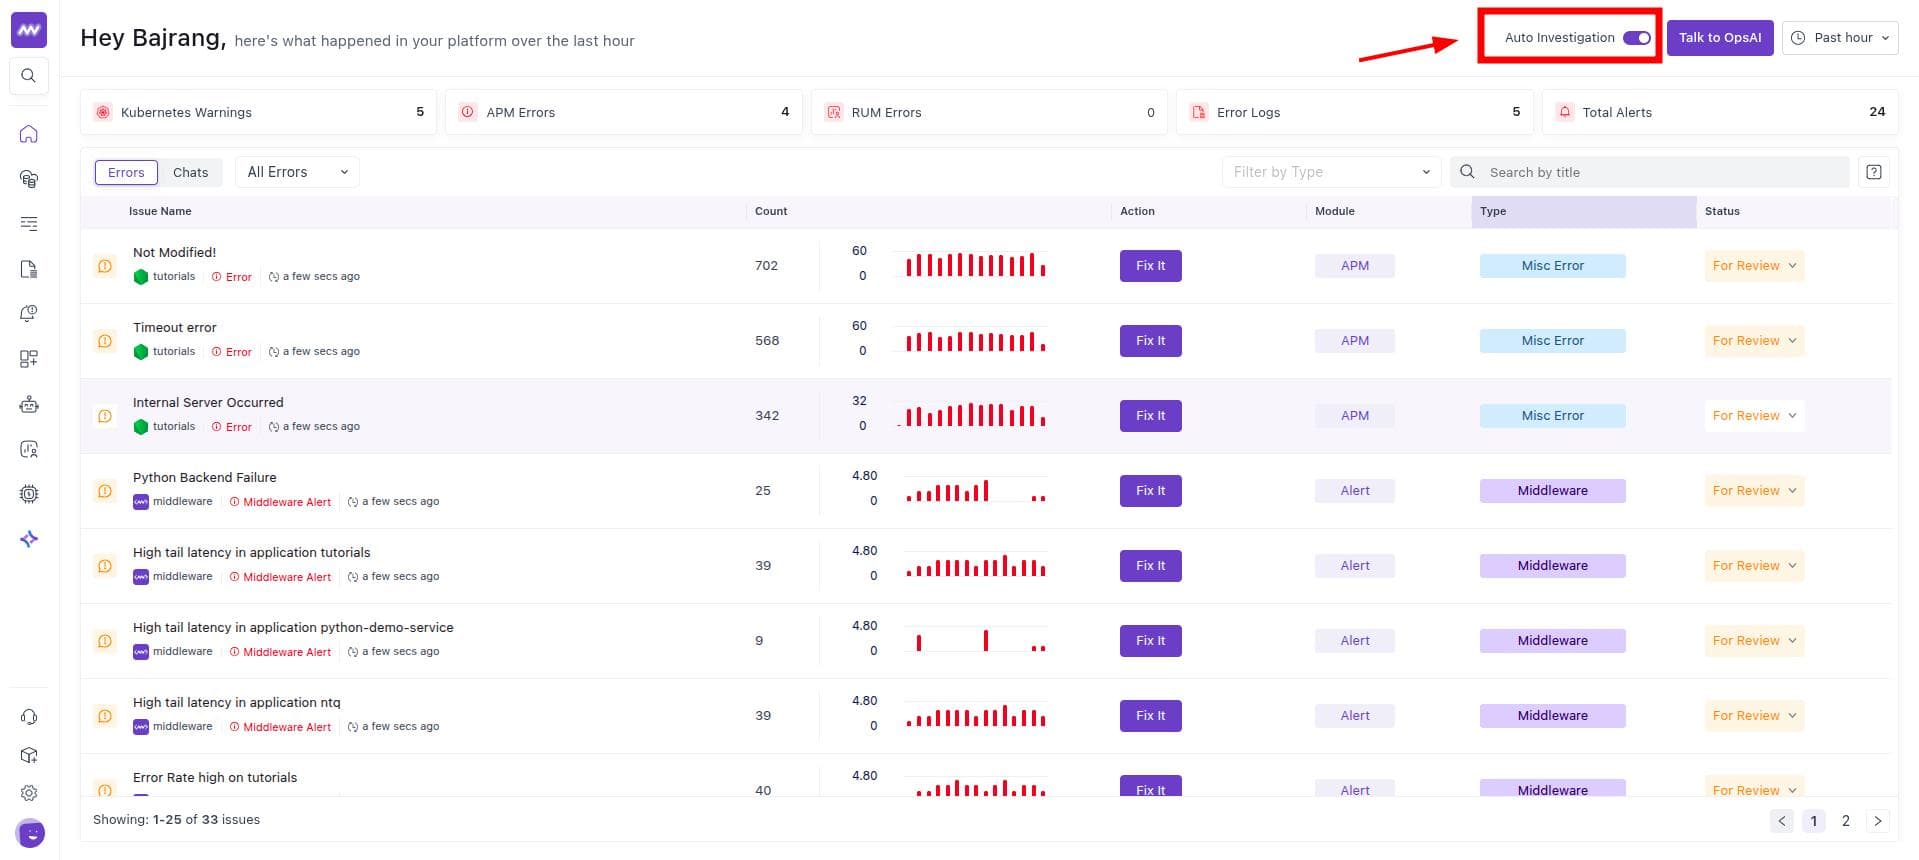
Enable all automation in one click: From the main OpsAI dashboard you can toggle a single button that turns on Auto-Investigation across all sources at once. The per-source controls on this Settings page let you fine-tune the scope and turn individual sources on or off after that.
Ask OpsAI Follow-Up Questions in Slack#
When Auto-Investigate identifies an issue and Slack is configured as a notification medium, you can continue the investigation directly from the Slack alert thread:
Auto-Investigate detects an issue and performs root cause analysis.
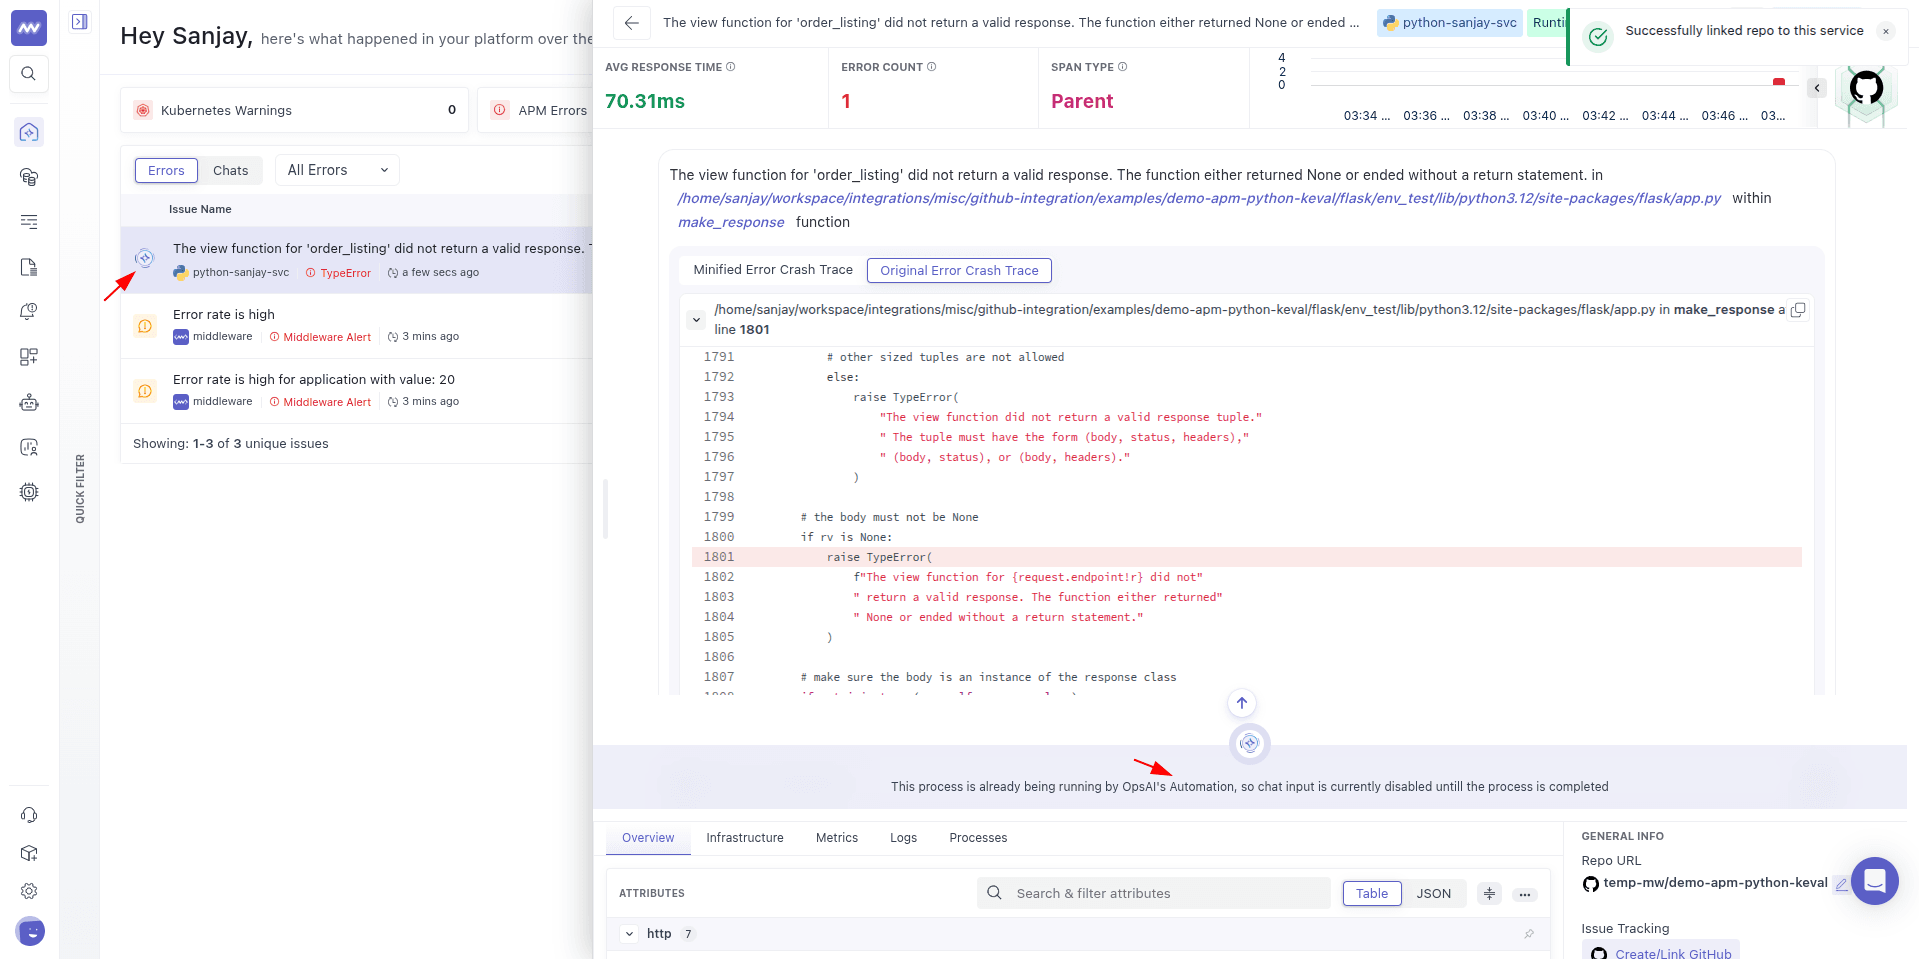
OpsAI posts its RCA as a threaded reply under the original Slack alert.
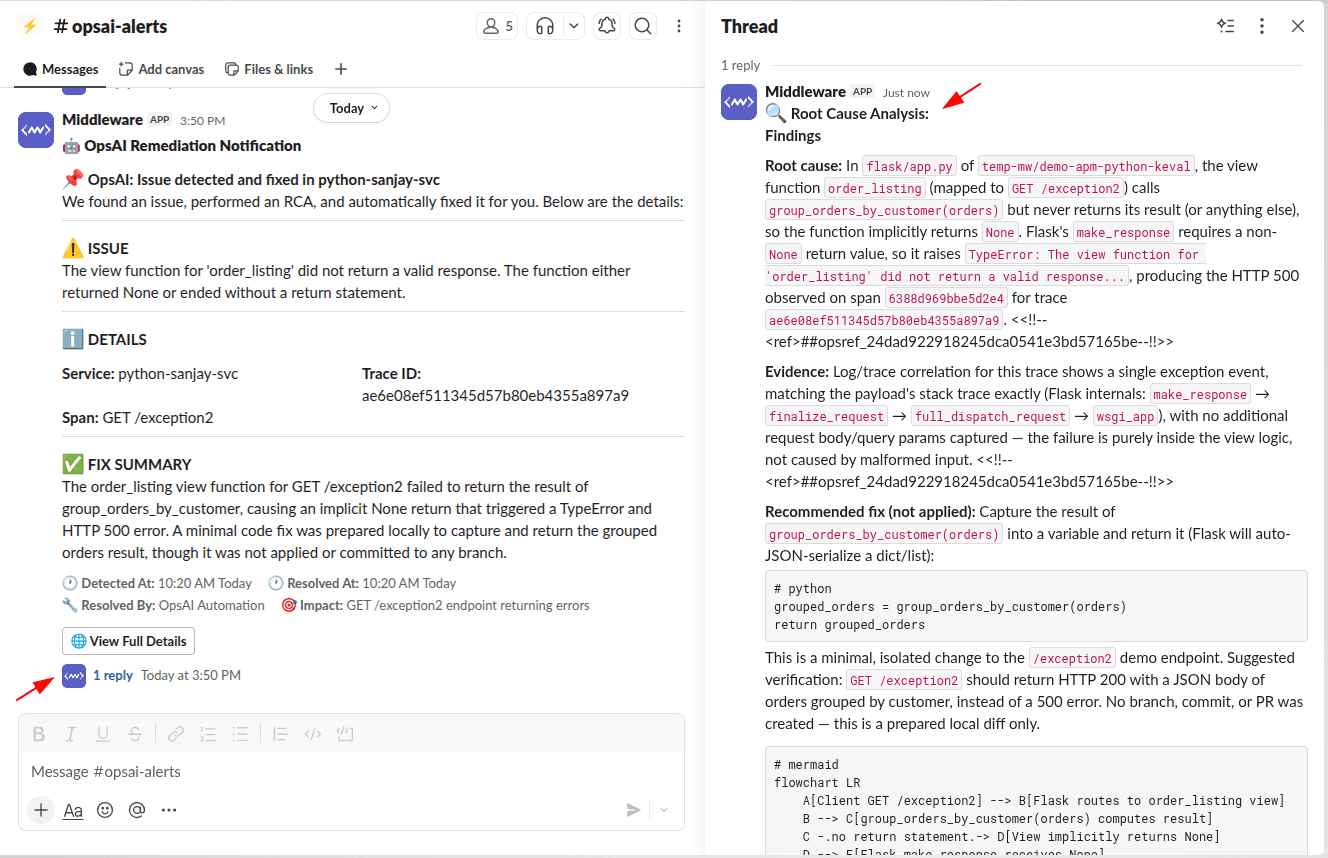
Reply in the same thread and mention
@Middlewarewith your question. OpsAI displays a live status indicator while investigating.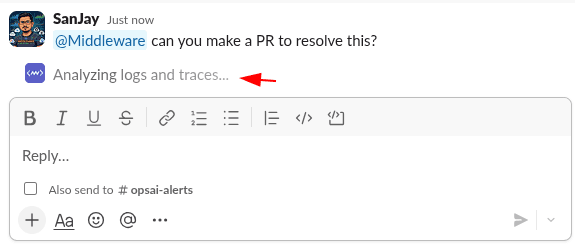
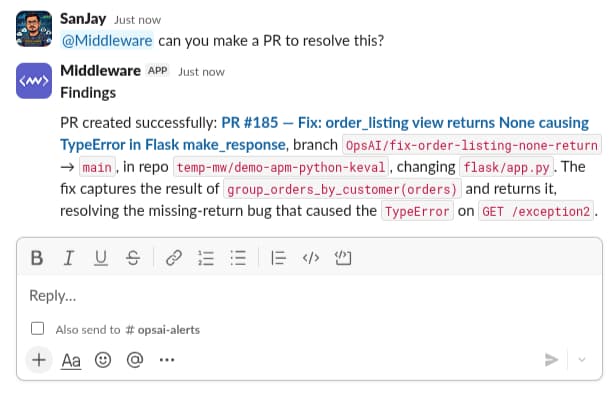
OpsAI posts its answer in the same thread when the investigation is complete.
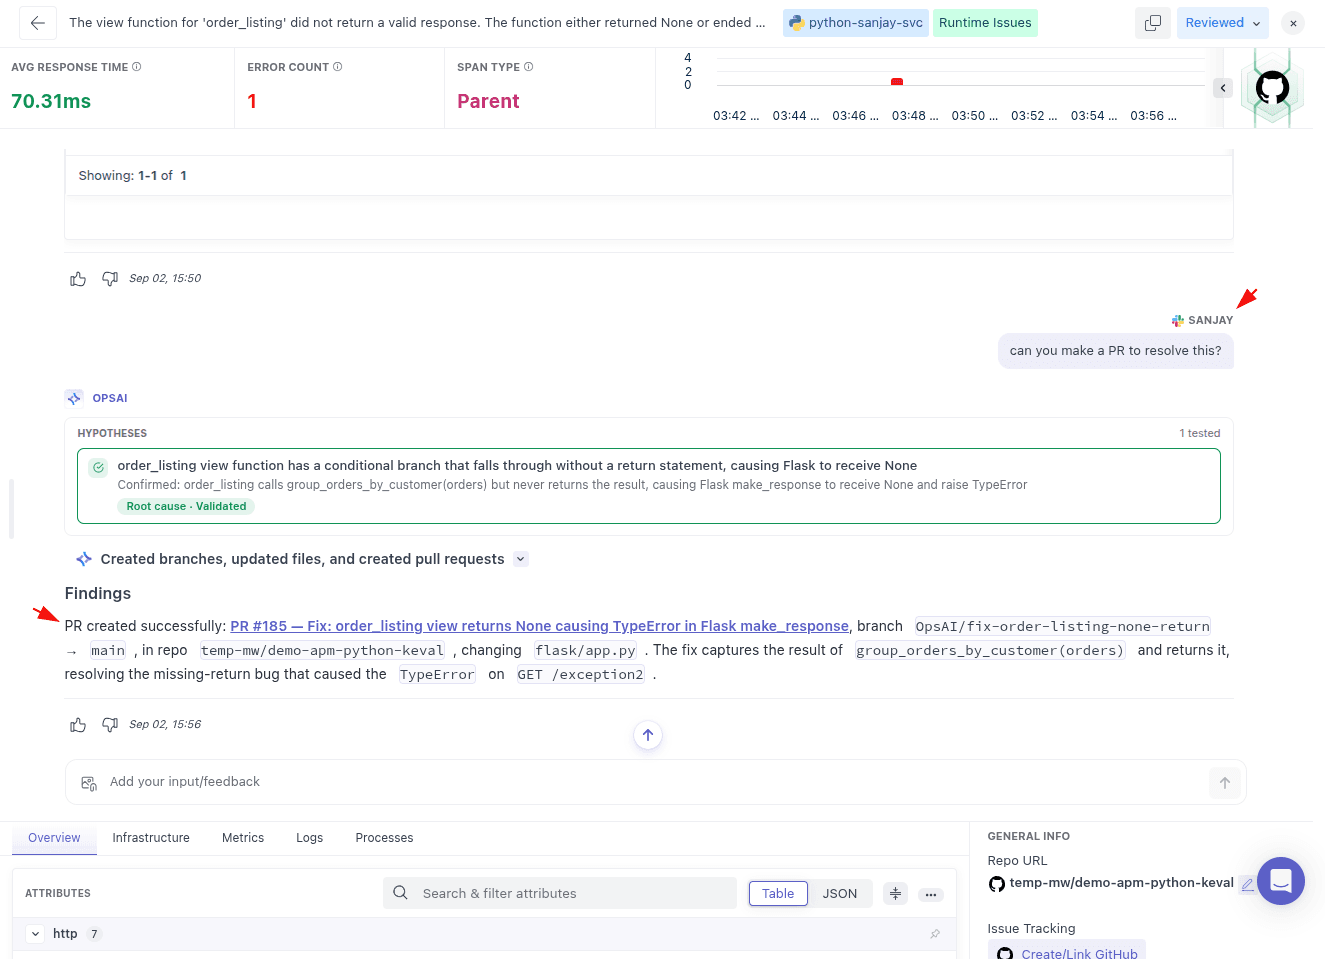
You can also view the conversation in the OpsAI chat window inside Middleware.
Following up like this requires an explicit @Middleware mention, and works inside an OpsAI incident thread specifically. See the Slack Integration documentation for setup instructions, permissions, retention limits, usage limits, and other considerations.
Chat with OpsAI Anytime in Slack#
You're not limited to incident threads. Once Slack is connected, you can also:
- Start a General Conversation: Mention
@Middlewarein any channel, or send it a direct message, to ask about your observability data without an alert or incident. - Ask about an Alert: Reply and mention
@Middlewareunder a plain alert notification thread — one that hasn't triggered an OpsAI incident — to investigate it directly.
General conversations route to your account's default project unless you choose another one under Integrations → Slack → Route general chats to, or with the /middleware set project command.
See Start a General Conversation with OpsAI in Slack and Ask About a Specific Alert in Slack for full details.
Notification Medium#
Notification settings apply across all OpsAI sources. Choose how you want to be notified when OpsAI detects or investigates an issue.
You can configure one or more notification mediums:
- Gmail
- Slack
- Microsoft Teams
- Webhook
For each medium, you can assign recipients by source, including Kubernetes, APM, and RUM. This ensures that the right teams receive notifications for the issues relevant to them.
A Configured badge indicates how many notification mediums are currently set up.
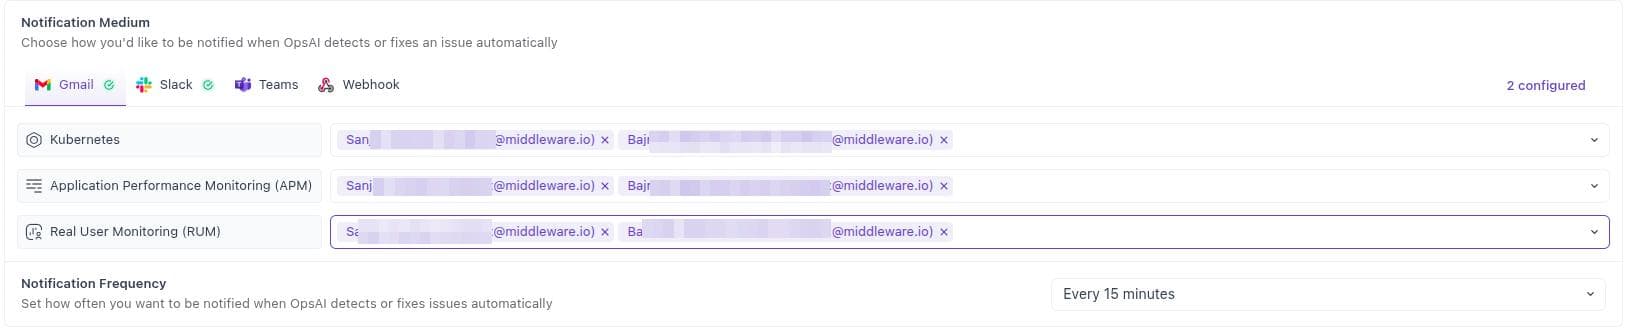
For Slack, you can also continue an OpsAI investigation directly from the alert thread. Mention @Middleware with your question, and OpsAI will respond in the same thread. See Slack Integration for more details.
Notification Frequency#
Choose how frequently OpsAI sends notifications.
With Immediate (Real-time) selected, you receive a notification as soon as OpsAI detects or investigates an issue.
Alternatively, select a notification interval, such as every 15 minutes. OpsAI will consolidate issues detected during that period into a single notification.
Confirm Changes#
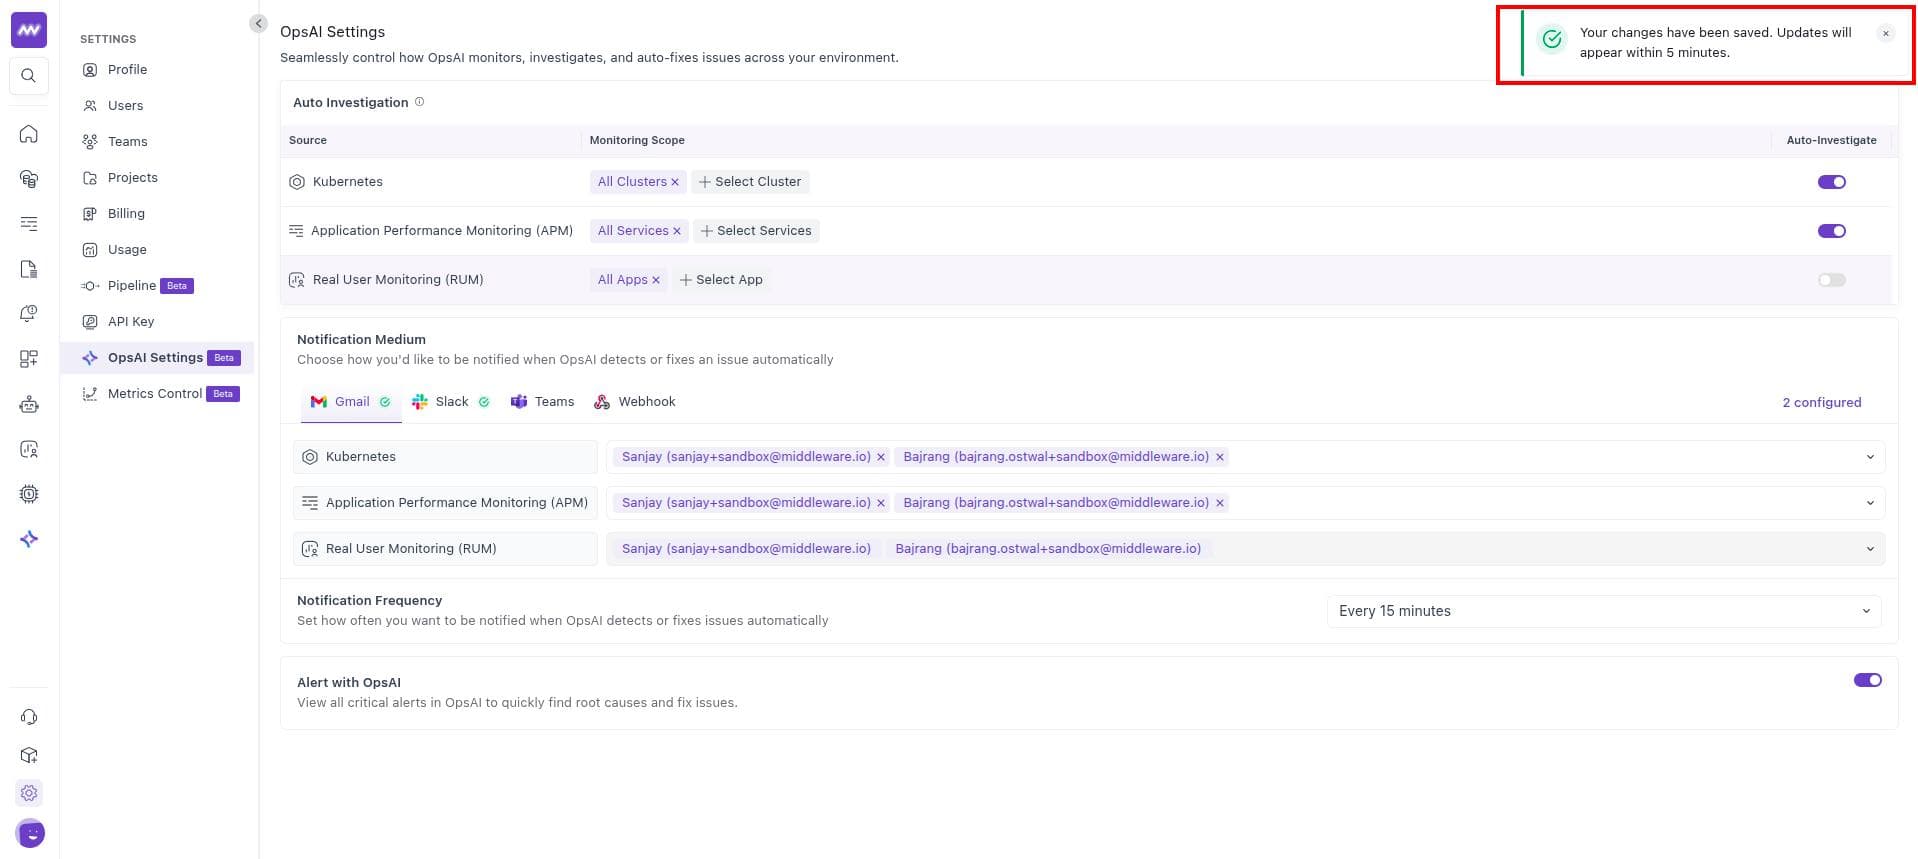
After you change the monitoring scope, toggle Auto-Investigate, or update notification settings, a confirmation message appears:
Your changes have been saved. Updates will appear within 5 minutes.
Import Alerts into OpsAI#
OpsAI can centralize alerts from Middleware, Grafana, and Datadog, allowing you to investigate them from the OpsAI interface. Alerts can appear in OpsAI in two ways: through native Middleware alert ingestion or supported third-party integrations.
A. Native Middleware Alerts#
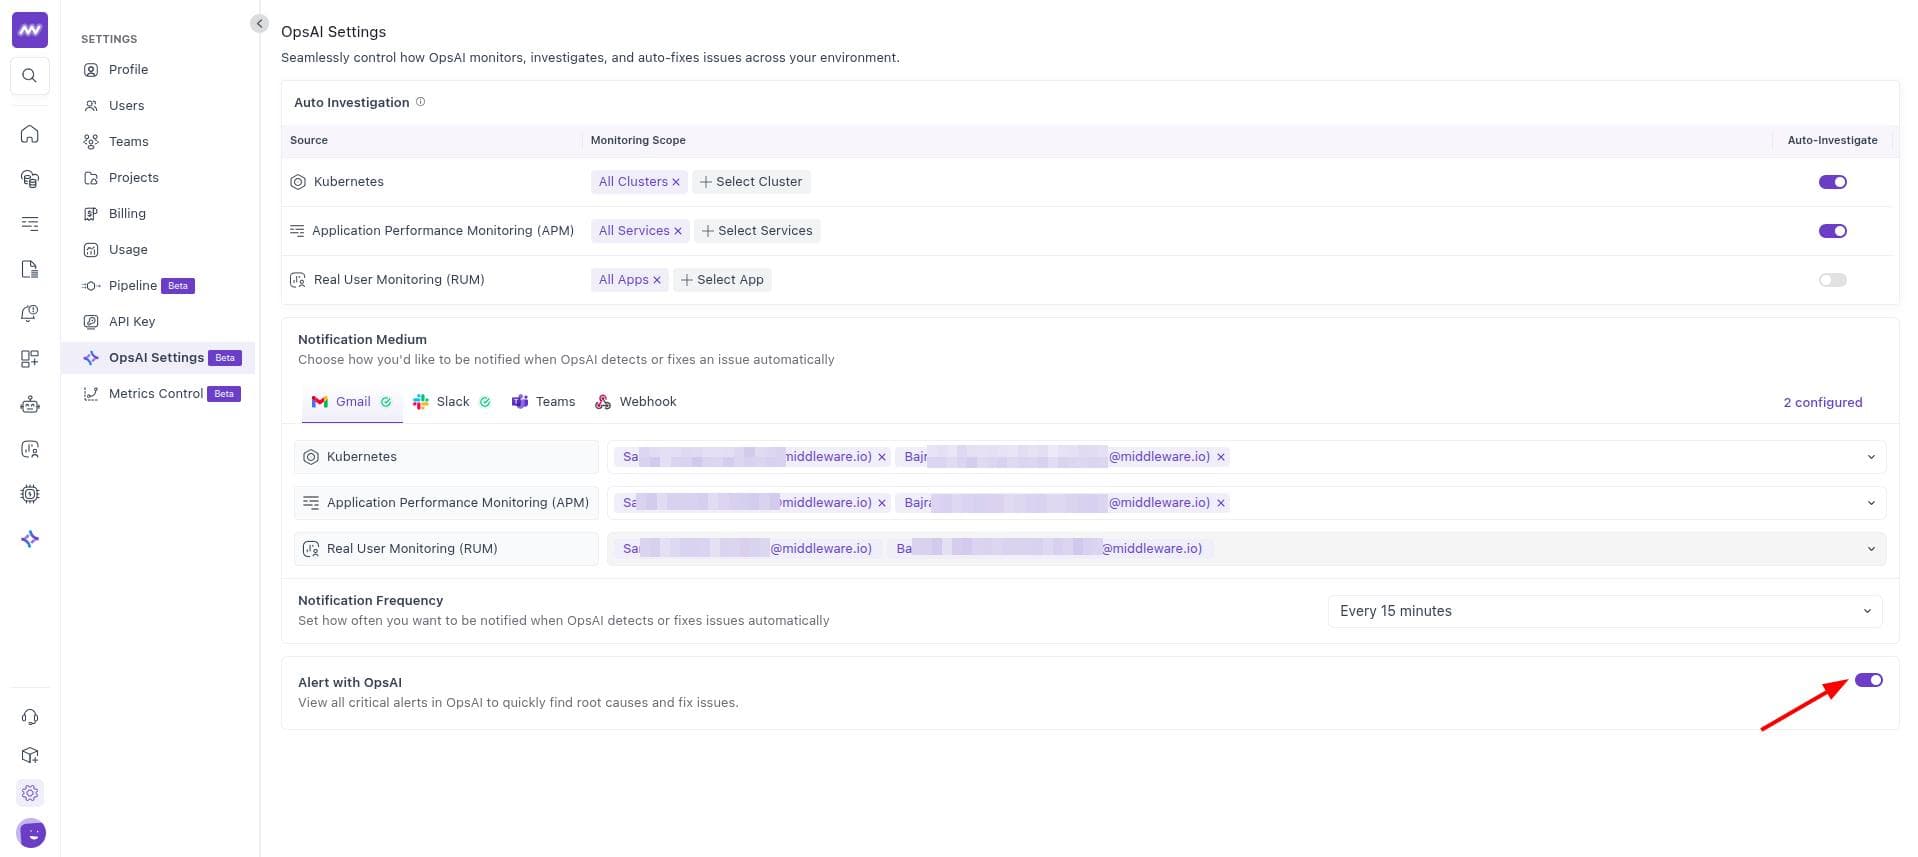
Go to Settings → OpsAI Settings and enable the Alert with OpsAI toggle.
B. Import Alerts from Third-Party Integrations#
To bring Grafana or Datadog alerts into OpsAI:
Grafana: Connect Grafana and configure a webhook using a Contact Point and Notification Policy to send alerts to Middleware. You can then use OpsAI to investigate those alerts with the available Grafana telemetry.
Datadog: Connect Datadog to ingest supported alerts. OpsAI can then investigate Monitor and Kubernetes alerts using the available metrics, logs, and traces.
Tips and Troubleshooting#
Cluster not listed: Verify that the agent is installed with
opsai.enabled=trueand that the cluster name is configured correctly.Service or app not listed: Confirm that the APM service or RUM app is instrumented and actively reporting data to Middleware.
Nothing appears in OpsAI: Verify that Auto-Investigate is enabled for the source and that at least one entity is included in its Monitoring Scope.
Need assistance or want to learn more about Middleware? Get in touch with us via our Contact Us or join our Slack channel.