Connect with Traces (Databases)
Use the APM → Database view to go from a slow/expensive SQL statement to the exact application traces that executed it. This page explains the flow and the data you’ll see at each step, in simple terms.
Before You Begin#
- APM agent installed on your service(s) that talk to the database. This lets us create DB spans inside traces.
- Database telemetry enabled on the DB host/instance (e.g., stats extensions/DMVs). This powers the Database screens (counts, duration, rows, etc.).
The Flow#
1. Open the Database Overview (screenshot 1)#
Go to APM → Database → choose a database instance.
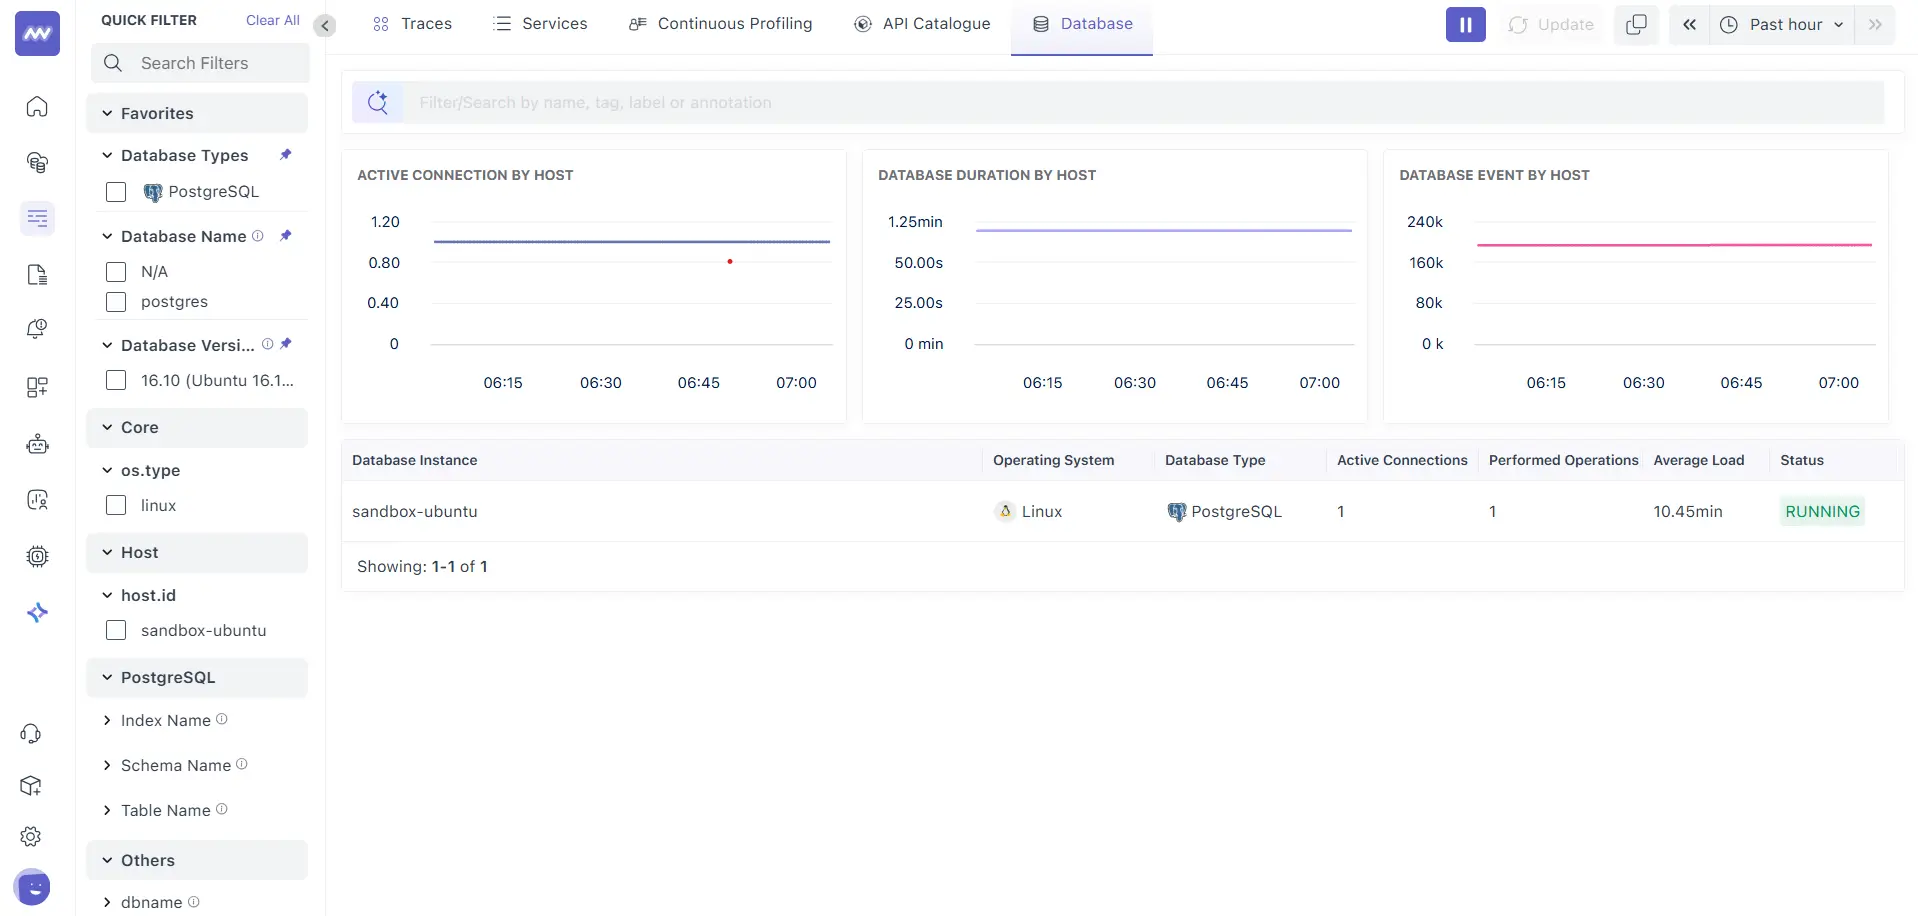
At a glance, you’ll see:
- Active connections by host
- Database duration by host (how much time your DB is spending on work)
- Events/operations by host. Use the left filters (database type, version, host, dbname) to narrow the view.
2. Pick a Query to Investigate#
You’ll land on a query table for the selected instance. Sort by Total Duration or Count to find the most impactful SQL.
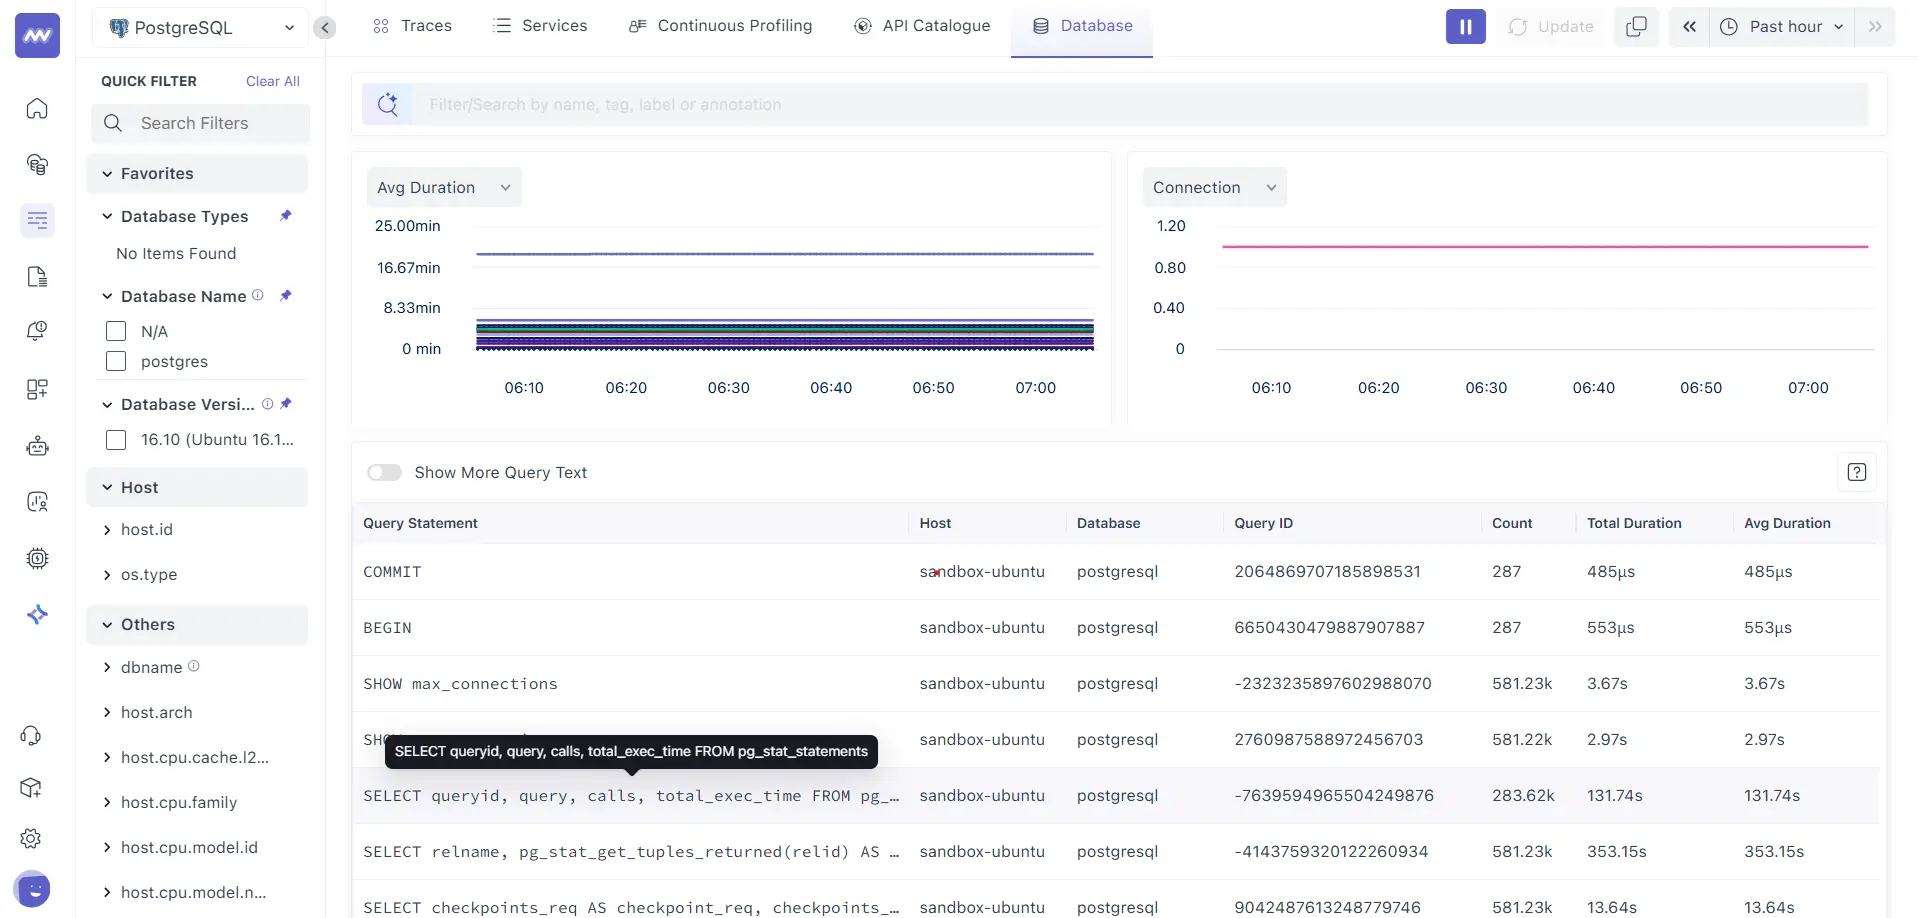
Columns (what they mean):
- Query Statement: The normalised (sanitised) SQL text.
- Host / Database: Where it ran.
- Query ID / Signature: A stable hash of the normalised SQL (used to correlate).
- Count: Number of executions in the selected time window.
- Total Duration: Total wall-clock time spent executing this SQL.
- Avg Duration: Average time per execution.
Click a row to drill in.
3. Query Information#
This panel explains the query and shows the impact over time.
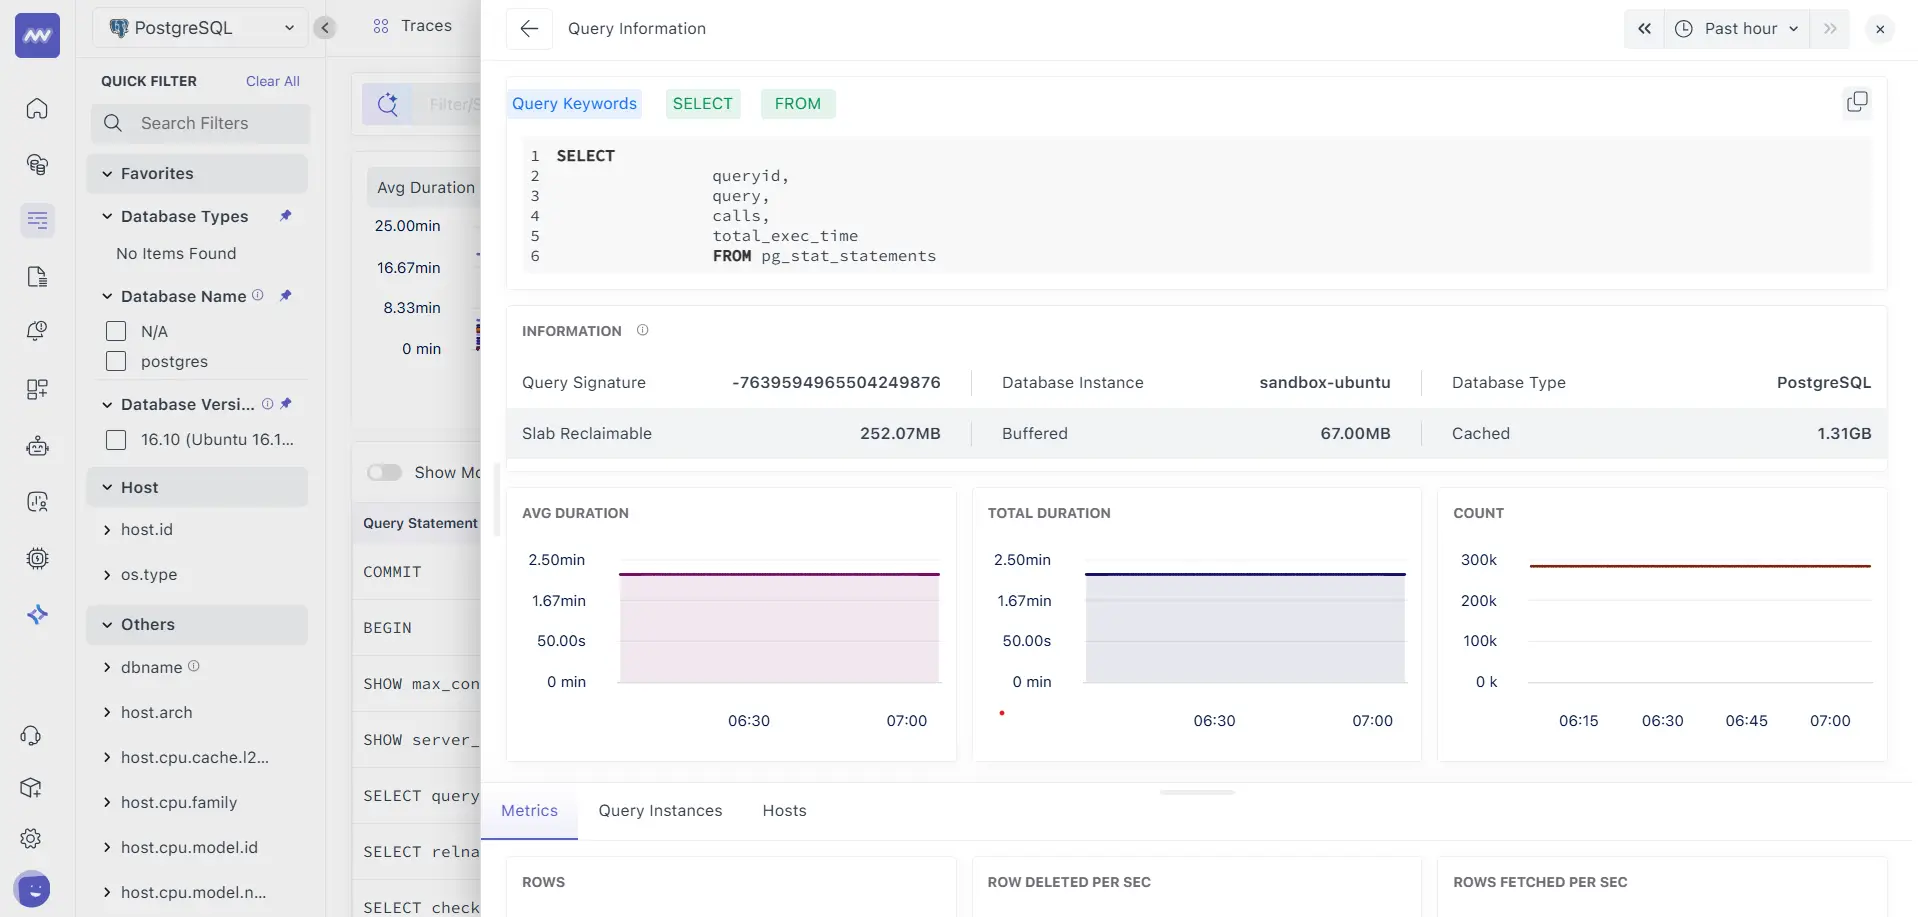
- Query Keywords / Normalised SQL: The canonical form we use for grouping.
- Query Signature: The correlation key we also attach to trace spans.
- Instance & Type: Which DB host and engine (e.g., PostgreSQL).
- Host memory context: Slab Reclaimable, Buffered, and Cached give you a quick read on host-level file cache/OS memory pressure that can affect query latency.
- Metrics cards
- Avg Duration: Average execution time trend.
- Total Duration: Cumulative time trend.
- Count: Executions trend.
Tabs below:
- Metrics: Row activity KPIs (e.g., Rows, Rows fetched/sec, Rows deleted/sec, engine-specific counters when available).
- Query Instances: Every execution of this SQL with timestamp and duration
- Hosts: Where this query ran and how often.
4. Query Instances#
It gives you a chronological list of individual executions of the selected SQL.
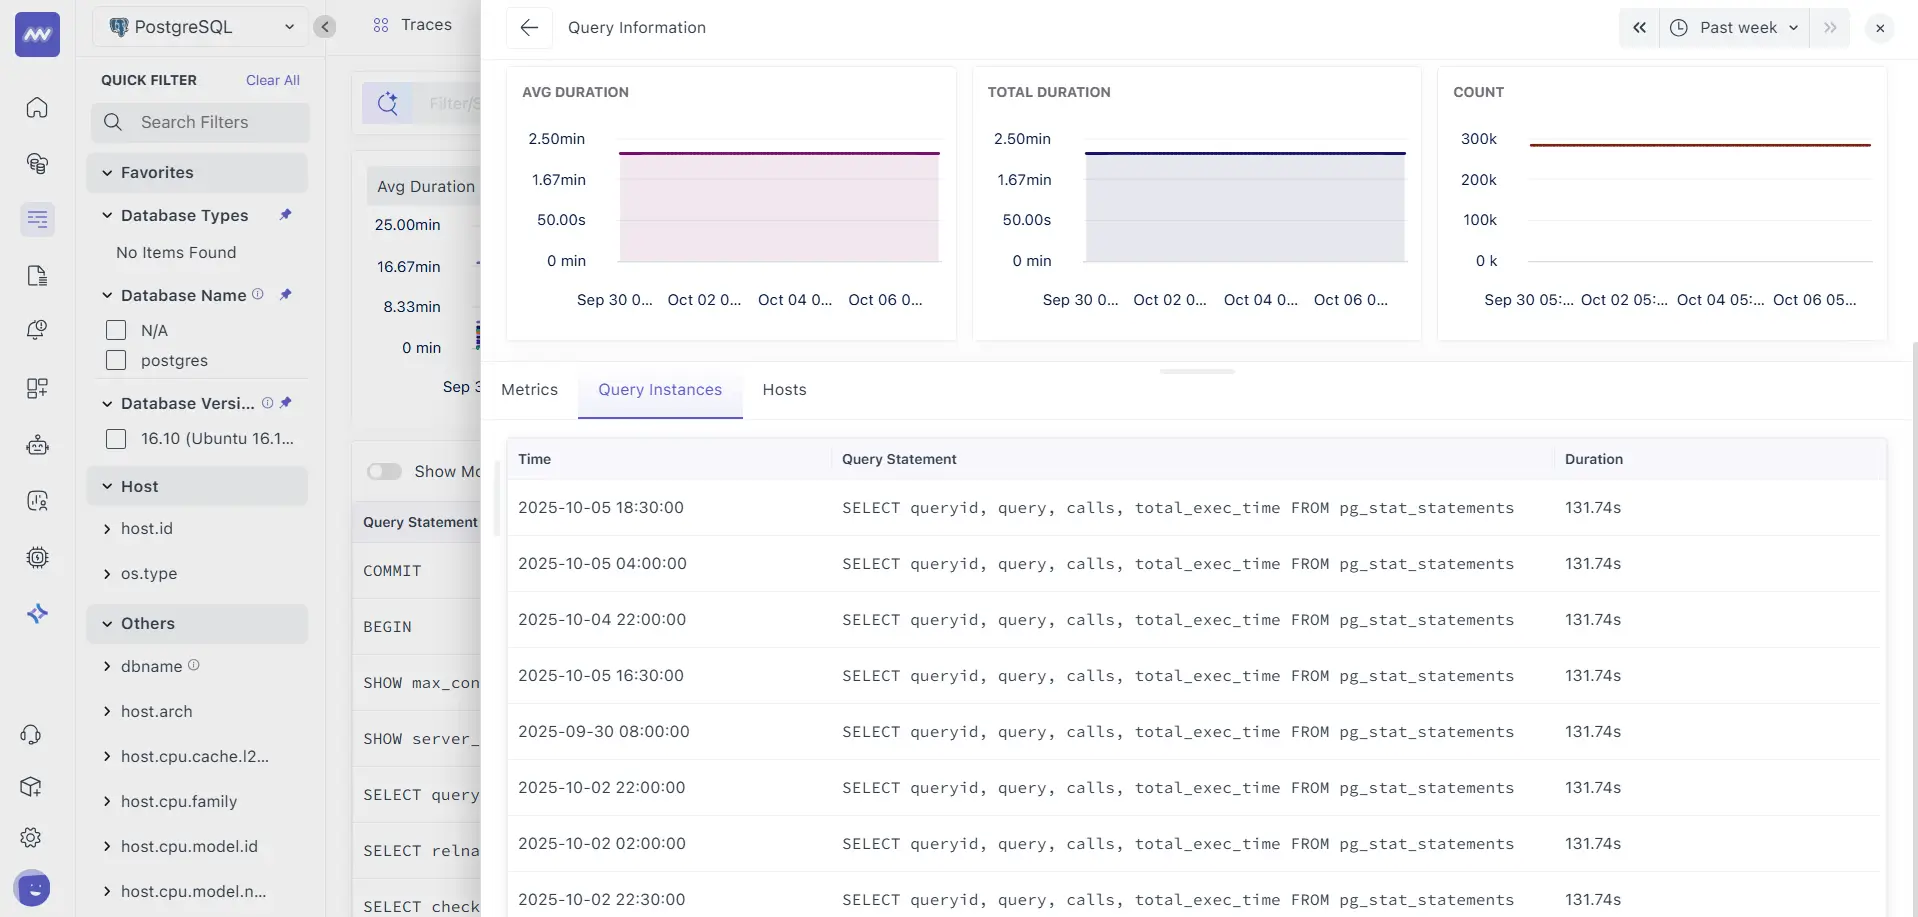
- Time: When that execution happened.
- Query Statement: The normalised SQL.
- Duration: How long did the execution took.
Connect with traces: pick an instance by time, then switch to APM → Traces (same time window) and filter by:
database.type(e.g.,postgresql)database.instance(your host/instance name)db.query_signature(the value shown on the Query Information card)
Because the same db.query_signature is attached to DB spans inside traces, you’ll see all traces that executed this exact SQL, with full service → endpoint → DB waterfall.
What Data do We Collect from Your Database?#
We collect two complementary streams and stitch them together:
1. Database-side query metrics (engine/host level)#
Grouped by the normalised statement (Query Signature) and instance:
- Executions (Count)
- Total & Average Duration
- Rows activity (e.g., fetched/sec, deleted/sec) where the engine exposes them
- Connections/active sessions
- Host cache/memory context (Buffered, Cached, Slab Reclaimable) to spot I/O pressure
These are ideal for finding hot SQL and understanding overall load.
2. Application Traces (service level)#
Created by your APM agent when code calls the DB driver. Each execution becomes a DB span inside a trace with attributes such as:
service.name: Which service issued the querydb.system: Database engine (postgresql, mysql, mssql, etc.)db.name/database.instance: Database and hostdb.operation: Operation type (SELECT/INSERT/UPDATE/DELETE…)db.statement: Sanitised SQL (no sensitive values)db.query_signature: Same hash used on the Database pagenet.peer.name/net.peer.port: Where it connected- duration, status, and any error details
These are ideal for explaining why the query ran (which endpoint, which user path, which code), and for reproducing call stacks.
Troubleshooting#
- No data on Database pages
- Confirm the DB integration/telemetry is enabled on the host/instance.
- Check network egress/ingress rules from the DB host to Middleware.
- Mismatch between Count and traces list
- The Database page shows all executions observed at the engine; traces show application-instrumented executions. System/background queries may appear in DB metrics without corresponding app traces.
- High Avg Duration but low Count
- Likely a rare but slow query. Use the Query Instances tab to pinpoint exact timestamps, then pivot to traces with those times to see the calling code.
Need assistance or want to learn more about Middleware? Contact our support team at [email protected] or join our Slack channel.