Vercel
Overview#
The Middleware integration with Vercel enables seamless observability for your Vercel deployments without requiring any code changes. By installing the Middleware app from the Vercel Marketplace, you gain access to comprehensive log and trace data from your applications, all centralized in the Middleware platform.
This integration leverages Vercel's Log Drain and Trace Drain capabilities to automatically forward observability data from your selected projects. The integration supports all Vercel log sources and provides automatic correlation between logs and traces through Trace ID and Span ID, enabling you to debug issues more effectively by viewing related data together.
Prerequisites#
Before setting up the integration, ensure you have:
1 Vercel Account#
A Vercel Pro or Enterprise account is required. The integration is not available for free-tier accounts.
Installation#
The integration process is straightforward and requires no code modifications. Follow these steps to connect your Vercel account with Middleware.
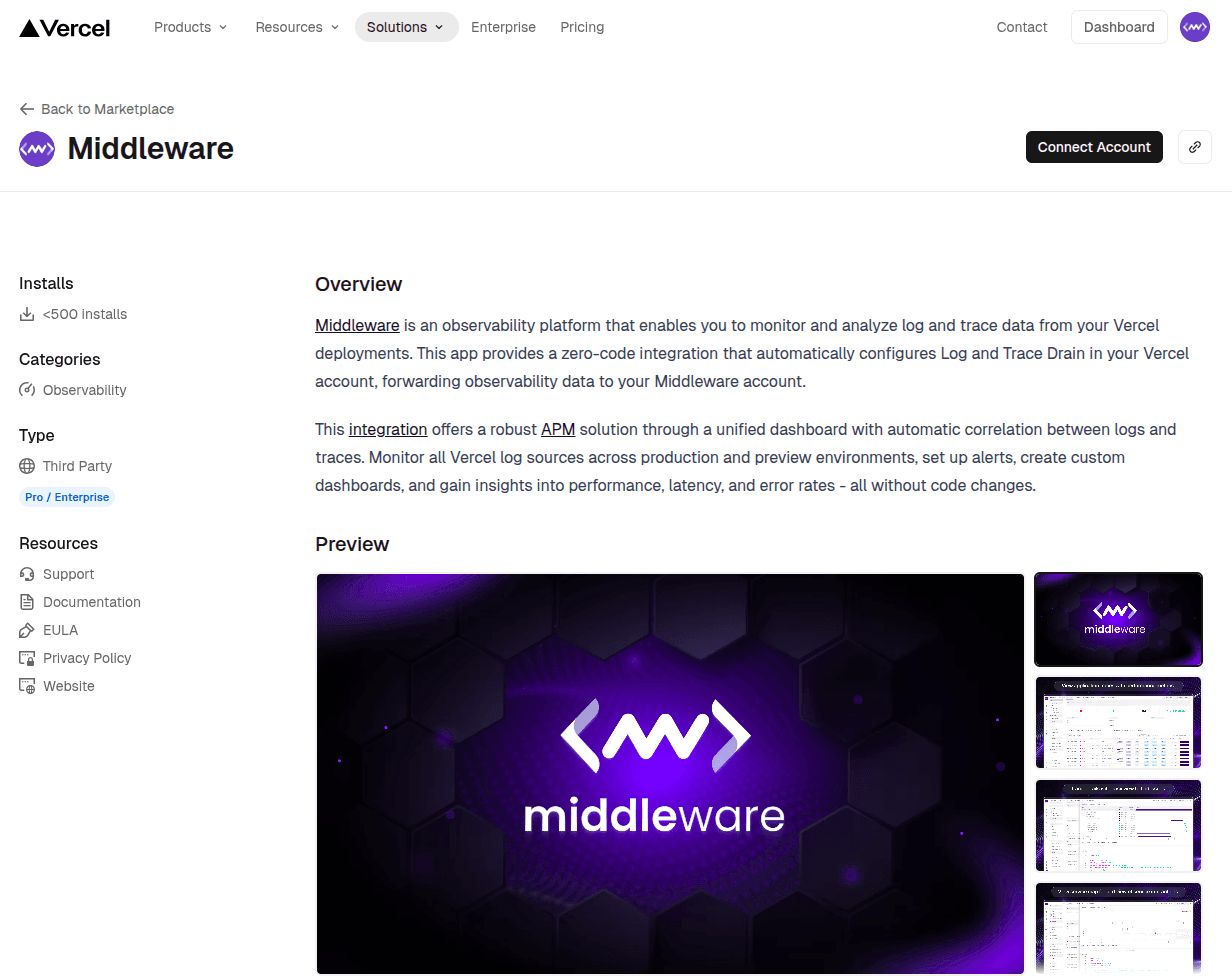
1 Access the Middleware App#
Navigate to the Middleware app on the Vercel Marketplace, which is listed under the Observability category. You'll see the Middleware integration listing with installation options.
2 Select Your Vercel Team#
When you click Install, you'll be prompted to select which Vercel team to connect. If you're part of multiple teams or organizations, choose the team that contains the projects you want to monitor.
3 Choose Projects to Monitor#
Select the specific Vercel projects you want to integrate with Middleware. You can select multiple projects during the initial setup. These projects will have their Log Drain and Trace Drain automatically configured.
You can add or remove projects from monitoring later through Vercel's integration settings.
4 Grant Required Permissions#
Review and approve the permissions that Middleware requires. These permissions enable Middleware to:
- Read project metadata for proper data visualization
- Configure Log Drain & Trace Drain settings in your Vercel account
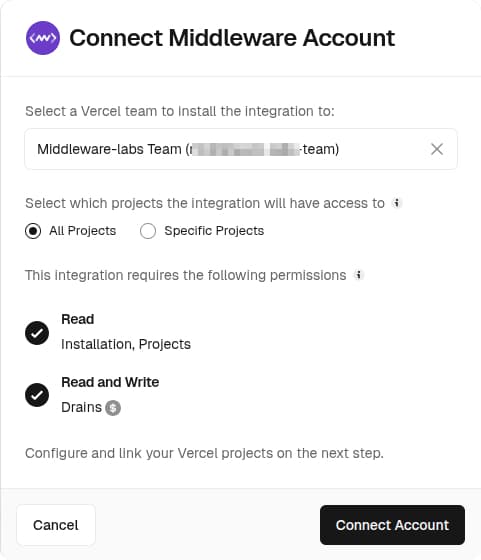
These permissions are essential for the integration to function. Without them, Middleware cannot configure the necessary drains or access your project data.
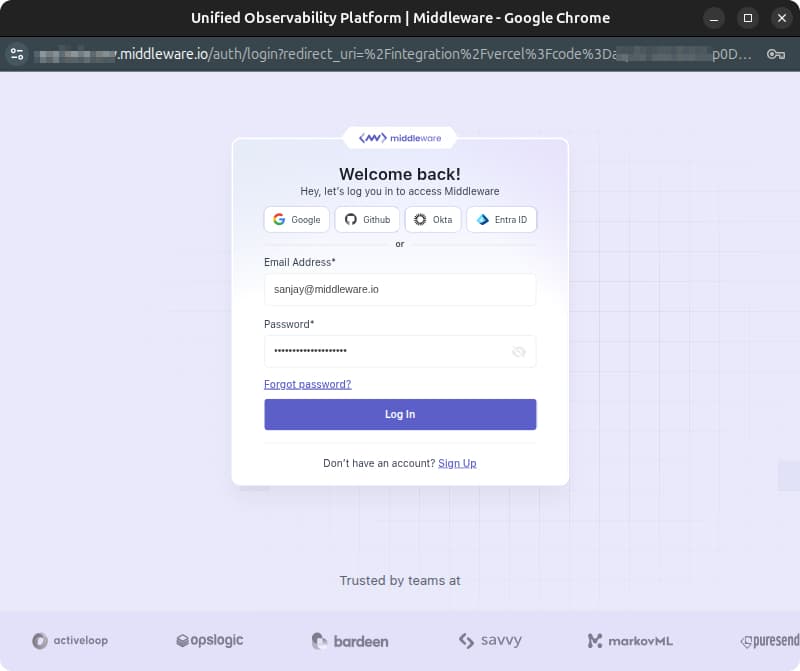
5 Authenticate with Middleware#
You'll be redirected to the Middleware login page to authenticate your account. Sign in with your Middleware credentials to complete the connection.
6 Confirmation Screen#
After successful authentication and setup, you'll see a confirmation screen indicating that the integration is complete.
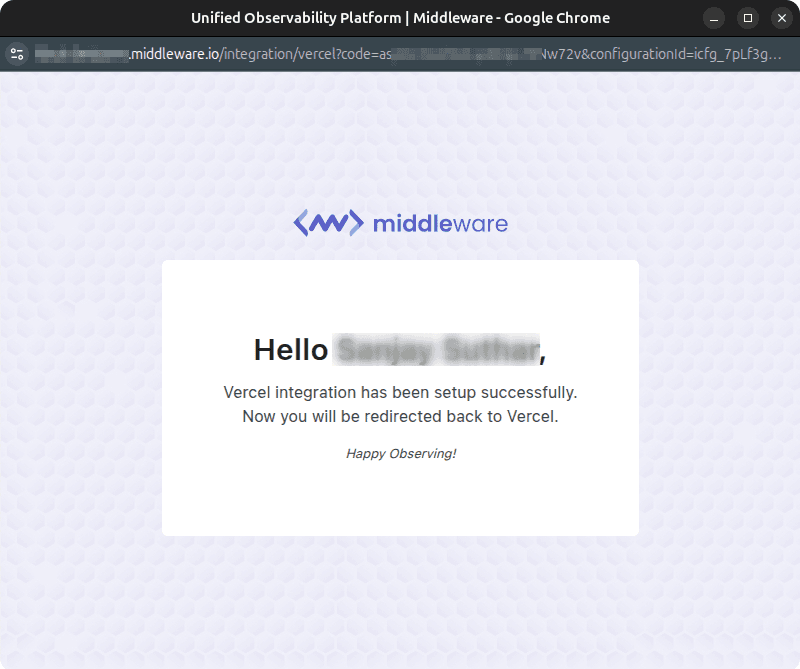
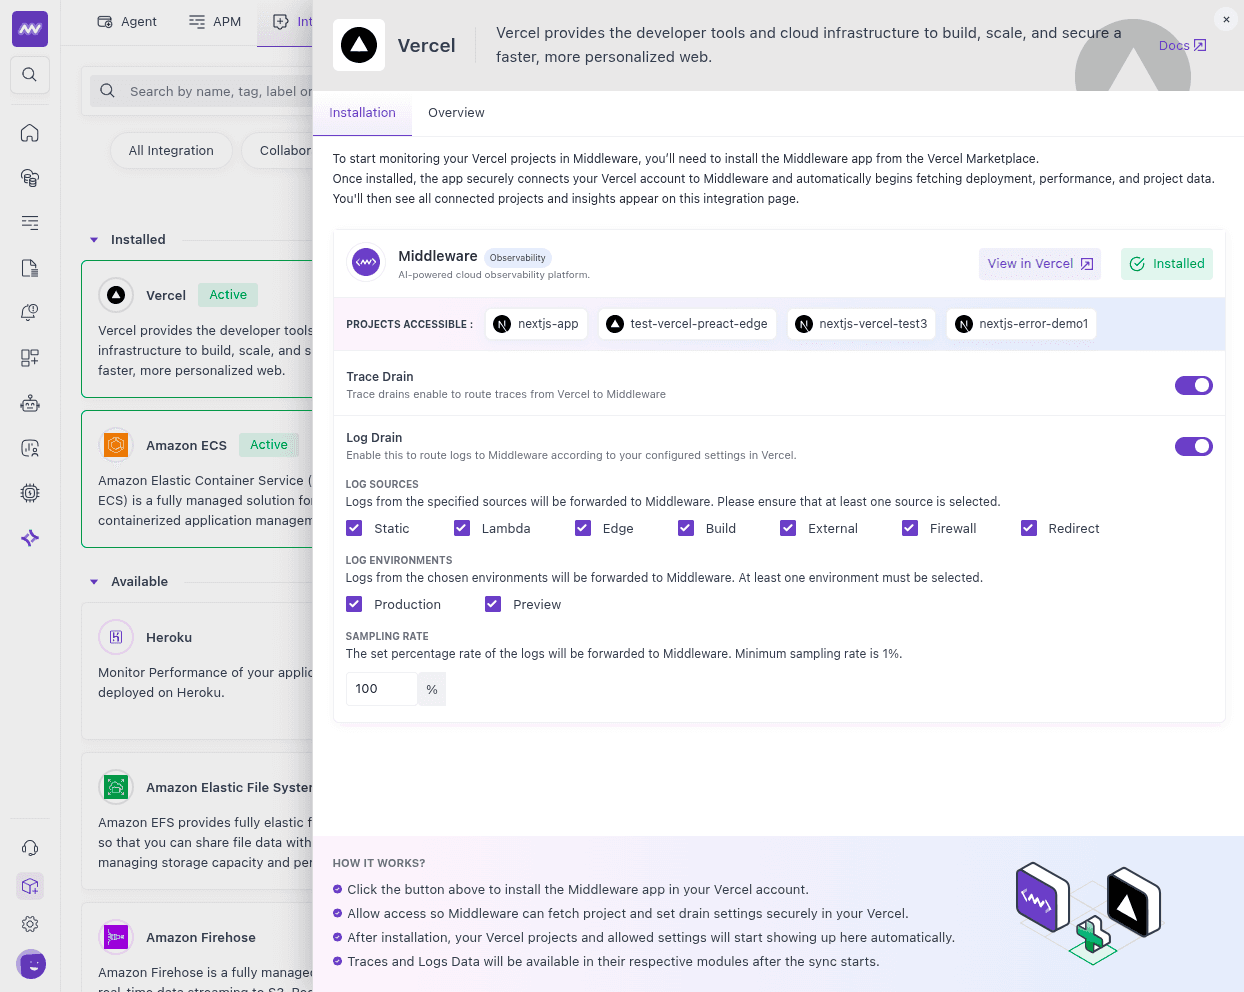
The integration is now active. Middleware will automatically configure both Log Drain and Trace Drain in your Vercel account from all sources and environments initially, but later you can modify sources, environments, and sampling rate from Middleware's Installation → Integration → Vercel. Data will begin flowing to your Middleware account shortly. You can verify the app installation in your Vercel's Integrations tab as well.
How the Integration Works#
Once installed, the Middleware app performs the following automatic configurations:
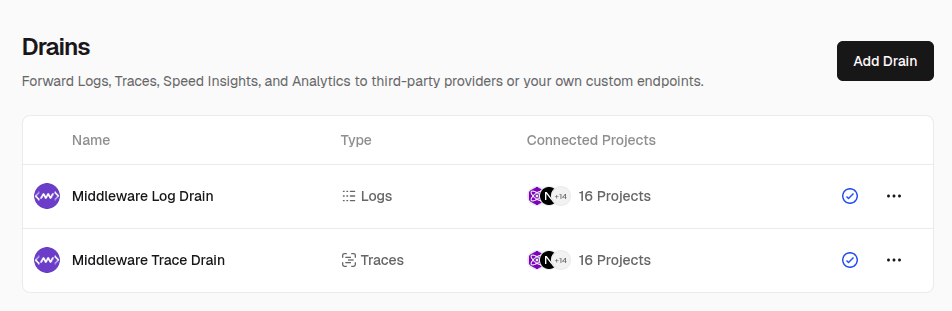
Automatic Drain Setup#
The integration automatically creates two drains in your Vercel account's drain settings:
1 Log Drain#
Routes all log data from your selected projects to Middleware
2 Trace Drain#
Routes distributed trace data from your selected projects to Middleware
These drains are configured with the appropriate endpoints and authentication to securely forward data to your Middleware account. You can verify these drains in your Vercel dashboard under Settings → Drains.
Supported Log Sources#
Middleware supports data from all available Vercel log sources:
| Source | Description |
|---|---|
| Static | Collects logs for static assets like HTML and CSS files |
| Edge | Output from Vercel Functions using Edge runtime |
| Lambda | Output from Vercel Functions like API Routes |
| External | Collects log results for external rewrites to a different domain, including cached external rewrites |
| Build | Outputs log data from the Build Step |
| Firewall | Outputs log data from requests denied by Vercel Firewall rules |
| Redirect | Requests that are redirected by redirect rules |
Environment Coverage#
The integration captures data from both deployment environments:
- Production: All logs and traces from production deployments
- Preview: All logs and traces from preview deployments accessed through the generated deployment URL
This dual-environment coverage ensures you have visibility into both your live application and development previews.
Log Sampling Configuration#
To help manage data volume and costs, you can configure log sampling rates directly from the Middleware platform. Sampling allows you to collect a percentage of logs rather than 100%, which is particularly useful for high-traffic applications. The sampling rate can be adjusted per project and applies to all log sources.
Logs in Middleware#
After the integration is active and data begins flowing, logs from your Vercel projects will appear in Middleware's Logs module. The logs are automatically organized and enriched with metadata for easy filtering and analysis.
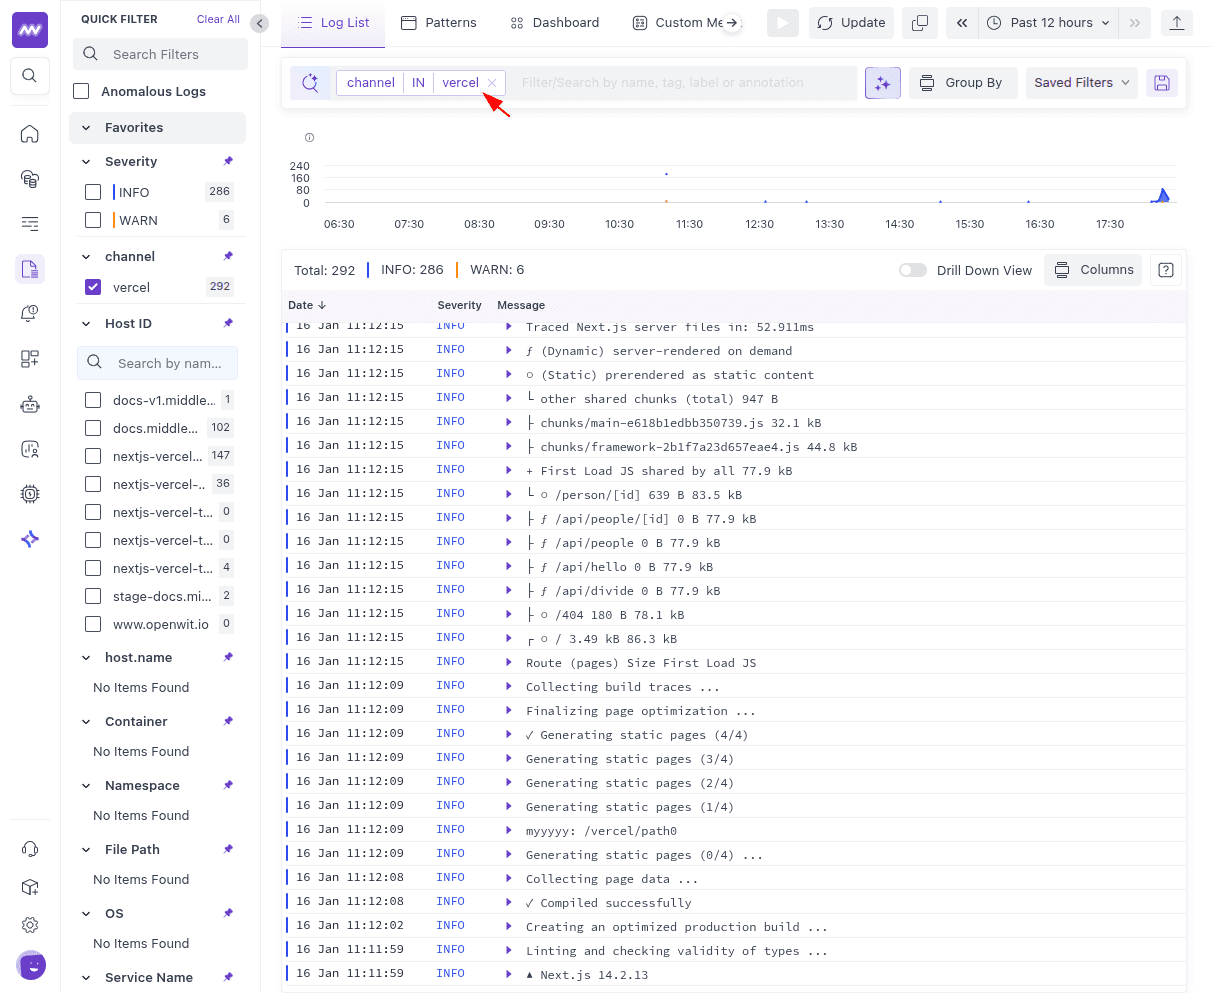
Log List View#
The main logs view displays all log entries in a unified interface that makes it easy to scan and analyze your application's log data. The interface provides powerful filtering capabilities, allowing you to narrow down logs by any of attributes. You can search through log content, filter by severity to focus on errors or warnings, filter by source type to see only Lambda logs or only Edge logs, and filter by environment to separate production issues from preview deployments. Additionally, you can sort the log list by timestamp to see the most recent entries first, or by severity to prioritize critical issues.
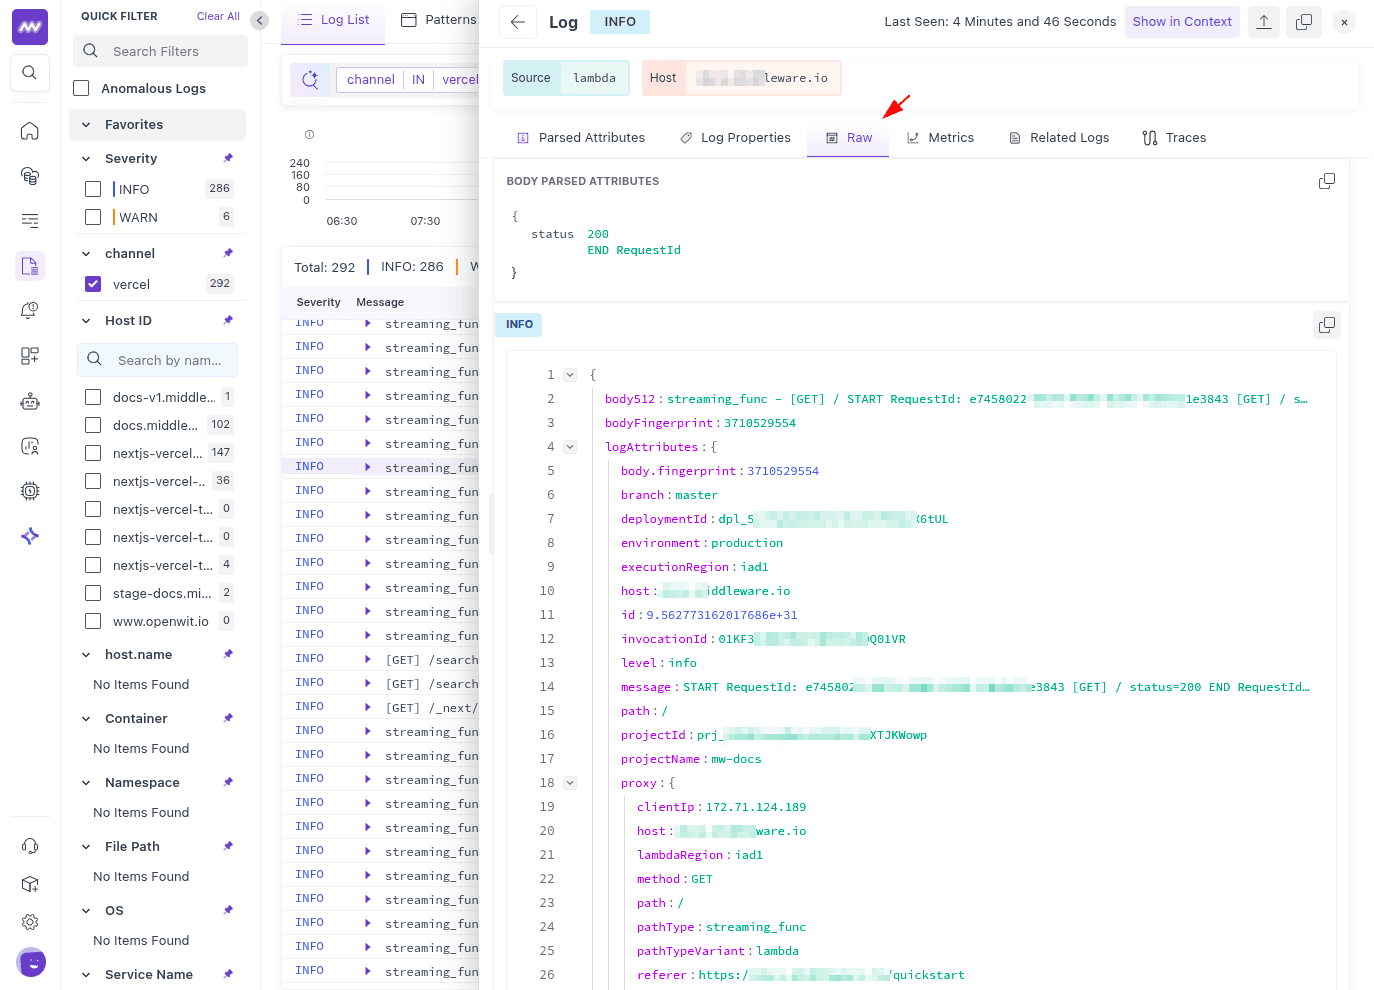
Log Details Panel#
When you click on any log entry, a detailed side panel opens with multiple tabs that provide comprehensive information about the log:
1 Parsed Attributes#
Displays the parsed log body with structured fields, key-value pairs, and formatted content for easy reading.
2 Log Properties#
Shows all resource and log attributes including traceId, spanId, environment, source, projectName, projectId, deploymentId, statusCode, level, path, requestId, executionRegion, branch, and other metadata associated with the log entry.
3 Raw#
Contains the complete JSON payload received from Vercel, useful for technical analysis and debugging parsing issues.
4 Traces#
Displays correlation data including Trace ID and Span ID links to view associated distributed traces. Correlation is possible because Vercel includes Trace ID and Span ID attributes in log entries when forwarding both logs and traces. This tab shows the request context with HTTP method, path, status code, headers, query parameters, and other request metadata that provides context for when and why the log was generated.
Traces in Middleware#
Distributed traces from your Vercel deployments appear in Middleware's Traces module, providing end-to-end visibility into how requests flow through your application.
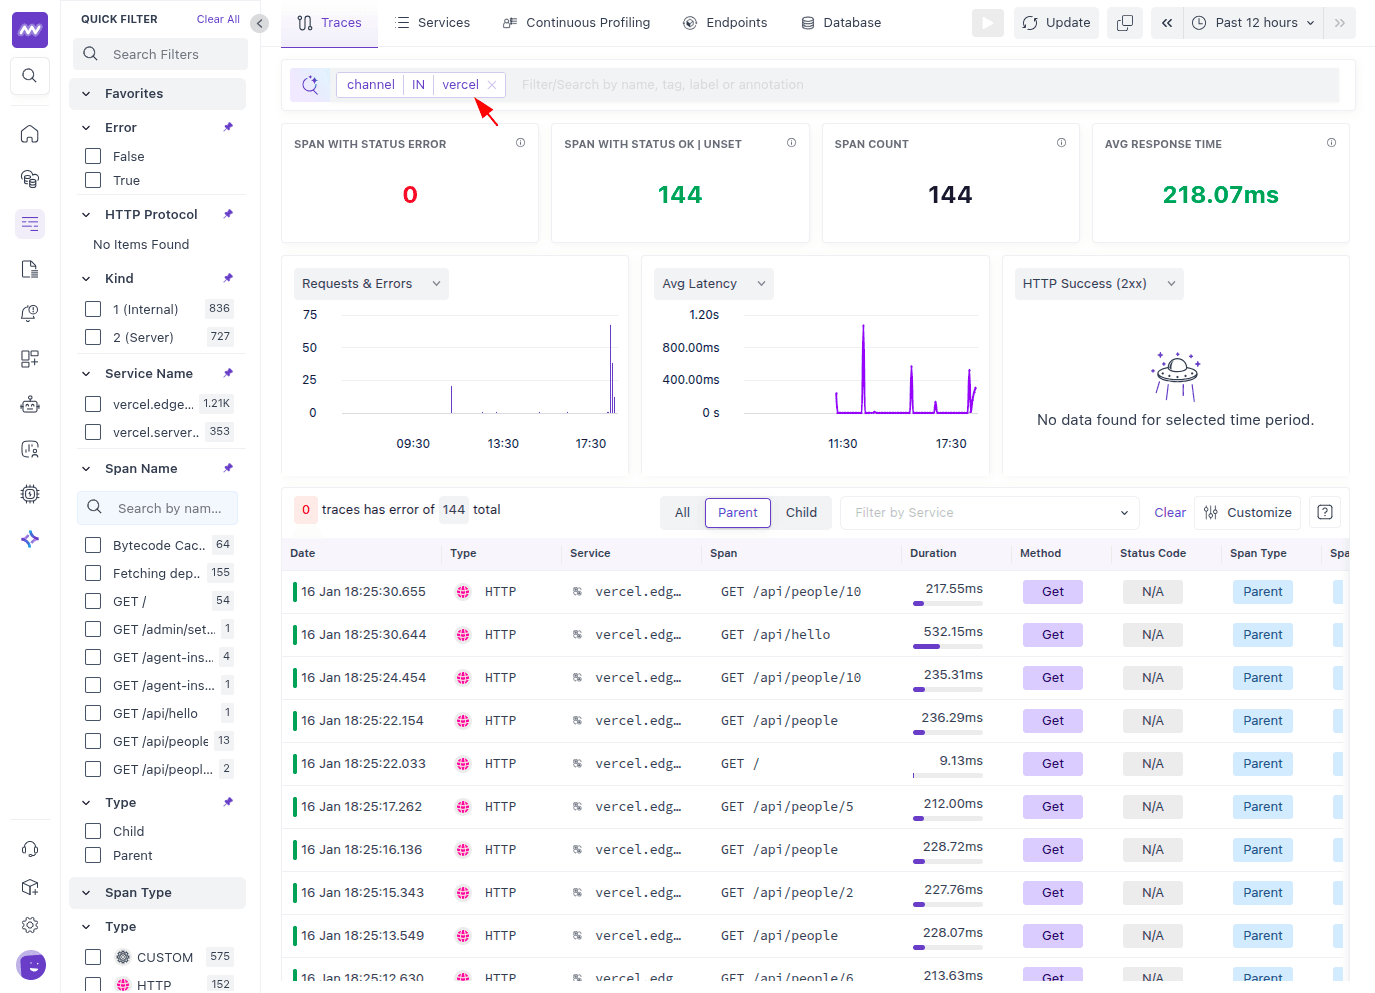
Trace List View#
The traces list displays all captured traces in a unified interface. Each trace entry shows the Trace ID, service name, operation type, duration, status, start time, environment, and span count. The interface provides powerful filtering capabilities, allowing you to narrow down traces by any attributes. You can filter by service, environment, or status, and sort by duration to identify the slowest requests.
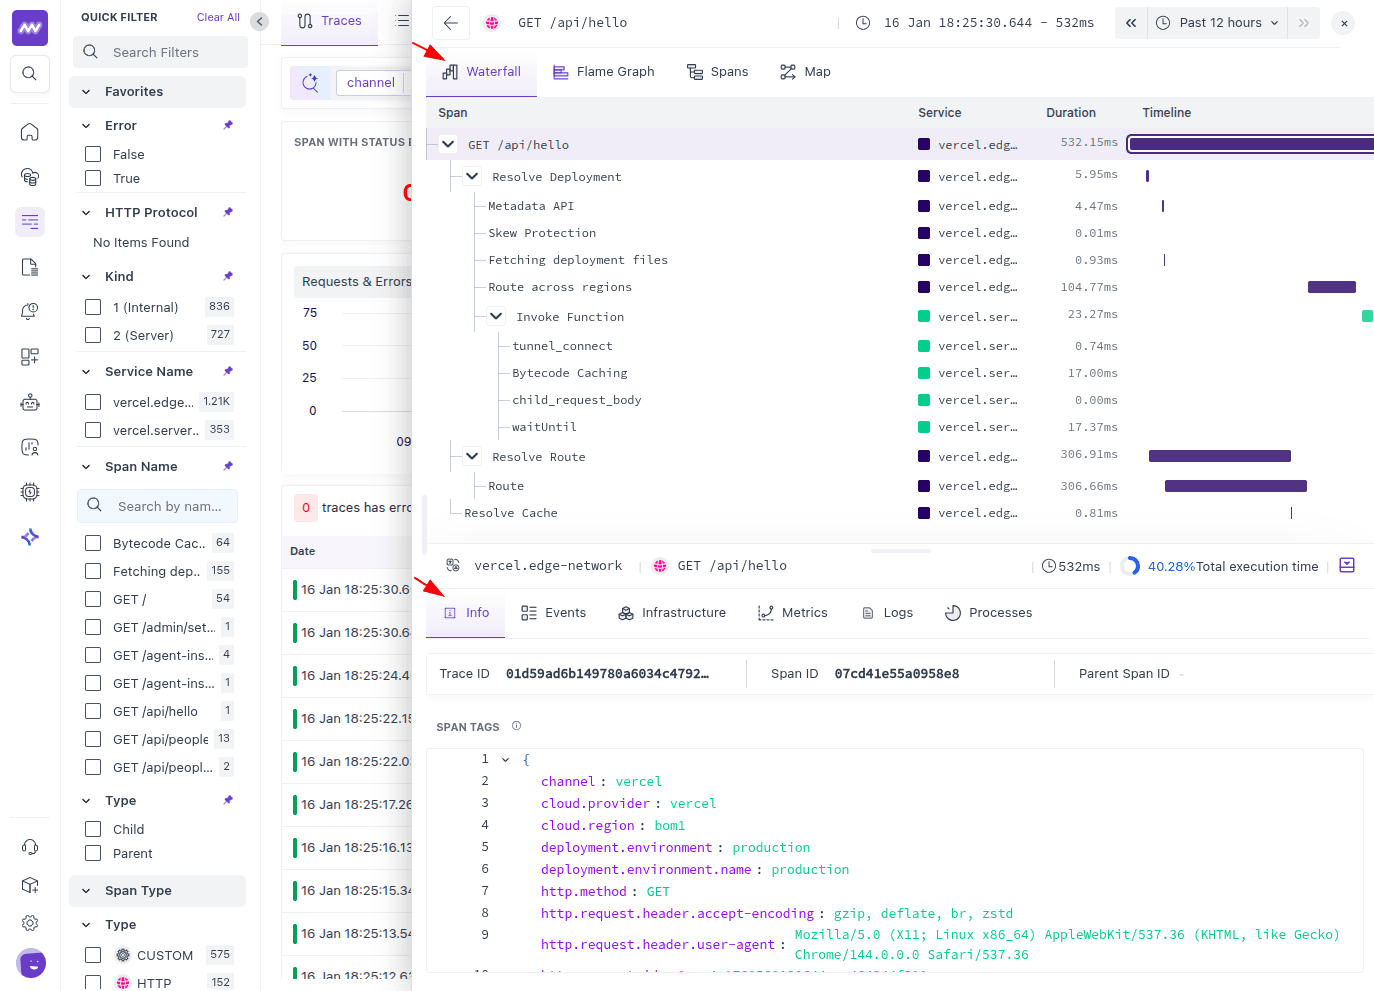
Trace Details Panel#
When you open a trace from the list, a detailed side panel opens with tabs organized in two portions:
Top Portion Tabs:
1 Waterfall#
Displays a timeline visualization of spans in parent-child format, showing the hierarchical relationships and execution flow of operations within the trace.
2 Flame Graph#
Shows the time range of span calls in a stack-based visualization, making it easy to identify where time is being spent in your application.
3 Spans#
Provides a table listing of all spans with duration, execution time, and execution percentage, allowing you to quickly identify slow operations.
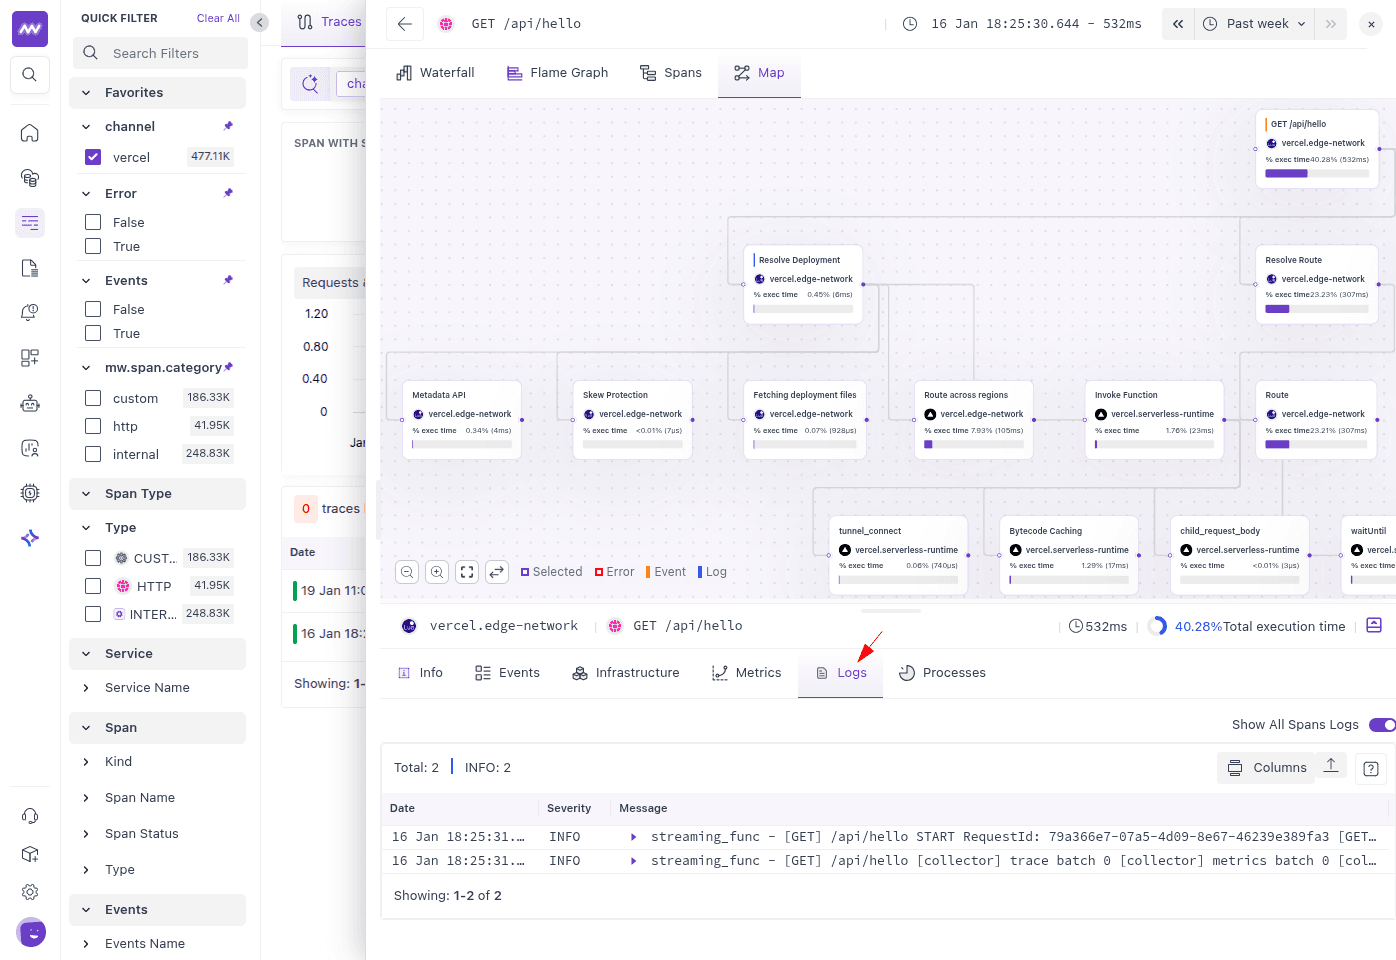
4 Map#
Displays a canvas-type diagram showing the data flow of spans using squares and connecting lines, providing a visual representation of service relationships and dependencies.
Bottom Portion Tabs:
1 Info#
Contains the complete JSON payload received from Vercel, useful for technical analysis and debugging.
2 Events#
Shows related events associated with the trace, providing additional context about what happened during request processing.
3 Logs#
Displays correlation between traces and logs. This tab shows all logs associated with the trace using Trace ID correlation, enabling you to see log messages alongside trace spans for comprehensive debugging.
Correlation#
The Vercel integration in Middleware, provides automatic correlation between logs and traces. When Vercel forwards both logs and traces from the same application, it includes Trace ID and Span ID attributes in log entries, enabling Middleware to automatically link related data.
How it works: Vercel generates a Trace ID for each request and a Span ID for each operation. These identifiers are included in log entries, allowing Middleware to correlate logs with their corresponding traces.
How to use it: Click the Trace ID link in any log entry to view the complete trace, or click "Logs" tab in a trace to see all associated logs. This enables you to navigate seamlessly between logs and traces for comprehensive debugging.
Benefits#
Correlation enables several powerful debugging workflows:
- Contextual Debugging: See logs in the context of the request flow
- Root Cause Analysis: Trace errors from log entry to source
- Performance Analysis: Correlate slow operations with detailed logs
- End-to-End Visibility: Understand complete request journeys
Fix Issues with OpsAI#
Once the Vercel integration is set up, Middleware automatically starts ingesting logs and traces from your Vercel projects, including Static, Lambda, Edge, Build, External, Firewall, and Redirect log sources. OpsAI continuously analyzes this telemetry data, detects Error and Fatal level issues, groups similar incidents using pattern detection, and surfaces them in the OpsAI listing for faster troubleshooting.
To investigate Vercel issues, open the OpsAI screen and use the side panel filters to narrow down by Source. This helps you quickly identify Vercel-related errors without manually searching through thousands of log entries.

Each incident represents a cluster of similar errors detected across your Vercel logs and traces. Selecting an incident opens a detailed view that displays occurrence patterns, frequency, affected environments, related telemetry, and a summary of the issue.

From the incident detail view, click the Look for Fix button to initiate Root Cause Analysis (RCA). OpsAI analyzes correlated logs and traces collected from your Vercel application to determine what happened, when the issue occurred, which services were impacted, and the likely source of the problem in the codebase.
If you have connected your GitHub or Bitbucket account to Middleware and authorized the relevant repository, you can associate it with the incident. Based on the RCA findings, OpsAI can generate a pull request containing a proposed code fix.

After the pull request is generated, you can review the suggested changes, validate the fix, and merge it into your branch. Because OpsAI uses correlated logs, traces, and incident context, the generated recommendations are more accurate and actionable than generic AI-generated suggestions.

With OpsAI, Middleware goes beyond traditional Vercel log monitoring by automatically detecting recurring issues, performing root cause analysis, identifying potential fixes, and generating pull requests, significantly reducing the time required to resolve Vercel application issues.
Custom Spans#
While the integration automatically collects traces from your Vercel deployments, you may want to add custom spans to instrument specific parts of your application. This is done using Vercel's official OpenTelemetry library.
1 Installing @vercel/otel#
Add the OpenTelemetry package to your project:
1npm install @vercel/otel2 Creating Custom Spans#
Once installed, you can create custom spans in your code as documented here. Custom spans will be automatically forwarded through Vercel's Trace Drain to your Middleware account, where they'll appear alongside automatically collected traces.
Custom spans created with @vercel/otel are fully integrated with the automatic trace collection. They will appear in the same traces and can be correlated with logs just like automatically collected spans.
Limitations#
Edge Runtime Traces#
Functions using the Edge runtime have limitations with distributed tracing. While Edge Function logs are collected via Log Drain, custom spans generated by Edge runtime functions are not forwarded through Vercel's Trace Drain due to platform constraints. See Vercel's documentation for details.
FAQs#
1 Do I need to modify my code to use this integration?#
No. The integration works entirely through Vercel's marketplace installation. No code changes are required. Logs and traces are automatically collected and forwarded to Middleware.
2 What happens to existing drains in my Vercel account?#
The Middleware integration creates new drains specifically for Middleware. Your existing drains remain unchanged and continue to function as before.
3 Can I configure which log sources to collect?#
Yes, you can configure log sources through the Middleware platform. The integration supports all Vercel log sources, and you can enable or disable specific sources as needed.
4 How do I remove the integration?#
You can remove the integration by going to Vercel's Integrations tab → Middleware (Press Manage) → Settings → Press Uninstall Integration.
5 How quickly does data appear after installation?#
Data typically begins appearing within a few minutes of installation, assuming there's active traffic or recent deployments on your projects. The first sync may take slightly longer.
6 Can I add custom instrumentation on top of the automatic collection?#
Yes. You can use @vercel/otel to add custom spans, and they will be automatically included in the traces forwarded to Middleware.
Need assistance or want to learn more about Middleware? Contact our support team at [email protected].