Install the Middleware Agent on Kubernetes
This page covers how to install the Middleware Agent (mw-agent) on a Kubernetes cluster using Helm.
At its core, the installation deploys a DaemonSet — so there's an agent running on every node to collect OS-level and kubelet metrics — and a Deployment to handle cluster-wide telemetry. Both are backed by a Service exposing gRPC (port 9319) and HTTP (port 9320) otel endpoints, along with the RBAC resources needed to read pod, node and namespace data with least-privilege access.
Beyond the core agent, the same Helm chart lets you optionally enable:
- Auto-Instrumentation (
mw-autoinstrumentation.enabled=true) — deploys the OpenTelemetry Operator, a language detector, a mutating webhook, and a language aggregator to automatically inject tracing into your workloads without any code changes. Supports Java, Node.js, Python, .NET, and Go. - OpsAI (
opsai.enabled=true) — deploys the OpsAI component, which connects to Middleware for AI-powered cluster insights and recommendations.
Prerequisites#
1 Kubernetes Version#
You are required to have Kubernetes version ≥ 1.21 which can be verified using the following command:
1kubectl version
2 Kubernetes Access#
kubectl ≥ v1.17.0 configured against your target cluster which can be verified with the following:
1kubectl version --client3 CLI Tools#
Helm v3.5+ (if using Helm) or a shell with bash, curl, and wget installed.
Installation#
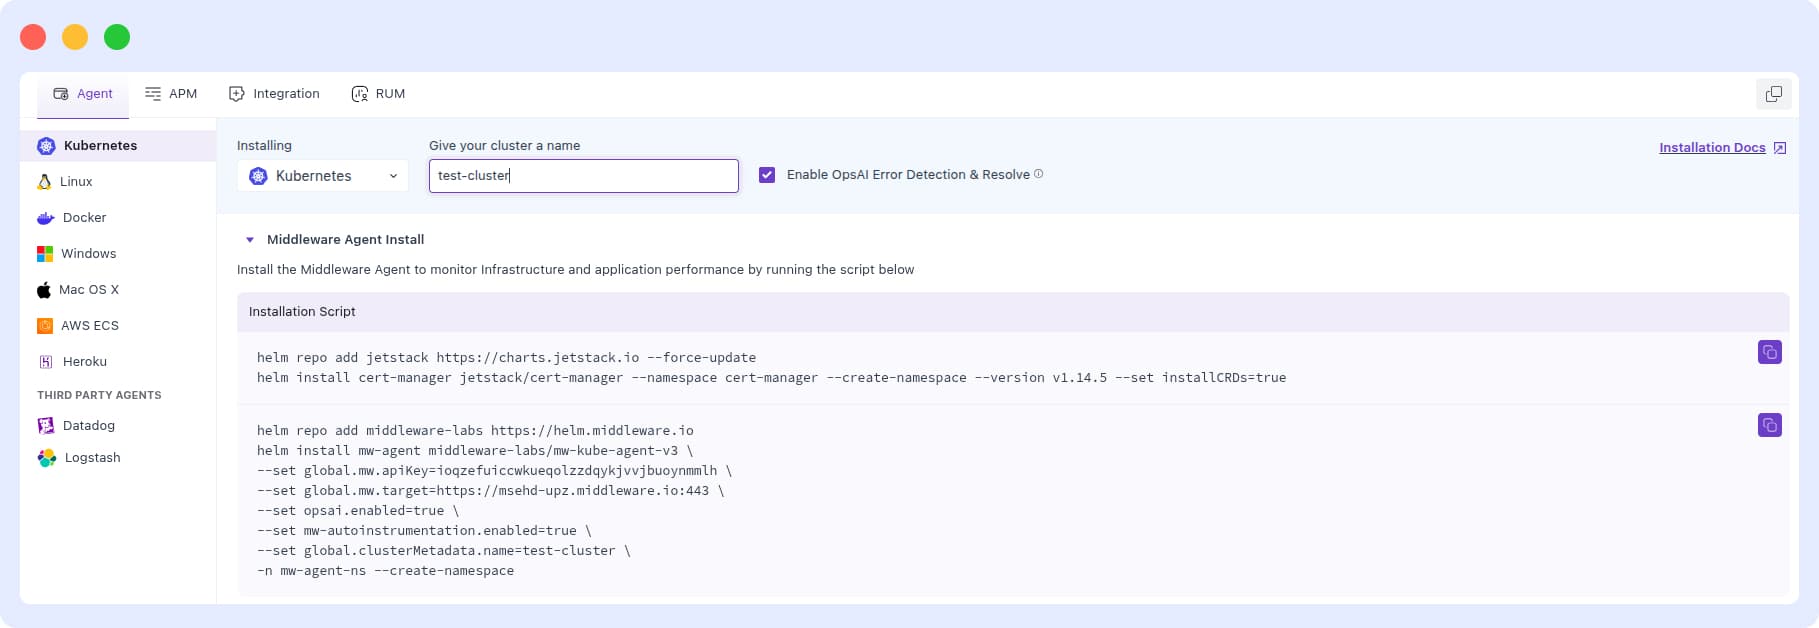
1 Access Kubernetes Installation#
Log in to your Middleware account, open the Installation page (bottom‑left), and select Kubernetes.
2 Identify Kubernetes Context#
Now, get the current Kubernetes Context and ensure the cluster belonging to this Context is where you want to install the Middleware Agent which can be found using the given command:
1kubectl config current-context
Note the CLUSTER name which will be used this as input for clusterMetadata.name in the Helm installation.
3 Run the Kubernetes install command for your Kubernetes distribution.#
Copy the exact command (Helm) from the Installation page so your <MW_API_KEY> and <MW_UID> are auto‑inserted.
Install cert-manager (skip if not enabling auto-instrumentation)
cert-manager manages TLS certificates for the auto-instrumentation webhook. Recommended when enabling mw-autoinstrumentation.enabled=true. Auto-instrumentation can work without it ( Additional config required ), but this is not recommended.
1helm repo add jetstack https://charts.jetstack.io --force-update
2
3helm install cert-manager jetstack/cert-manager \
4  --namespace cert-manager \
5  --create-namespace \
6  --version v1.14.5 \
7  --set installCRDs=true
Helm Command for Kubernetes
1helm repo add middleware-labs https://helm.middleware.io
2helm install mw-agent middleware-labs/mw-kube-agent-v3 \
3--set global.mw.apiKey=<MW_API_KEY> \
4--set global.mw.target=https://<MW_UID>.middleware.io:443 \
5--set opsai.enabled=true \
6--set mw-autoinstrumentation.enabled=true \
7--set global.clusterMetadata.name=<your-cluster-name> \
8-n mw-agent-ns --create-namespace
Required flags:
| Flag | Description |
|---|---|
global.mw.apiKey | Your Middleware API key |
global.mw.target | Your Middleware target URL (e.g. https://your-account-uid.middleware.io:443) |
global.clusterMetadata.name | A unique name to identify this cluster in the Middleware UI |
Optional flags:
| Flag | Default | Description |
|---|---|---|
opsai.enabled | false | Enables OpsAI for AI-powered cluster insights and fixes |
mw-autoinstrumentation.enabled | false | Enables auto-instrumentation for application traces |
Advanced Configuration#
For full customization, you can override any default value by passing a custom values.yaml file. View the complete list of available configuration options in the chart's default values.yaml:
View full values.yaml on Github
To apply your custom values:
1helm install mw-agent middleware-labs/mw-kube-agent-v3 \
2  -f values.yaml \
3  -n mw-agent-ns --create-namespace
This is useful for tuning resource limits, tolerations, feature flags, and other cluster-specific settings beyond the defaults.
Managing API keys via Secret:#
You can also reference your API key from an existing Kubernetes secret. Create a values.yaml file with the following:
1mw:
2  target: https://<MW_UID>.middleware.io:443
3  apiKeyFromExistingSecret:
4    enabled: true
5    name: name-of-your-secret
6    key: name-of-your-secret-key
7
8clusterMetadata:
9  name: my-cluster
4 Verify Installation#
Run the following commands to confirm the Middleware Agent is running correctly: Core agent (always present):
1kubectl get daemonset mw-kube-agent -n mw-agent-ns
2kubectl get deployment mw-kube-agent -n mw-agent-ns
3kubectl get deployment mw-kube-agent-config-updater -n mw-agent-ns
Once all pods show Available, metrics and traces will begin appearing in the Middleware dashboard within a few minutes.
If autoinstrumentation is enabled, the following additional components should also be running:
1kubectl get deployment mw-agent-opentelemetry-operator -n mw-agent-ns
2kubectl get deployment mw-auto-injector -n mw-agent-ns
3kubectl get deployment mw-lang-aggregator -n mw-agent-ns
4kubectl get daemonset mw-lang-detector -n mw-agent-ns
If opsai is enabled, the following additional components should also be running:
1kubectl get deployment opsai -n mw-agent-ns5 Check Dashboard#
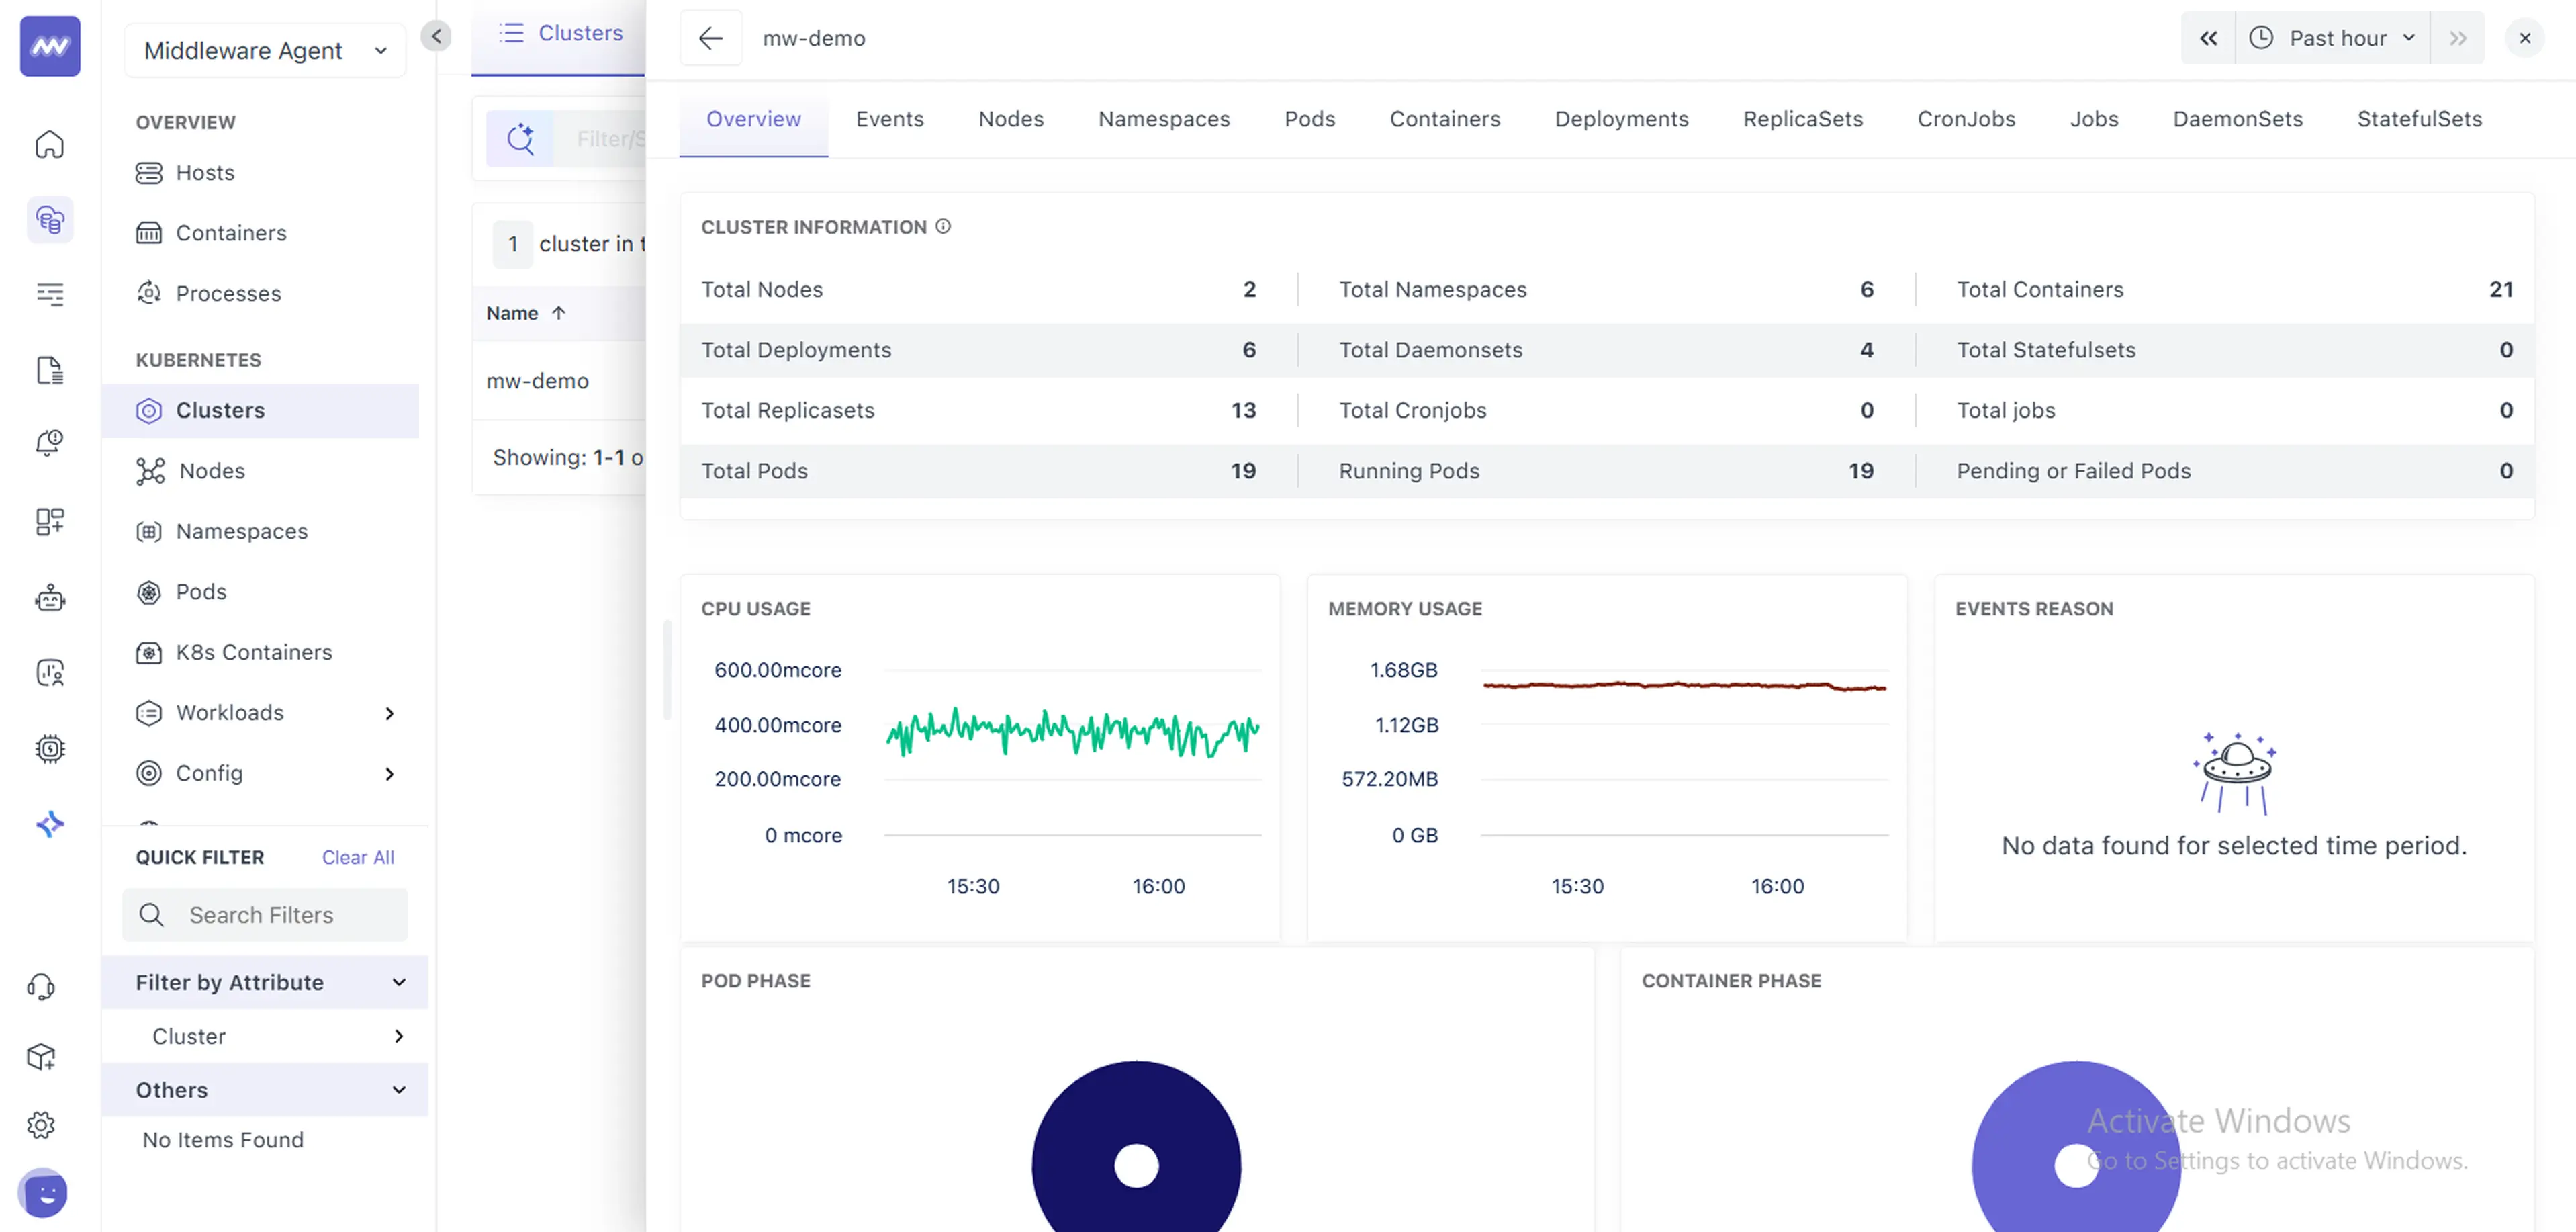
Once you have all the setup ready, you can finally check the dashboard for your Kubernetes cluster with default settings which can be later configured as per your liking (e.g, rules, conditions, etc.)
Upgrade#
The Middleware Agent is frequently updated to add new features and improve performance. More information on recent changes can be found in our Newsletter. Select the option below that matches your original installation method.
(Optional) Update your Helm repo to pull in the latest chart versions:
1helm repo update middleware-labsUpgrade the release: reusing your existing values
1helm upgrade --reuse-values mw-agent middleware-labs/mw-kube-agent-v3 -n mw-agent-nsOr, if you are managing configuration via a values.yaml file:
1helm upgrade mw-agent middleware-labs/mw-kube-agent-v3 \
2  -f values.yaml \
3  -n mw-agent-ns
If the chart's default values.yaml has changed between versions, --reuse-values may not work as expected — new keys introduced in the updated chart will not be present in your saved values. In this case, either pass all required flags explicitly via --set or maintain a values.yaml file and use -f values.yaml instead. You can always refer to the latest defaults in the chart's values.yaml.
Tip: If you need to immediately pick up new configuration values, you can also restart the config updated pod
1kubectl rollout restart deployment mw-kube-agent-config-updater -n mw-agent-nsAuto-Instrumentation#
Automated instrumentation enables end-to-end tracing (and application logs for supported languages) without modifying your application code.
Middleware auto-instrumentation builds on the OpenTelemetry Kubernetes Operator with language detection and a mutating webhook to provide zero-downtime, in-cluster instrumentation for workloads.
Why this matters#
- No code changes – Deploy once, get traces immediately.
- Centralized control – Toggle instrumentation per namespace or app via UI or CR.
- Dynamic updates – Changes apply on the fly; just restart your pods.
When mw-autoinstrumentation.enabled=true is enabled during installation, the Middleware Agent automatically deploys the required components (OpenTelemetry Operator, language detector, mutating webhook, and aggregator) to activate tracing across your cluster.
Supported languages: Java · Node.js · Python · .NET · Go · Ruby · Apache HTTPD · Nginx
Instrumentation Modes#
Set via mw-autoinstrumentation.mode at install time. Two modes are available:
auto (default)
Deploys a language detector that scans your workloads, identifies the runtime language, and injects instrumentation automatically on restart if enabled from ui. Detected workloads appear in the Middleware UI where you can toggle instrumentation per workload. Manual annotations are still supported for custom cases.
manual
Only the OpenTelemetry Operator is deployed — no language detector, no UI-driven detection. You must manually add annotations to every pod you want instrumented. Recommended for environments like EKS Fargate and GKE Autopilot.
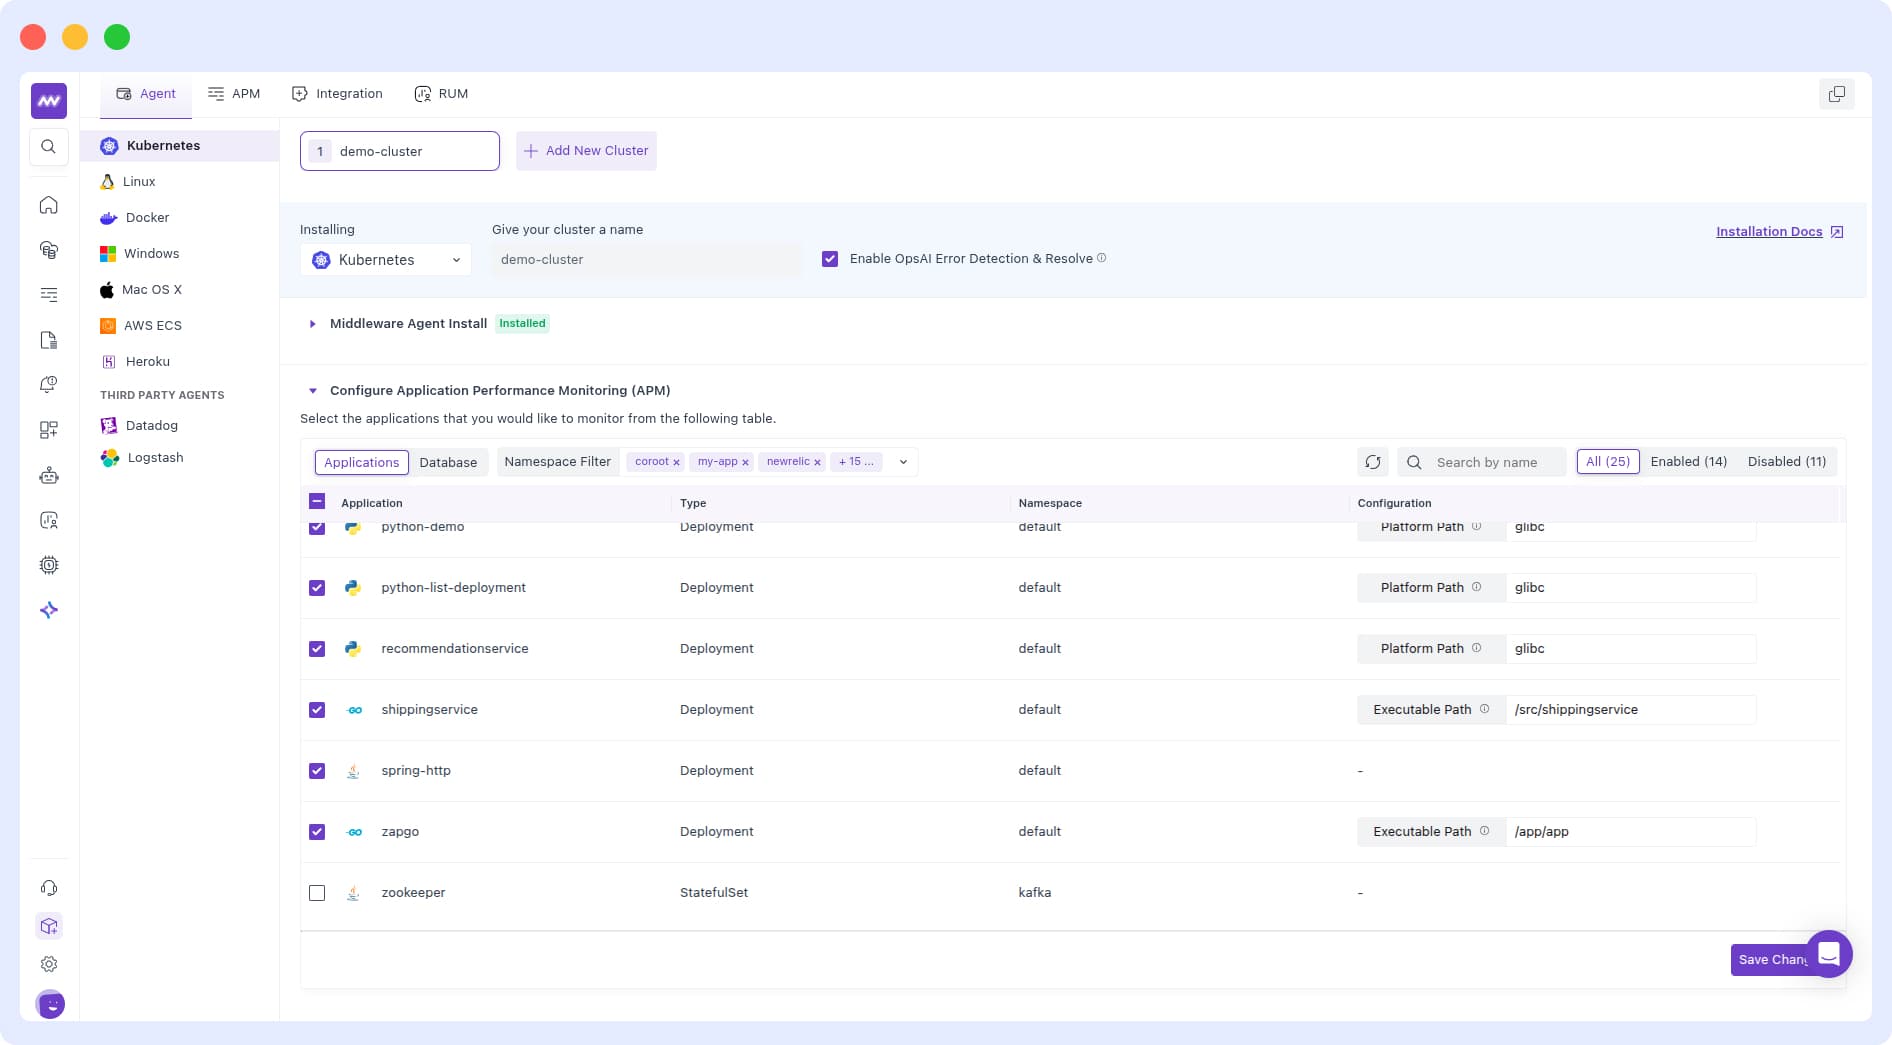
1--set mw-autoinstrumentation.mode=manualUI-Driven Instrumentation (auto mode only)#
The easiest way to manage instrumentation is through the Middleware UI:
- Navigate to Installation - Kubernetes Agent Section in the Middleware UI.
- Review the list of detected Deployments, StatefulSets, and DaemonSets along with their inferred language and current status.
- Toggle instrumentation per workload, or click Select All and then Save Changes.
- Restart your pods for changes to take effect:
1kubectl rollout restart deployment/<deployment-name> -n <namespace>Namespace Scoping#
By default, auto-instrumentation applies to all namespaces except system namespaces. You can control scope during installation:
1# Instrument only specific namespaces
2--set mw-autoinstrumentation.webhook.includedNamespaces="{app,backend}"
3
4# Instrument all namespaces except specific ones
5--set mw-autoinstrumentation.webhook.userExcludedNamespaces="{monitoring,infra}"
App Detection Scoping#
By default, app detection applies to all namespaces except system namespaces. You can control scope during installation:
1# App Detection will be skipped for this namespaces
2--set mw-autoinstrumentation.langDetector.userExcludedNamespaces="{app,backend}"
Manual Annotation-Based Instrumentation#
Use manual configuration in these scenarios:
- Running on EKS Fargate or GKE Autopilot clusters
- Language detection isn’t working for your application.
- You need custom instrumentation settings such as non‑default sampling or exporter options.
- Your application has special requirements like custom resource attributes , propagators , multiple instrumentation of containers etc.
- You want fine‑grained control over which pods get instrumented and how.
Before you begin: Disable auto‑instrumentation for the target application via the UI to avoid conflicts
In manual mode — or when auto-detection fails — you control instrumentation by adding annotations directly to your Pod template under spec.template.metadata.annotations.
1spec:
2  template:
3    metadata:
4      annotations:
5        <your-injection-annotation>: "<namespace>/<cr-name>"
Always place these annotations under spec.template.metadata.annotations inside your Deployment, DaemonSet, or StatefulSet — not at the top-level metadata.annotations of the workload itself.
In order to auto‑instrument your applications, the OTEL Kubernetes Operator must know which Pods to instrument and which Instrumentation Custom Resource (CR) to apply to those Pods. The installation steps in the Installation section automatically create a default Instrumentation CR named mw-autoinstrumentation in the mw-agent-ns namespace.
First, confirm the default Instrumentation CR is present:
1kubectl get otelinst mw-autoinstrumentation -n mw-agent-nsTo inspect the full instrumentation CR, use kubectl get with the -o yaml flag in the namespace where it lives. For example, if it’s in mw-agent-ns:
1kubectl get otelinst mw-autoinstrumentation -n mw-agent-ns -o yamlThe Instrumentation CR looks like below
1apiVersion: opentelemetry.io/v1alpha1
2kind: Instrumentation
3metadata:
4  name: mw-autoinstrumentation
5  namespace: mw-agent-ns
6spec:
7  exporter:
8    endpoint: http://mw-service.mw-agent-ns:9319
9  propagators:
10    - tracecontext
11    - baggage
12    - b3
13  sampler:
14    type: parentbased_traceidratio
15    argument: "1.0"
16  python:
17    env:
18      - name: OTEL_EXPORTER_OTLP_ENDPOINT
19        value: http://mw-service.mw-agent-ns:9320
20
21      - name: OTEL_LOGS_EXPORTER
22        value: otlp_proto_http
23      - name: OTEL_PYTHON_LOGGING_AUTO_INSTRUMENTATION_ENABLED
24        value: "true"
25  go:
26    env:
27      - name: OTEL_EXPORTER_OTLP_ENDPOINT
28        value: http://mw-service.mw-agent-ns:9320
29  dotnet:
30    env:
31      - name: OTEL_EXPORTER_OTLP_ENDPOINT
32        value: http://mw-service.mw-agent-ns:9320
33  java:
34    env:
35      - name: OTEL_EXPORTER_OTLP_ENDPOINT
36        value: http://mw-service.mw-agent-ns:9319
The exporter.endpoint field in your Instrumentation CR tells your instrumented pods where to send traces. It should point to the Middleware Kubernetes Agent service, using:
- Port 9319 for gRPC (OTLP/gRPC)
- Port 9320 for HTTP (OTLP/HTTP)
You can also create your own Instrumentation CR in any namespace and reference it in your annotations:
1# Use the single CR in the Pod's own namespace
2<lang-annotation>: "true"
3
4# Use a named CR in the current namespace
5<lang-annotation>: "my-instrumentation"
6
7# Use a CR from a different namespace
8<lang-annotation>: "my-other-namespace/my-instrumentation"
9
10# Disable instrumentation for this Pod
11<lang-annotation>: "false"
Single User App Workloads#
For a single-container pod, add the language-specific inject annotation:
Java
1instrumentation.opentelemetry.io/inject-java: "mw-agent-ns/mw-autoinstrumentation"Node.js
1instrumentation.opentelemetry.io/inject-nodejs: "mw-agent-ns/mw-autoinstrumentation"Python
1instrumentation.opentelemetry.io/inject-python: "mw-agent-ns/mw-autoinstrumentation"For Linux musl-based images (Alpine etc.), add:
1instrumentation.opentelemetry.io/otel-python-platform: "musl"For Linux glibc-based images this is the default and can be omitted, but can be set explicitly:
1instrumentation.opentelemetry.io/otel-python-platform: "glibc".NET (glibc)
1instrumentation.opentelemetry.io/inject-dotnet: "mw-agent-ns/mw-autoinstrumentation"
2instrumentation.opentelemetry.io/otel-dotnet-auto-runtime: "linux-x64"
.NET (musl)
1instrumentation.opentelemetry.io/inject-dotnet: "mw-agent-ns/mw-autoinstrumentation"
2instrumentation.opentelemetry.io/otel-dotnet-auto-runtime: "linux-musl-x64"
Go
Go requires additional configuration — you must specify the target executable and grant elevated permissions:
1# Annotations
2instrumentation.opentelemetry.io/inject-go: "mw-agent-ns/mw-autoinstrumentation"
3instrumentation.opentelemetry.io/otel-go-auto-target-exe: "/path/to/executable"
Within the same Pod spec, ensure your container has elevated privileges so the auto‑instrumentation helper can attach via ptrace:
1# Container security context (required)
2securityContext:
3  privileged: true
4  runAsUser: 0
Apache HTTPD
1instrumentation.opentelemetry.io/inject-apache-httpd: "mw-agent-ns/mw-autoinstrumentation"Nginx
1instrumentation.opentelemetry.io/inject-nginx: "mw-agent-ns/mw-autoinstrumentation"Multi-Container Pods — Single Language#
If container-names is not specified and your first container is a sidecar (e.g. Istio, Linkerd), the sidecar will be instrumented instead of your application container. Always specify container-names explicitly in multi-container pods to avoid this.
If nothing else is specified, instrumentation is performed on the first container available in the pod spec. In some cases (for example in the case of the injection of an Istio sidecar) it becomes necessary to specify on which container(s) this injection must be performed.
For this, it is possible to fine-tune the pod(s) on which the injection will be carried out.
For this, we will use the instrumentation.opentelemetry.io/container-names annotation for which we will indicate one or more container names (.spec.containers.name) on which the injection must be made
1annotations:
2  # Inject Java into 'javaapp' container
3  instrumentation.opentelemetry.io/inject-java: "mw-agent-ns/mw-autoinstrumentation"
4  instrumentation.opentelemetry.io/java-container-names: "javaapp,javaapp2"
If all containers in the pod share the same language, you can use the generic container-names annotation instead:
1instrumentation.opentelemetry.io/inject-java: "mw-agent-ns/mw-autoinstrumentation"
2instrumentation.opentelemetry.io/container-names: "myapp"
Multi-Container Pods — Multiple Language#
Works only when enable-multi-instrumentation flag is true.
Annotations defining which language instrumentation will be injected are required. When this feature is enabled, specific for Instrumentation language containers annotations are used:
If language instrumentation specific container names are not specified, instrumentation is performed on the first container available in the pod spec (only if single instrumentation injection is configured).
In some cases containers in the pod are using different technologies. It becomes necessary to specify language instrumentation for container(s) on which this injection must be performed.
For this, we will use language instrumentation specific container names annotation for which we will indicate one or more container names (.spec.containers.name) on which the injection must be made
Example
1apiVersion: apps/v1
2kind: Deployment
3metadata:
4  name: my-deployment-with-multi-containers-multi-instrumentations
5spec:
6  selector:
7    matchLabels:
8      app: my-pod-with-multi-containers-multi-instrumentations
9  replicas: 1
10  template:
11    metadata:
12      labels:
13        app: my-pod-with-multi-containers-multi-instrumentations
14      annotations:
15        instrumentation.opentelemetry.io/inject-java: "mw-agent-ns/mw-autoinstrumentation"
16        instrumentation.opentelemetry.io/java-container-names: "myapp,myapp2"
17        instrumentation.opentelemetry.io/inject-python: "mw-agent-ns/mw-autoinstrumentation"
18        instrumentation.opentelemetry.io/python-container-names: "myapp3"
19    spec:
20      containers:
21        - name: myapp
22          image: myImage1
23        - name: myapp2
24          image: myImage2
25        - name: myapp3
26          image: myImage3
Go auto-instrumentation does not support multi-container pods. When injecting Go auto-instrumentation, the first container should be the only container you want to instrument.
A single container cannot be instrumented with multiple languages simultaneously.
The instrumentation.opentelemetry.io/container-names annotation is not used for multi-language instrumentation. Use the language-specific *-container-names annotations instead.
Resource Attributes#
To attach custom metadata to traces, add resource attribute annotations to your Pod spec:
1resource.opentelemetry.io/<your-key>: "<your-value>"Example:
1resource.opentelemetry.io/environment: "production"
2resource.opentelemetry.io/team: "backend"
SDK-Only Injection#
For applications that cannot be auto-instrumented, you can inject only the OpenTelemetry SDK environment variables (OTEL_RESOURCE_ATTRIBUTES, OTEL_TRACES_SAMPLER, OTEL_EXPORTER_OTLP_ENDPOINT) without providing the full SDK:
1instrumentation.opentelemetry.io/inject-sdk: "mw-agent-ns/mw-autoinstrumentation"Custom Instrumentation Images#
By default, Middleware uses custom and upstream both auto-instrumentation images. You can override these in your Instrumentation CR:
1apiVersion: opentelemetry.io/v1alpha1
2kind: Instrumentation
3metadata:
4  name: mw-autoinstrumentation
5  namespace: mw-agent-ns
6spec:
7  java:
8    image: your-customized-auto-instrumentation-image:java
9  nodejs:
10    image: your-customized-auto-instrumentation-image:nodejs
11  python:
12    image: your-customized-auto-instrumentation-image:python
13  dotnet:
14    image: your-customized-auto-instrumentation-image:dotnet
15  go:
16    image: your-customized-auto-instrumentation-image:go
17  apacheHttpd:
18    image: your-customized-auto-instrumentation-image:apache-httpd
19  nginx:
20    image: your-customized-auto-instrumentation-image:nginx
Apache HTTPD Configuration#
For Apache HTTPD autoinstrumentation, by default, instrumentation assumes httpd version 2.4 and httpd configuration directory /usr/local/apache2/conf as it is in the official Apache HTTPD image (f.e. docker.io/httpd:latest). If you need to use version 2.2, or your HTTPD configuration directory is different, and or you need to adjust agent attributes, customize the instrumentation specification per following example:
List of all available attributes can be found at otel-webserver-module
1spec:
2  apacheHttpd:
3    image: your-customized-auto-instrumentation-image:apache-httpd
4    version: "2.2"
5    configPath: /your-custom-config-path
6    attrs:
7      - name: ApacheModuleOtelMaxQueueSize
8        value: "4096"
Nginx Configuration#
For Nginx autoinstrumentation, Nginx versions 1.22.0, 1.23.0, and 1.23.1 are supported at this time. The Nginx configuration file is expected to be /etc/nginx/nginx.conf by default, if it's different, see following example on how to change it. Instrumentation at this time also expects, that conf.d directory is present in the directory, where configuration file resides and that there is a include <config-file-dir-path>/conf.d/*.conf; directive in the http { ... } section of Nginx configuration file (like it is in the default configuration file of Nginx). You can also adjust OpenTelemetry SDK attributes. Example:
1spec:
2  nginx:
3    image: your-customized-auto-instrumentation-image:nginx
4    configFile: /my/custom-dir/custom-nginx.conf
5    attrs:
6      - name: NginxModuleOtelMaxQueueSize
7        value: "4096"
List of all available attributes can be found at otel-webserver-module
Nginx instrumentation expects a conf.d directory in the same location as the config file, with an include <config-dir>/conf.d/*.conf; directive inside the http { } block.
Controlling Instrumentation Capabilities#
Language instrumentation can be enabled or disabled via feature gates. Go and Nginx are disabled by default:
| Language | Gate | Default |
|---|---|---|
| Java | enable-java-instrumentation | true |
| Node.js | enable-nodejs-instrumentation | true |
| Python | enable-python-instrumentation | true |
| .NET | enable-dotnet-instrumentation | true |
| Apache HTTPD | enable-apache-httpd-instrumentation | true |
| Go | enable-go-instrumentation | false |
| Nginx | enable-nginx-instrumentation | false |
Multi-container, multi-language instrumentation is enabled via the enable-multi-instrumentation flag, which is false by default. This is already enabled in the Middleware chart by default.
GKE Autopilot#
GKE Autopilot enforces a stricter security model that limits access to host filesystems, networking, and ports. Some Middleware Agent features behave differently in Autopilot environments. For more details see the GKE Autopilot Security Capabilities documentation.
Known Limitations#
The following features are not supported on Autopilot clusters:
- Automatic language and workload detection
- UI-based instrumentation toggle
To instrument your applications, use manual annotation-based instrumentation by adding the required annotations directly to your workload manifests. See the Manual Annotation-Based Instrumentation section above.
Metrics Still Collected#
The kubeletstats receiver continues to collect essential resource metrics in Autopilot clusters with few metrics not supported.
Helm Values Reference#
1features:
2  enableHostMonitoring: false # Must be disabled on Autopilot clusters
3
4providers:
5  gke:
6    autopilot: true # Enables GKE Autopilot-specific configuration
EKS Fargate#
AWS EKS Fargate runs pods in isolated serverless micro-VMs with no node-level access. This introduces specific restrictions that affect how the Middleware Agent collects observability data:
- DaemonSets are not supported
- Host volume mounts are not allowed
- No direct node-level access
If your entire cluster runs on Fargate, ensure mw-agent-ns is included in a Fargate profile profile. Otherwise agent pods will remain in Pending state.
Helm Values Reference#
1providers:
2  eks:
3    fargate:
4      enabled: false # Enable Fargate-specific configuration
5      createNamespace: true # Creates aws-observability namespace; set false if it already exists
6      logRouter:
7        enabled: false # Deploys Fluent Bit log router ConfigMap for log collection
8        createConfigMap: true # Creates aws-logging ConfigMap; set false if using a custom one
9      containerInsights:
10        enabled: false # Deploys ADOT Collector for Fargate container metrics
11        createNamespace: true # Creates fargate-container-insights namespace; set false if it exists
Log Collection#
Since host volume mounts are not available, the standard method of reading logs from /var/log/containers/ does not work on Fargate. Instead, the chart uses the AWS built-in Fluent Bit log router AWS Fargate logging.
When providers.eks.fargate.logRouter.enabled=true, the chart:
- Creates the
aws-observabilitynamespace with the requiredaws-observability: enabledlabel - Deploys a Fluent Bit ConfigMap that parses container logs, enriches them with Kubernetes metadata, auto-detects log levels, and forwards them directly to Middleware
Logs are sent straight to Middleware — not to CloudWatch — avoiding additional AWS ingestion and storage costs.
Metrics Collection#
Since DaemonSets cannot run on Fargate, the chart deploys the AWS Distro for OpenTelemetry (ADOT) Collector as a StatefulSet instead.
When providers.eks.fargate.containerInsights.enabled=true, the chart:
- Creates the
fargate-container-insightsnamespace - Deploys the ADOT Collector which scrapes cAdvisor metrics from the Kubelet API and exports them to Middleware via OTLP/HTTP
Metrics collected:
| Level | Metrics |
|---|---|
| Pod | CPU usage/limits, memory usage/limits/working set, network bytes in/out |
| Container | CPU usage, memory usage/cache/working set, filesystem capacity/usage |
Application Instrumentation#
UI-driven auto-instrumentation is not supported on Fargate. Manual annotation-based instrumentation is fully supported — set mw-autoinstrumentation.mode=manual during installation and add annotations directly to your workload manifests.
For annotation instructions see the Manual Annotation-Based Instrumentation section above
TLS Certificate Management for Auto Instrumentation#
Auto-instrumentation relies on admission webhooks that require valid TLS certificates. There are two ways to manage these certificates.
Option 1: Using cert-manager (Recommended)#
cert-manager automates the full lifecycle of TLS certificates — issuance, renewal, and rotation. No additional flags are needed during Middleware Agent installation as cert-manager integration is enabled by default.
Option 2: Without cert-manager (Self-Managed Certificates)#
If you prefer not to use cert-manager, the chart can auto-generate self-signed certificates instead. Add the following flags to your install command:
1--set mw-autoinstrumentation.webhook.certManager.enabled=false \
2--set mw-autoinstrumentation.opentelemetry-operator.admissionWebhooks.certManager.enabled=false
Helm Values Reference:
1certManager:
2  enabled: true # Set to false to disable cert-manager integration
3autoGenerateCert:
4  enabled: true # Enables self-signed certificate generation when cert-manager is disabled
5  recreate: true # Regenerates certificates on each helm upgrade
6  certPeriodDays: 365 # Certificate validity period in days
Without cert-manager you are responsible for managing the certificate lifecycle. On chart upgrades or certificate expiry, manually restart the operator and auto-injector to pick up new certificates. Set recreate: true to regenerate certificates automatically on each upgrade.
Existing OpenTelemetry Operator CRDs#
The Middleware Agent Helm chart bundles the OpenTelemetry Operator and its CRDs. If your cluster already has OTel Operator CRDs installed, the installation may fail with an error like:
1Error: INSTALLATION FAILED: unable to continue with install: CustomResourceDefinition
2"targetallocators.opentelemetry.io" in namespace "" exists and cannot be imported
3into the current release: invalid ownership metadata
Recommended: Remove the existing OTel Operator CRDs before installing and let the Middleware Helm chart manage them:
1kubectl delete crd \
2  opentelemetrycollectors.opentelemetry.io \
3  instrumentations.opentelemetry.io \
4  targetallocators.opentelemetry.io \
5  opampbridges.opentelemetry.io
Alternative: If you need to keep your existing CRDs, skip CRD creation during installation:
1--set mw-autoinstrumentation.opentelemetry-operator.crds.create=falseSkipping CRD creation means the chart will use whatever CRD versions are already present in your cluster. This may cause compatibility issues if the existing CRD versions do not match what the bundled OTel Operator expects.
Explore Your Data on Middleware#
Once you’ve installed auto‑instrumentation and restarted your Pods, new trace data will flow into Middleware automatically as your applications handle requests. To view and analyze this data:
- Log in to your Middleware.io account.
- Navigate to APM in the sidebar.
- Select your service from the list (e.g.,
test-node-app). - Explore Service Maps, Trace Details, Latency Charts, and Error Rates for real‑time insights into your application’s performance.
Uninstall#
You can remove the Middleware Agent from your Kubernetes cluster using helm
1helm uninstall mw-agent -n mw-agent-nsNow, delete the namespaces:
1kubectl delete namespace mw-agent-nsTroubleshooting#
Run only one Middleware Agent DaemonSet per cluster. Multiple agents will cause unexpected behavior.
Once installed, metrics should appear in the Middleware dashboard within a few minutes. If they don't, confirm your cluster has outbound internet access (direct or via proxy) and that only one Middleware Agent is running per cluster.
mw-kube-agent Deployment Crashing#
If the mw-kube-agent deployment is crash-looping or getting OOMKilled, you may see the following in the Middleware UI:
- Cluster, namespace, and pod data not visible
- No detected applications in the apps list
- Missing Kubernetes resource metrics
This typically happens on large clusters where the default CPU and memory limits are insufficient. Increase the resource requests and limits in your values.yaml or edit the deployment.
DaemonSet Not Scheduled on All Nodes#
If mw-kube-agent or mw-lang-detector DaemonSet pods are not running on every node, your nodes likely have taints that the pods cannot tolerate. This is common in clusters using Karpenter or custom node pools.
Add the appropriate tolerations to your values.yaml or edit the daemonset yaml:
Google Kubernetes Engine (Private Cluster)#
In a GKE private cluster, the control plane cannot reach your worker nodes on port 9443 by default. To fix this, allow the control‑plane CIDR range access:
Find the control‑plane CIDR block
1gcloud container clusters describe <CLUSTER_NAME> \
2  --region <REGION> \
3  --format="value(privateClusterConfig.masterIpv4CidrBlock)"
Example:
1gcloud container clusters describe demo-cluster --region us-central1-c \
2  --format="value(privateClusterConfig.masterIpv4CidrBlock)"
Output:
1172.16.0.0/28Then you can add a firewall rule to allow ingress from this IP range and TCP port 9443 using the command below:
1gcloud compute firewall-rules create cert-manager-9443 \
2--source-ranges <GKE_CONTROL_PLANE_CIDR> \
3--target-tags ${GKE_CONTROL_PLANE_TAG} \
4--allow TCP:9443
For more details, see the GKE firewall documentation.
Applications Not Detected#
- Verify your application uses a supported language (Java, Node.js, Python, .NET, Go, Apache HTTPD, Nginx). Popular sidecar containers are skipped; only user application containers are checked
- For multi-container pods, ensure your main app container is listed first under
spec.containers. - Check that your application is in
Runningstate. - Inspect the language detector logs:
1kubectl logs daemonset/mw-lang-detector -n mw-agent-ns- If detection still fails, restart the detector:
1kubectl rollout restart daemonset/mw-lang-detector -n mw-agent-nsInstrumentation Not Working#
- Confirm the namespace is included in your auto-instrumentation scope.
- Ensure pods were restarted after enabling instrumentation.
- Check annotations under
spec.template.metadata.annotationsfor typos. - Review admission webhook logs:
1kubectl logs deploy/mw-auto-injector -n mw-agent-ns- Verify network connectivity from your pods to the Middleware Agent service:
1kubectl exec -it <pod-name> -n <namespace> -- curl http://mw-service.mw-agent-ns:9320- Inspect the OpenTelemetry Operator logs:
1kubectl logs deploy/mw-agent-opentelemetry-operator -n mw-agent-nsIf problems persist after these checks, please reach out to Middleware support with your logs and configuration details.
Need assistance or want to learn more about Middleware? Contact our support team at [email protected] or join our Slack channel.