Creating Alerts
Alerts in Middleware watch your data and notify you when something important happens, such as an error spike, high latency, missing hosts, or abnormal behaviour. Alerts use the same data/query layer you use on dashboards: pick the data source, define a metric and filters, choose how to aggregate and group, optionally add formulas, and (if needed) apply functions. The difference is that, instead of drawing a widget, the alert engine evaluates the time series you define and triggers notifications when conditions are met.
1. Create an Alert
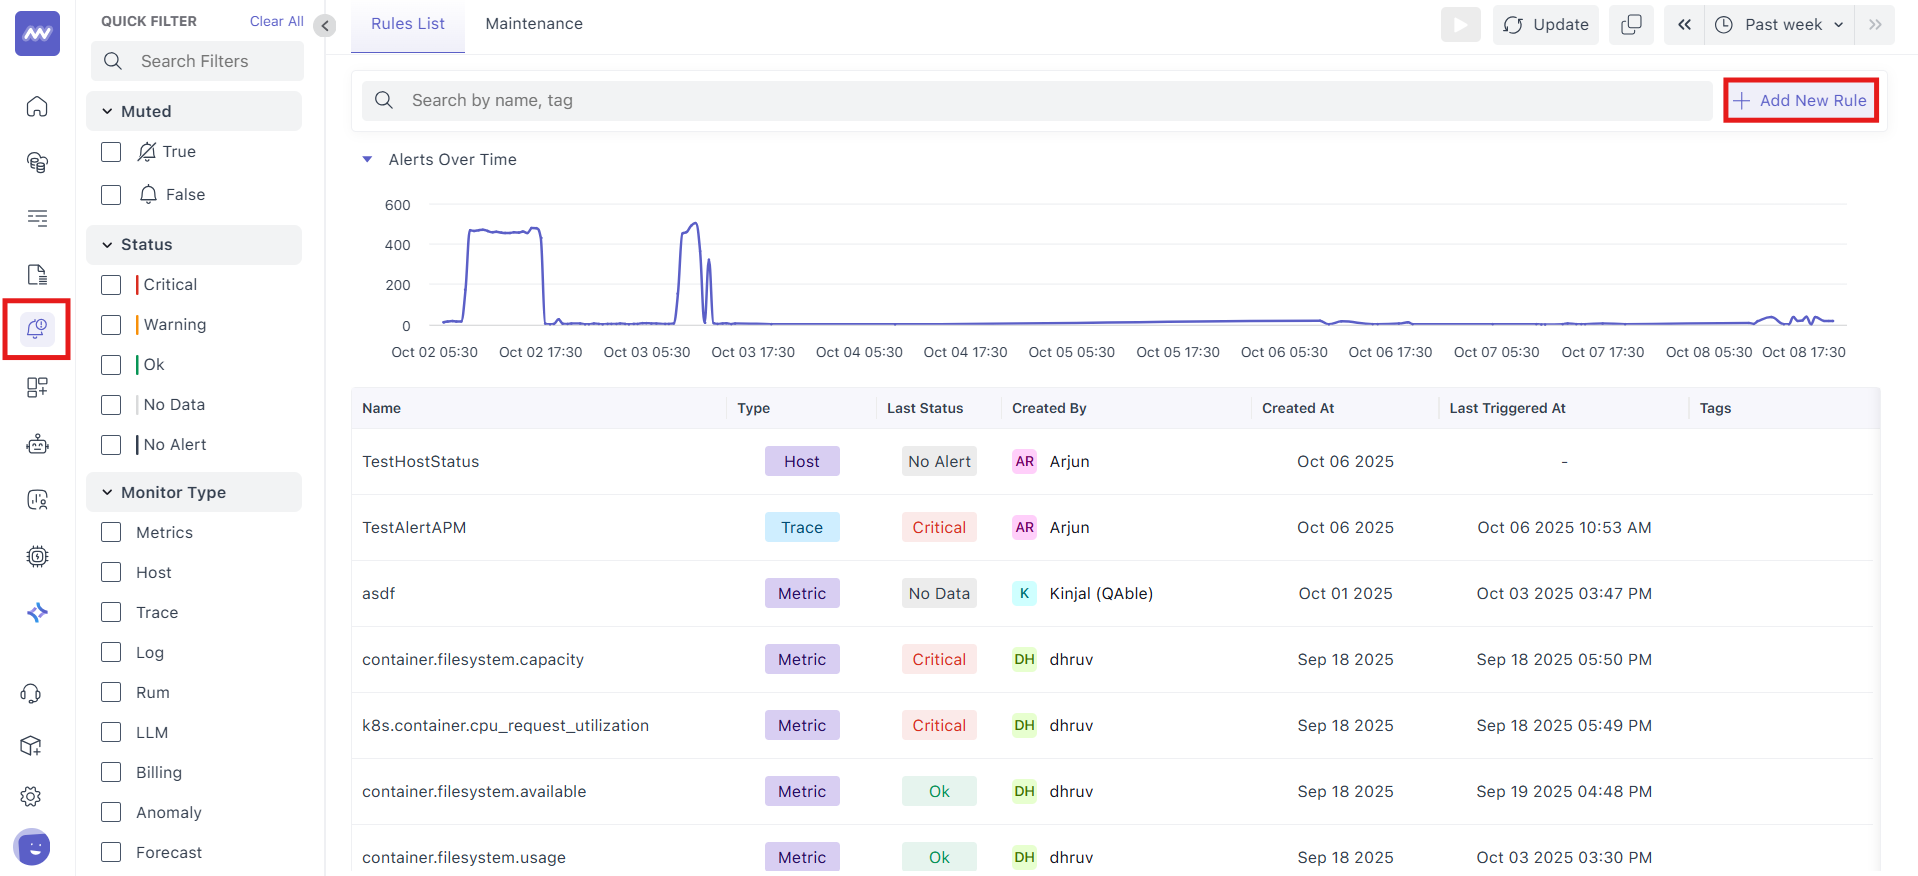
- In the left nav, click Alerts (bell icon).
- On the Rules List page, click + Add New Rule (top-right).
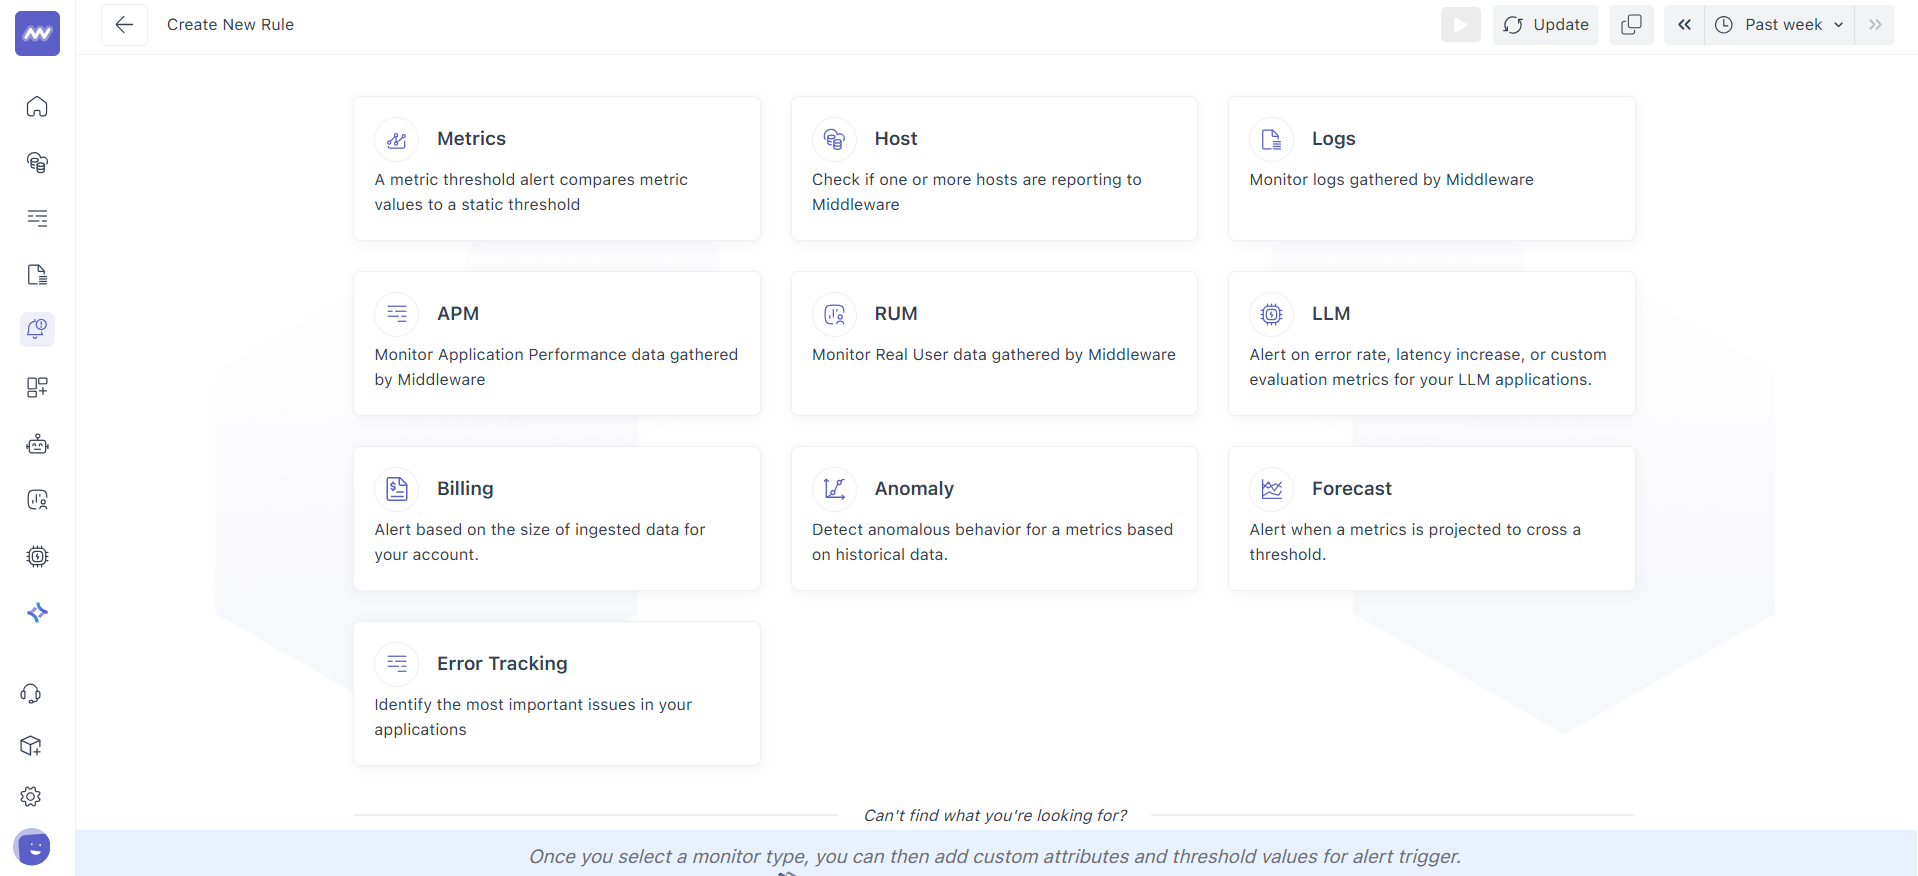
- Pick the monitor type (Metrics, Host, Logs, APM, RUM, LLM, Billing, Anomaly, Forecast, Error Tracking).
- You’ll land on the alert builder. The first step is Define the metric.
2. Define the Metric
This step shapes the exact time series the alert will evaluate. Think of it as building the data for a widget and then using it for alerting.
2.1 Select the data source (Look For)
Choose the resource that actually emits your metric: Service, Host, Container, Process, or All Metrics if you’re unsure. Only resources you’ve integrated are selectable; items with no data show as disabled (to prevent mis-configuration).
A. Metric
Pick the metric from the dropdown (search supported). The list is scoped to the resource you selected. Hovering a metric shows its description, unit, and attributes to help you pick the right one.
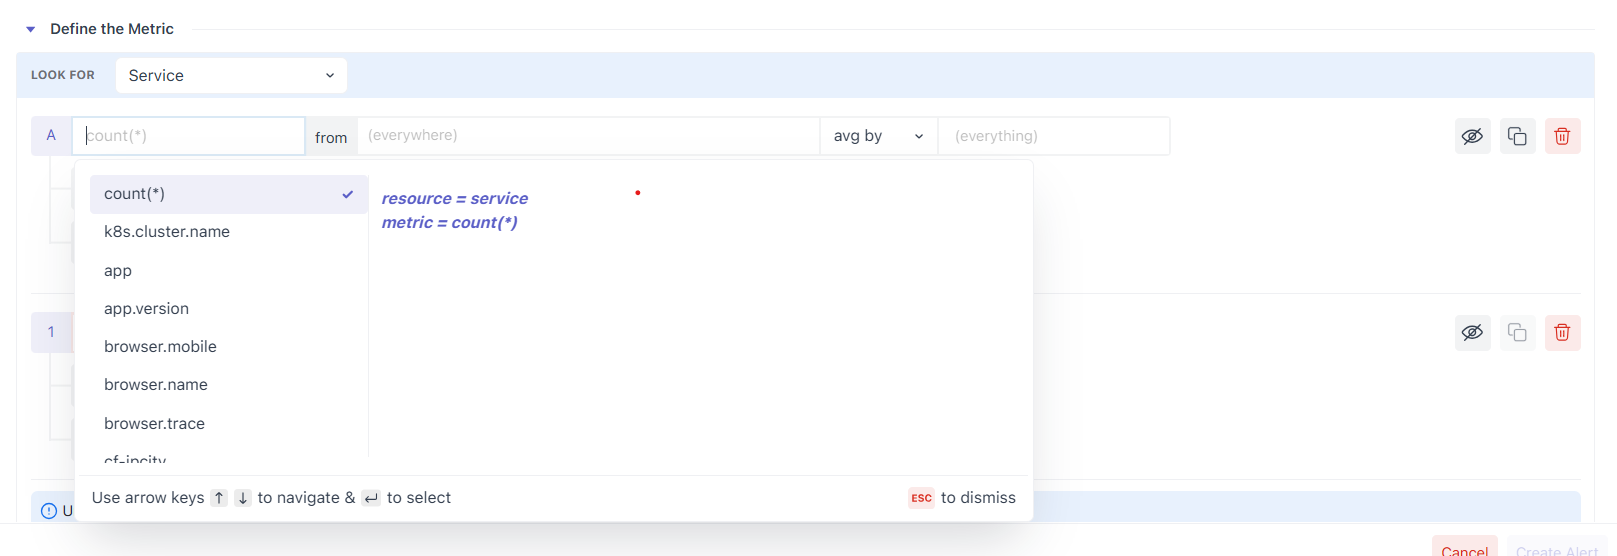
B. Filter (the from box)
Start with (everywhere) to include all sources, or narrow it with filters. The from box is autocomplete-driven: type an attribute/metric, pick an operator, then a value. You can chain conditions with AND/OR and group them with ( ).

Example:
(host.id != prod-machine AND os.type == mac) OR status == stopSupported operators
(Use these exactly as shown. Keep the same examples in your wording/UI.)
| Operator | Description | Example |
|---|---|---|
= (Equal To) | Match when a value equals the given value | os.type = linux |
!= (Not Equal To) | Match when a value does not equal the given value | host.id != prod-server |
IN | Match when a value is in a list | region IN us-east,us-west,eu-central |
NOT IN | Match when a value is not in a list | status NOT IN stopped,paused |
LIKE | Case-sensitive pattern match (% = wildcard) | service.name LIKE api% |
NOT LIKE | Exclude values matching the pattern | hostname NOT LIKE test% |
ILIKE | Case-insensitive version of LIKE | app.name ILIKE sales% |
NOT ILIKE | Case-insensitive exclusion | username NOT ILIKE admin% |
REGEX | Match by regular expression | env REGEX ^prod.* |
NOT REGEX | Exclude by regular expression | log.level NOT REGEX ^debug$ |
< | Numeric less than | system.cpu.utilization < 0.75 |
<= | Numeric less than or equal | system.processes.count <= 100 |
> | Numeric greater than | system.cpu.utilization > 0.9 |
>= | Numeric greater than or equal | system.memory.usage >= 500 |
2.2 Choose Aggregation and Aggregation Group
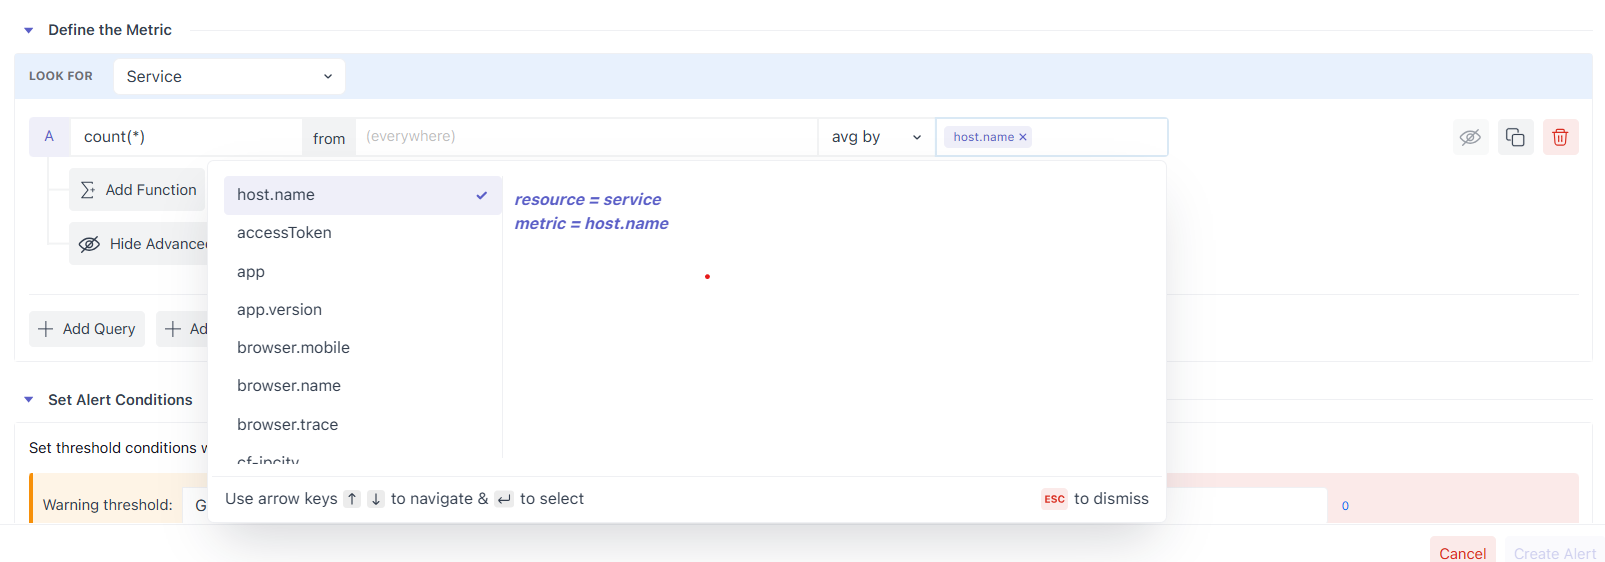
At any timestamp, multiple instances can report the same metric. Aggregation reduces them to one value (e.g., Average, Sum, Min, Max, Any, Uniq, Count, Group).

If you want per-entity alerts (e.g., one series per service or host), add an Aggregation Group such as service.name or host.id and each group becomes its own series and is evaluated separately by the alert.
2.3 Control Density with Roll-Up (aggregation over time)
Metrics often arrive every 5–20 seconds. To make evaluation stable (and charts readable), Middleware automatically rolls up raw points into larger time blocks, choosing a default interval based on the selected time window.
For example, one day of 5-second data is rolled up to 5-minute points (288 points), each an aggregate of 60 raw samples. You can override both the method (avg/sum/min/max) and the interval (e.g., 120 seconds) in Advanced Options → Roll Up.

Default Roll-up Intervals
| Time Window | Roll-Up Interval |
|---|---|
| < 1 hour | 30 seconds |
| < 3 hours | 1 minute |
| < 1 day | 5 minute |
| < 2 day | 10 minute |
| < 1 week | 1 hour |
2.4 Compose Results with Formulas
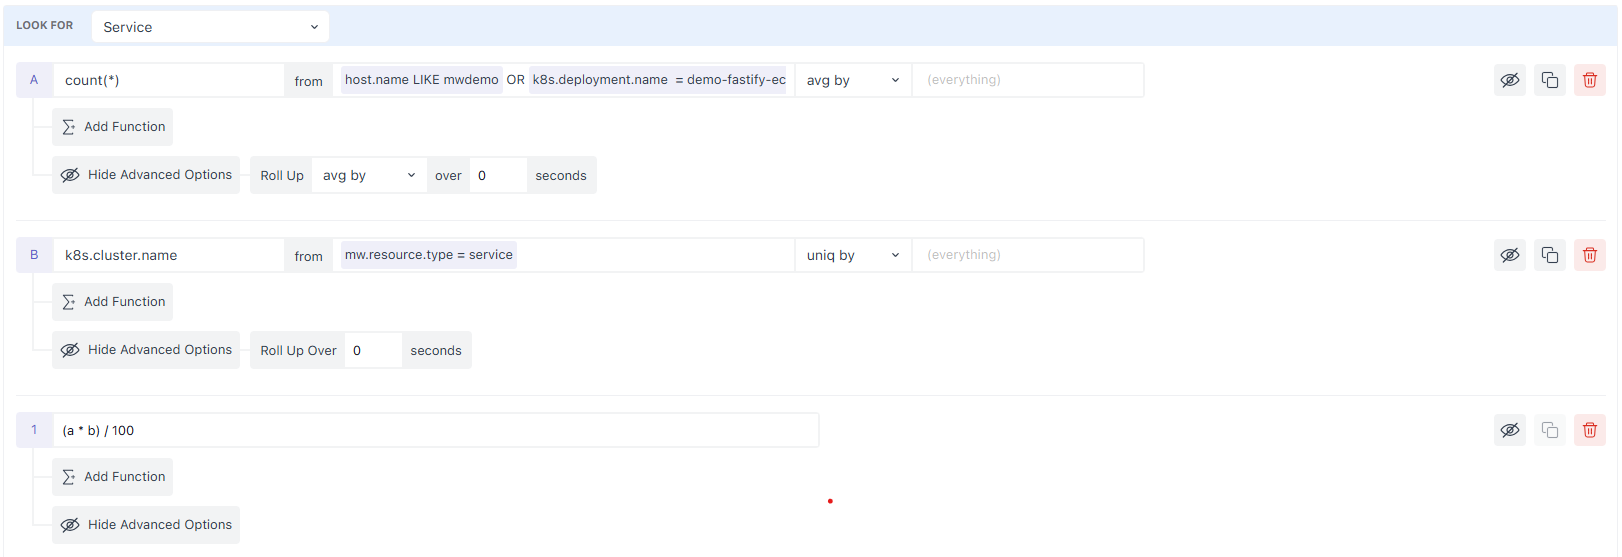
Add multiple queries (a, b, c, …) and write an expression to derive the signal you actually care about.
Example (percentage):
(a / b) * 100Rules
- Use the lower-case query letters as variables (
a,b,c…). - The expression must be a valid mathematical formula; only query letters are allowed as variables.
2.5 Post-process with Functions
Functions operate on a query or a formula output, and you can chain them. The Rate family is ideal for turning counters into change-per-interval views:
- Value Difference – current value minus the previous value.
- Per Second / Per Minute / Per Hour Rate – divide the difference by the elapsed seconds/minutes/hours.
- Monotonic Difference – like Value Difference but ignores negative drops caused by counter resets.
Use these to alert on rates (e.g., requests/second) rather than ever-growing totals.

Example:
| Timestamp | Value | Value Difference | Per Second Rate | Per Minute Rate | Per Hour Rate | Monotonic Difference |
|---|---|---|---|---|---|---|
| 2025-08-13 15:00:00 | 10 | N/A | N/A | N/A | N/A | N/A |
| 2025-08-13 15:01:00 | 12 | 2 | 0.0333 | 2 | 120 | 2 |
| 2025-08-13 15:02:00 | 15 | 3 | 0.05 | 3 | 180 | 3 |
| 2025-08-13 15:03:00 | 22 | 7 | 0.1167 | 7 | 420 | 7 |
| 2025-08-13 15:04:00 | 30 | 8 | 0.1333 | 8 | 480 | 8 |
| 2025-08-13 15:05:00 | 15 | -15 | -0.25 | -15 | -900 | 0 |
3. Set Alert Conditions
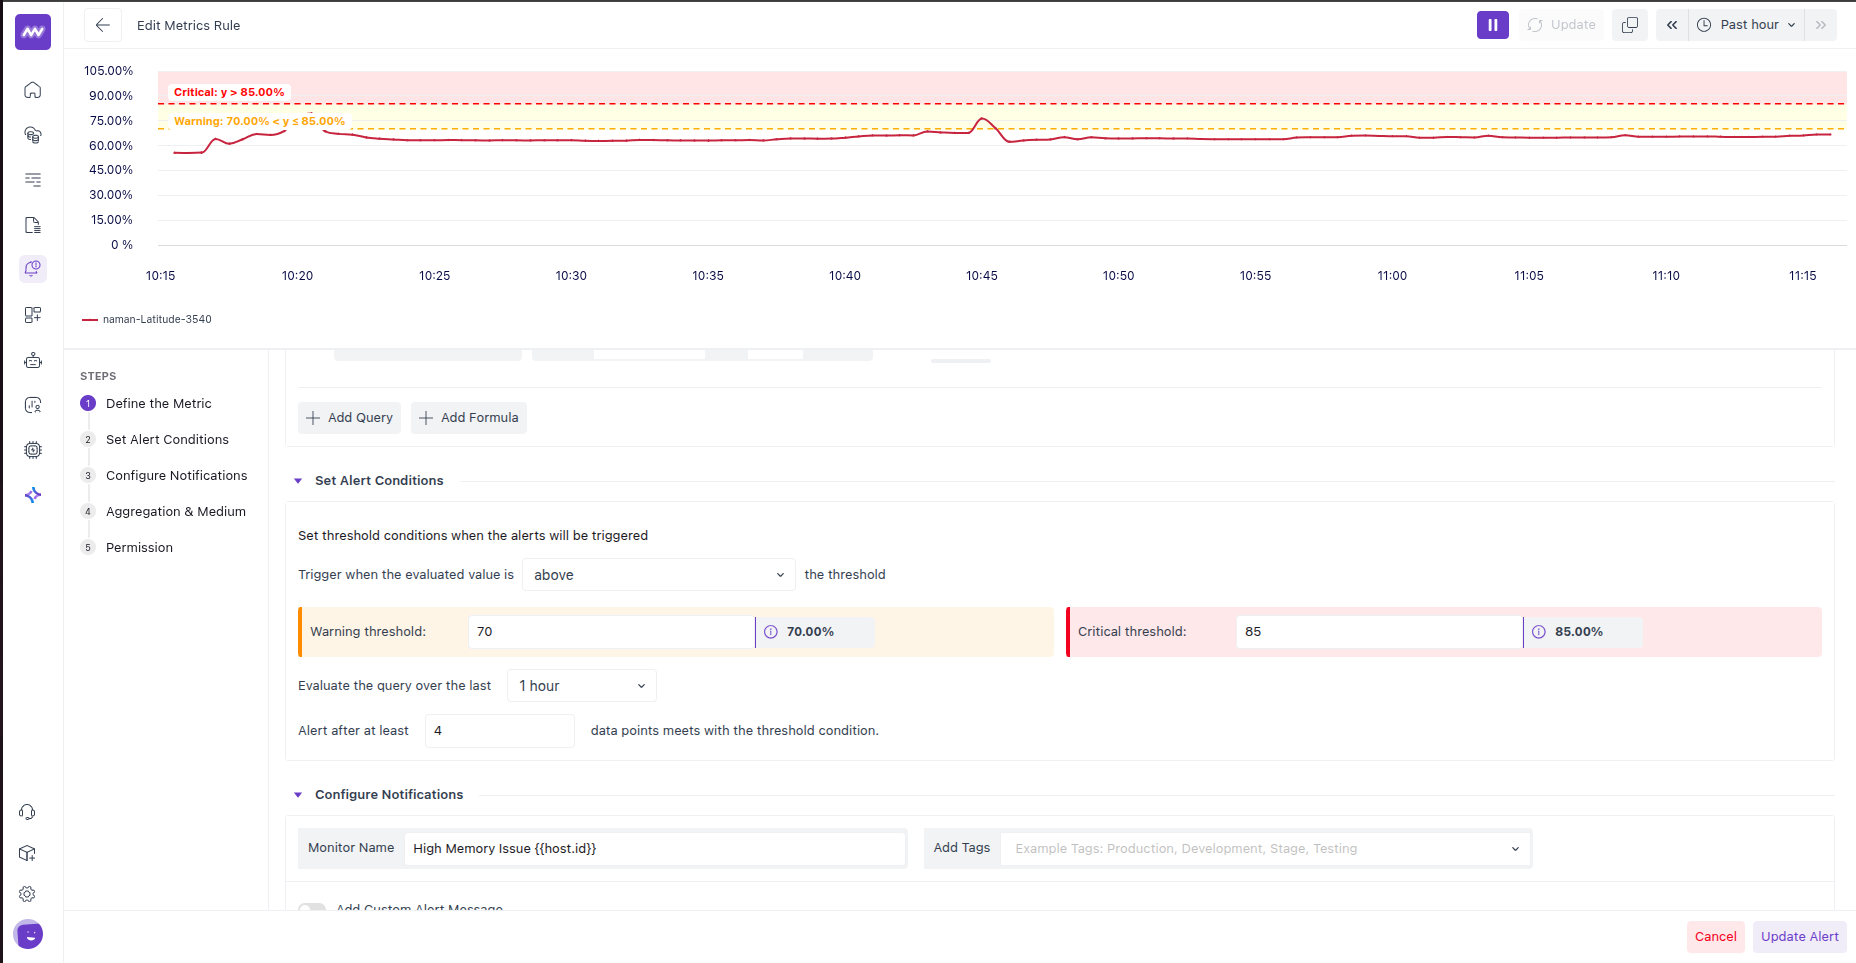
In this step, you will learn how to define conditions to send alerts and how they are categorised based on the criticality.
3.1 When to Trigger

In this section, you will define when to trigger the alert. For example, you might have defined a rule, but here you will specify whether the alert should be triggered when the collected data points are above the defined threshold or below it.
- Above means: fire when readings climb past your threshold. This fits percentages, latency, queue length, error rate, disk usage, etc.
- Below means: fire when readings drop under your threshold. This fits availability, free space, success rate, throughput, or any “should stay high” metric.
3.2 Warning Threshold

This is your lower-severity limit. Enter the raw numeric value in the actual unit the metric uses and Middleware will present it in a friendly way:
- If the metric is in bytes, type bytes; the field will auto-format to KB/MB/GB/TB when displaying. Typing
85899345920shows as “80 GB”. - If the metric is in seconds, type seconds; the field will show minutes / hours / days automatically. Typing
3600shows as “1 h” - If the metric is a percentage, type the number as-is; it will display as
%. Typing70shows as “70%”.
On the right you’ll notice a small pill that shows the current evaluated value of the series, so you can pick thresholds that make sense relative to what you’re seeing.
3.3 Critical Threshold
This is your higher-severity limit. It accepts values exactly like the Warning field (raw number; UI formats it for readability). With the operator set to above, any value greater than this number moves the alert to Critical. If you only want Warning alerts, leave Critical empty; if you only want Critical alerts, leave Warning empty.
3.4 Query Evaluation

This sets the look-back window suggesting how far back we should look when deciding whether to change state. The options read like “last 5 m”, “1 h”, “1 d”.
What it really does: the engine ignores data outside this window and evaluates the series only within it. Short windows are best for catching quick spikes; longer windows are best when you care about sustained trends or slower drift.
A practical detail: the number of data points inside the window depends on your roll-up interval from the previous step. For example, a 1-hour window with a 1-minute roll-up yields ~60 points to evaluate.
3.5 Data points for alerts
This is your noise filter. It tells the engine, “Don’t trigger the alert until it has happened at least N times inside the window.”
What counts as a “data point”: it’s the rolled-up sample from your query (not every raw second). If your roll-up is 1 minute, then each point represents 1 minute of data. With a 1-hour window and 1-minute roll-up, setting N = 4 means the condition must be met on four points, about four minutes in total, somewhere within that hour. Those points don’t have to be back-to-back unless your use case demands it.
Why it matters: a higher N reduces flapping and false positives (more confidence, slower to fire). A lower N reacts faster but can be noisy.
4. Configure Notifications
This part is where you make the alert understandable to people who receive it. Think of it as the title and body of the notification.
4.1 Monitor Name (this is your “error name”)
Give the rule a clear, unique name that instantly tells someone what, where, and how bad.

4.2 Add Tags
Tags help with routing and filtering. Add labels like prod, backend, payments, sev2, or team-observability.

Tags also allow you to filter alerts from the left bar.

4.3 Add Custom Alert Message (this is your description)
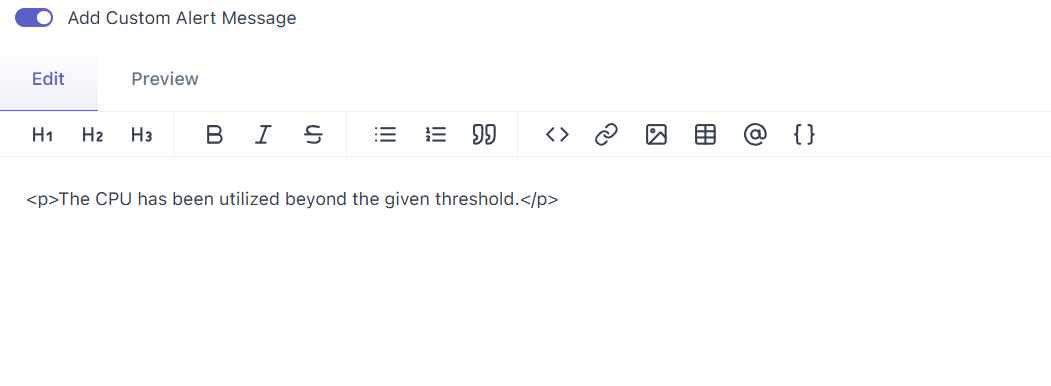
Toggle on to write a custom message. The editor supports headings, links, code, and (where supported) dynamic placeholders via the {} button—for example, host or service names, current value, and threshold. Use them to make messages precise. If you don’t add a message, Middleware sends a sensible default like “The CPU has been utilized beyond the given threshold.”
What a good description covers (in order)
- What happened: Plain sentence that mirrors the rule.
- Where it happened: Service/host/environment/region.
- How bad it is: Current value vs threshold, and the look-back window.
- What to do next: One or two concrete actions or a runbook link.
- Where to dig deeper: Link to a relevant dashboard, trace search, or log view.
5. Aggregation & Medium
This step controls reminders while an alert stays in the same state. Your initial notification already went out when the rule changed to Warning, Critical, or Ok. Renotification decides if and how often you want to ping people again until the state changes. The reminders go through the same channels you picked in Configure Notifications.
5.1 Renotification (toggle)
Turn this on if you want periodic reminders while the monitor remains in a chosen state. Leave it off if one message at state change is enough.

5.2 Renotification Conditions
This line has two parts:
- The state selector: Choose Critical, Warning, or Ok.
- Critical: Most common. Keeps paging until someone fixes the issue.
- Warning: Useful for sustained yellow states you don’t want to ignore.
- Ok: niche/heartbeat use-case. For example, if you need an “it’s still healthy” ping during an incident bridge. Most teams leave this off.

- The interval: How often to send the reminder (e.g., 10 minutes, 30 minutes, 1 hour).
- Shorter intervals increase urgency but add noise.
- Typical starting points: Critical → 10–15 min, Warning → 30–60 min.
How it behaves: The timer runs until the monitor remains selected. If the state changes (e.g., Critical → Ok), the renotify loop resets.
5.3 When to stop renotifying
Adds a hard cap on the total number of reminders for the same continuous incident. Once the cap is reached, reminders stop; if the state clears and later re-enters the same state, the counter resets.
- Prevents channel fatigue during long outages.
- Reasonable caps: Critical → 3–6, Warning → 2–4.
5.4 Renotification message
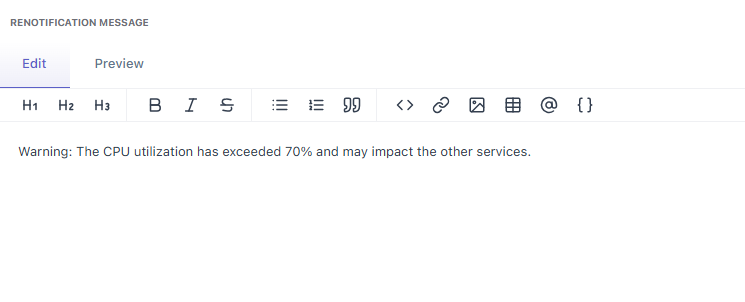
This is the body of the reminder. It’s separate from your initial “Custom Alert Message,” so you can keep reminders short, actionable, and time-aware. The editor supports headings, links, and placeholders (the {} button) like {service.name}, {host.name}, {value}, etc.
What to include (keep it tight):
- State + metric in the first sentence.
- Current value vs threshold and how long it’s been in this state.
- One action or one link (runbook or dashboard).
5.5 Medium

Email: Best for detailed messages and people who aren’t in chat tools. Add one or more recipients in the input box. Emails include the alert text and, by default, a small graph of the metric so recipients can see the trend at a glance.
Slack: Good for fast team response. Choose the Slack destination (channel or user, depending on your setup). Slack messages use your alert text; the graph is included unless you hide it. Use links to your dashboard/runbook so responders can jump straight in.
Opsgenie: Use when you want proper alert/incident handling with on-call schedules. Middleware sends the alert to Opsgenie; routing, priorities, and escalations are handled on the Opsgenie side.
Microsoft Teams Similar to Slack: post to a chosen channel with your alert text and optional graph. Useful for status rooms or team channels.
PagerDuty Use for on-call paging. Middleware opens/updates an incident in the selected PD service; escalation and deduplication are managed by PagerDuty. Keep titles concise and add one runbook link in the body.
Webhook For custom systems. Middleware makes an HTTP POST to your endpoint with the alert payload so you can fan out to anything (ticketing, SMS, custom bots). Use when other built-ins don’t fit.
You can combine channels. A common pattern is PagerDuty (Critical) + Slack (all states) + Email (stakeholders).
6. Permission: who can edit this alert
This section controls edit access for the alert rule. You have two modes:
6.1 Unrestricted
Choose Unrestricted when you’re okay with the default behavior: Any user who already has the global right to create/manage alerts in your Middleware workspace can edit this rule. It follows your organisation’s normal permissions, no extra list to maintain here.
6.2 Restricted

Choose Restricted when you want to pin edit access to specific users for this rule only.
How to use it:
- User picker + Add User (left): start typing a name, pick a user from the dropdown, then click Add User. The selected person is granted edit access to this rule.
- Users with Edit Access (right): a table of everyone who currently has edit rights to this alert, each with a checkbox.
- Select All lets you select every user in one click.
- Remove Selected removes edit rights for the checked users.
Need assistance or want to learn more about Middleware? Contact our support team at [email protected] or join our Slack channel.