August 26, 2026
Middleware v2.8.1 updates application performance monitoring (APM) trace inspection, RUM Session Replay, and Dashboard Builder. The release also adds Zenduty alert notifications and more code, image, and stack trace context for OpsAI investigations.
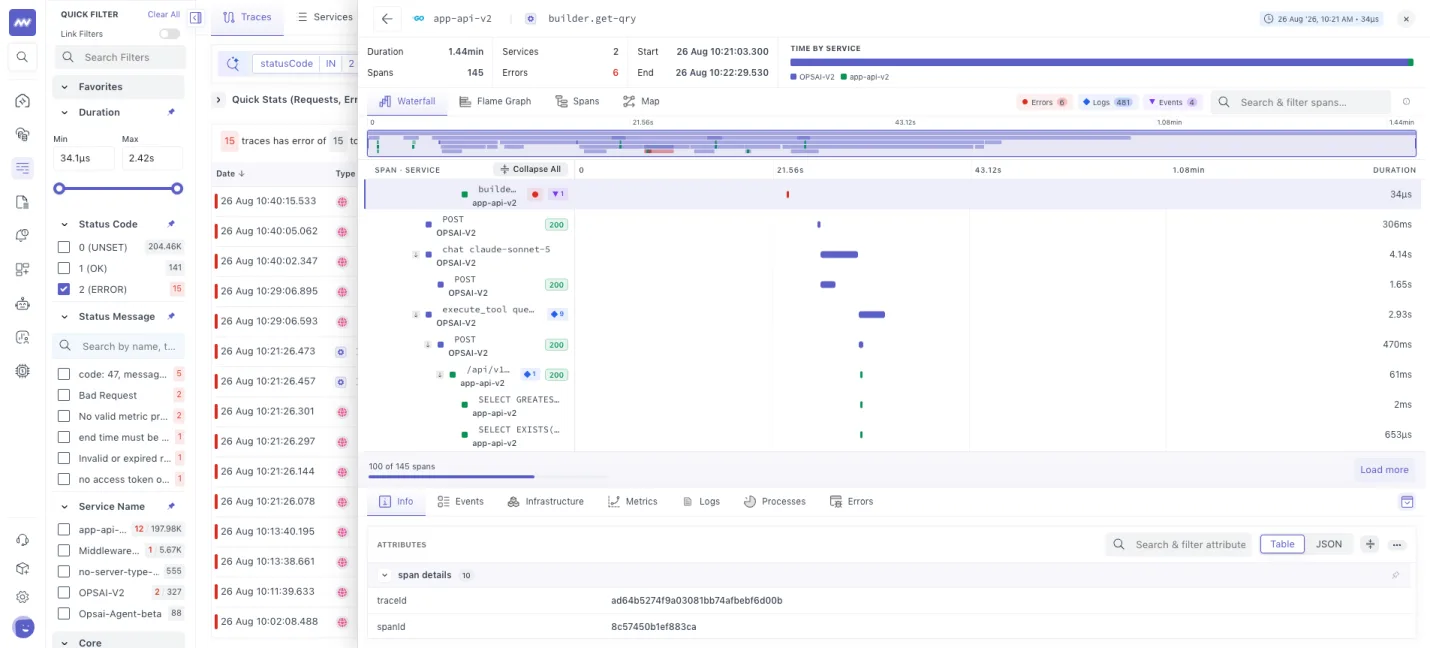
APM Trace and Span Inspection#
APM Trace Explorer now includes updated trace and span detail panels. Filter to spans containing errors, logs, or events with a single click to focus on relevant operations in a large trace.
Zenduty Alert Integration#
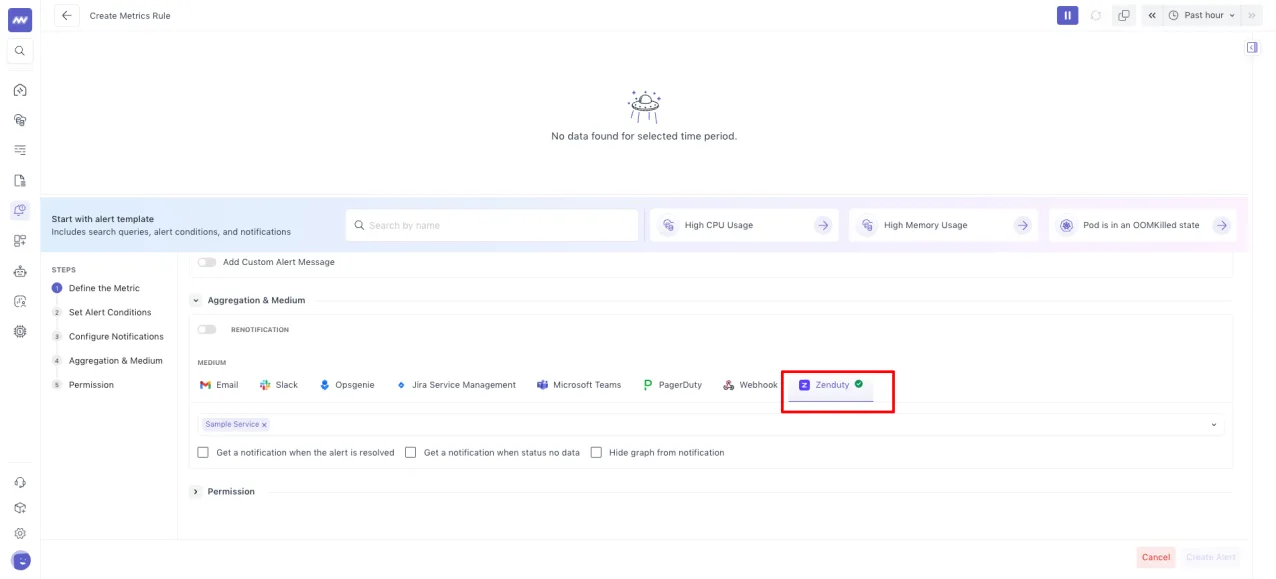
The Zenduty integration routes Middleware alerts to the selected Zenduty service and keeps incident status aligned with alert status.
- Incident creation: Middleware alerts create incidents in the selected Zenduty service.
- Severity mapping: Alert severity maps to incident priority.
- Automatic resolution: Zenduty incidents resolve when the corresponding Middleware alert recovers.
RUM Session Replay and Debugging Events#
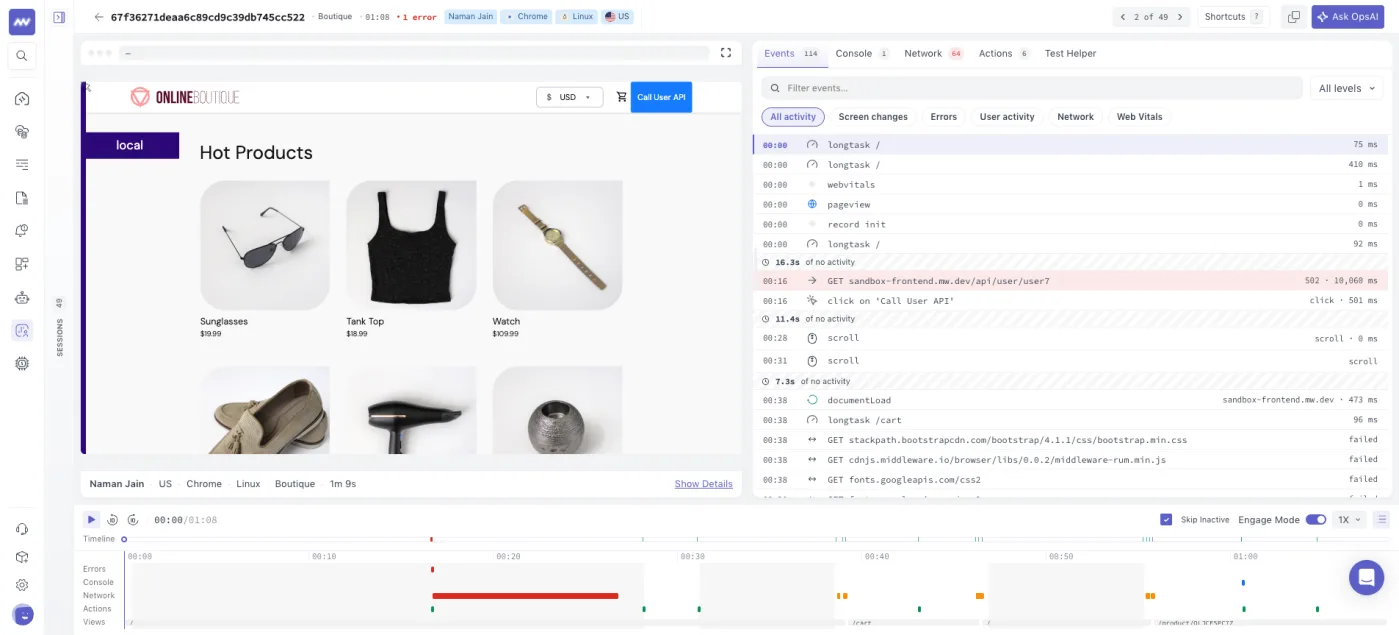
The updated RUM Session Replay view connects recorded activity with debugging events so you can inspect what happened before a user encountered an issue.
- Timeline navigation: Jump to errors, network events, console events, or user actions in the timeline and replay.
- Activity panel: Review screen changes, errors, actions, network activity, and Web Vitals in one panel.
- Event filters: Search and filter events by type and severity.
Dashboard Graphs and Query Settings#
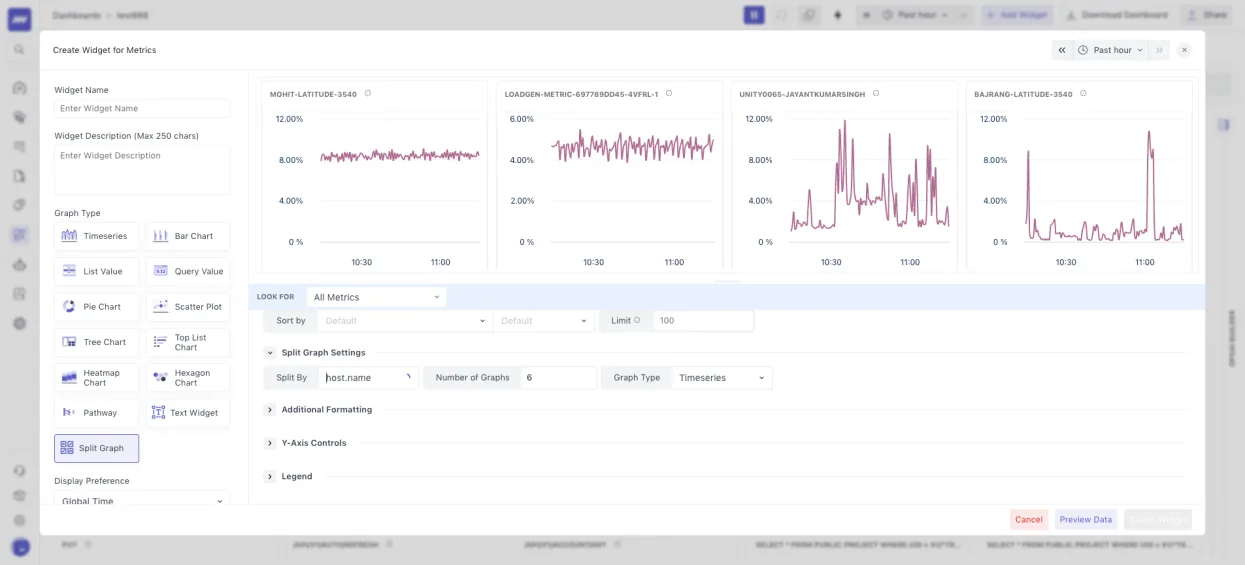
- Split by Graph: Split a graph by an attribute to create separate widgets, such as CPU utilization for each host.
- Heatmap Graph: View utilization spikes and hotspots across attribute values.
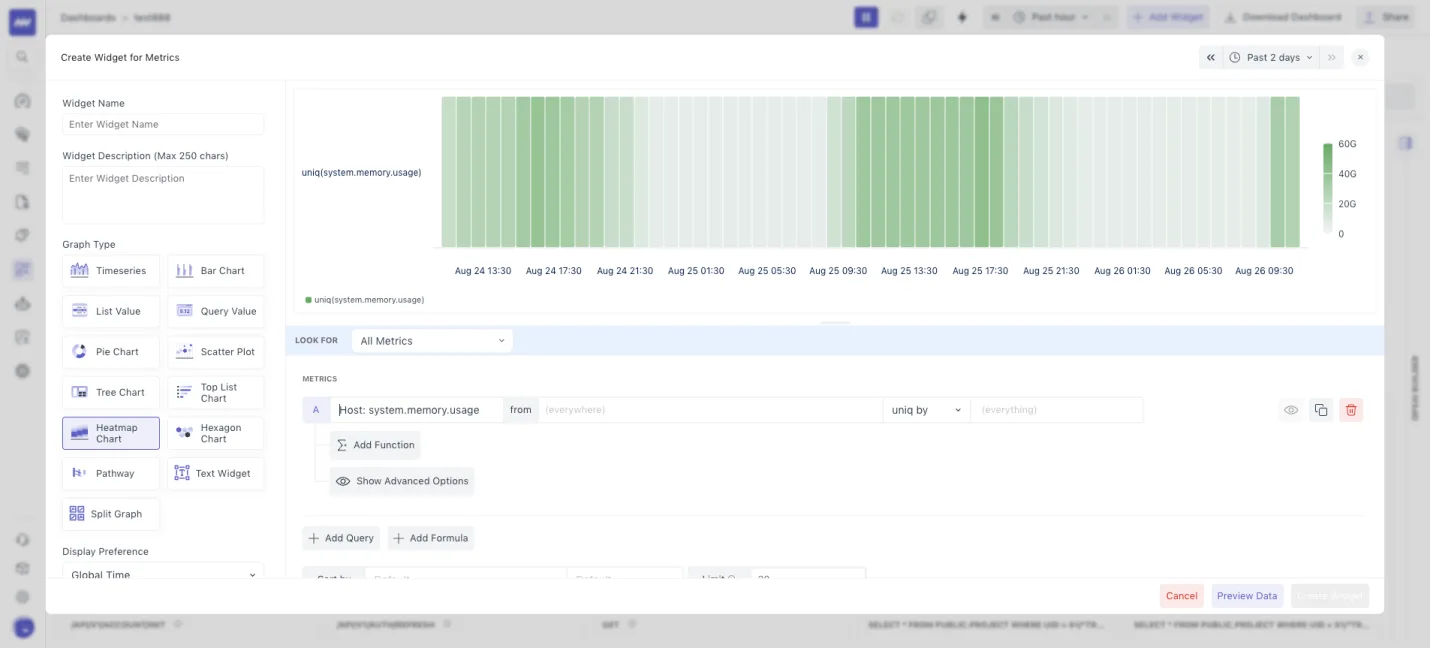
- Apply All: Apply filters, grouping, and rollup settings to every query in a widget without repeating the configuration.
OpsAI Investigation Context#
- Code changes: Use commit history, blame, and diff tools to connect issues with relevant code changes.
- Image input: Upload images in new chats, alert creation, and dashboard creation for OpsAI analysis and suggested fixes.
- Stack traces: OpsAI uses available minified stack traces to infer additional details when full stack information is missing.
Fixes and Improvements#
- Performance: Improved frontend performance.
- Log Patterns: Fixed flickering when drilling into log patterns.
- Synthetic assertions: Fixed validation issues for synthetic test assertions with empty values.
- Support access: Added an option in User Invite to grant Middleware Support account access for troubleshooting.
- Filters and panels: Updated filter scrolling and expanded panels to avoid covering the main view.
Need assistance or want to learn more about Middleware? Get in touch with us via our Contact Us or join our Slack channel.
What did you think of this content?