Customizing Metric Unit
Each metric value is associated with a unit that defines how the value should be interpreted—whether it's in seconds, bytes, percentages, CPU cores, or other measurements. Correctly assigning a unit ensures that your data is accurately visualized and easy to understand.
Examples:
system.cpu.time: Represents the total time the CPU spends on tasks, measured in seconds.system.cpu.utilization: Indicates the percentage of CPU used by all processes, measured in percent.
Many metrics have a default unit already configured. When visualized in charts or dashboards, the UI automatically uses this default to format and label the data appropriately. For instance, the system.cpu.utilization metric is rendered using a percent sign (%) to indicate percentage usage. Metrics without a configured display unit are formatted from their OpenTelemetry unit (see Automatic Units from OpenTelemetry).
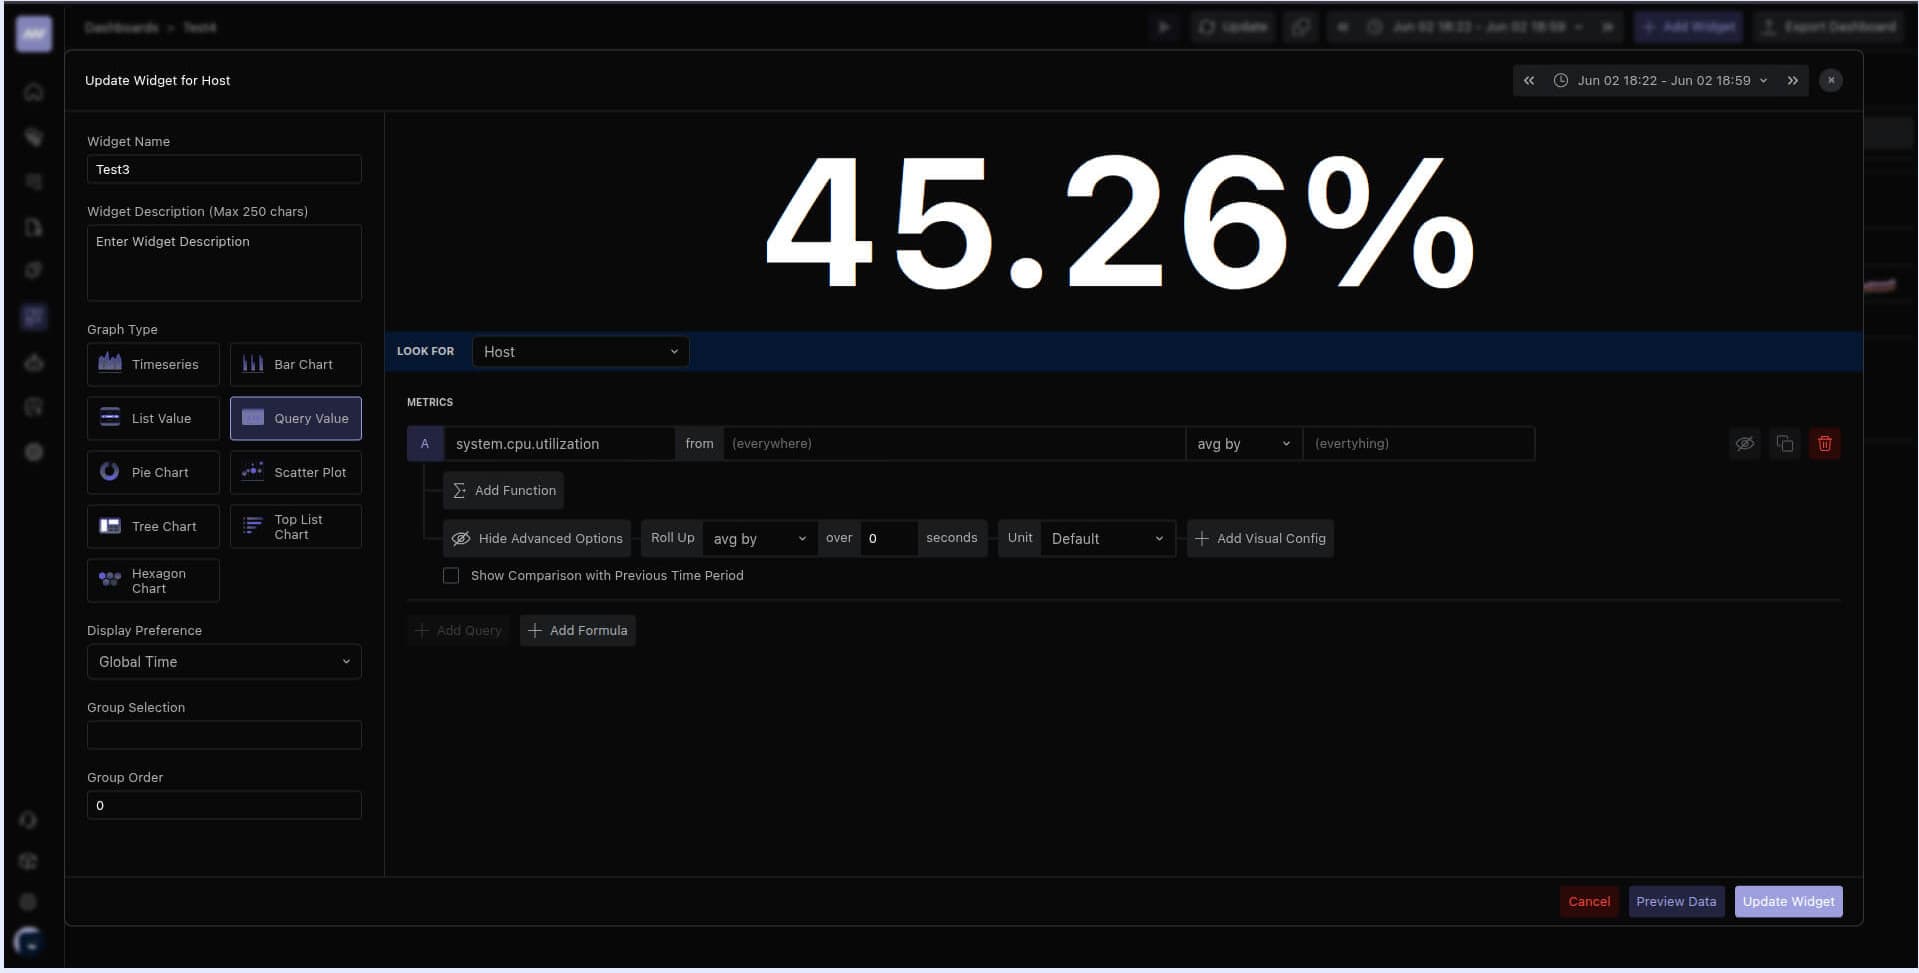
Where the unit appears depends on the widget type. In a Query Value widget, the unit is shown with the value:
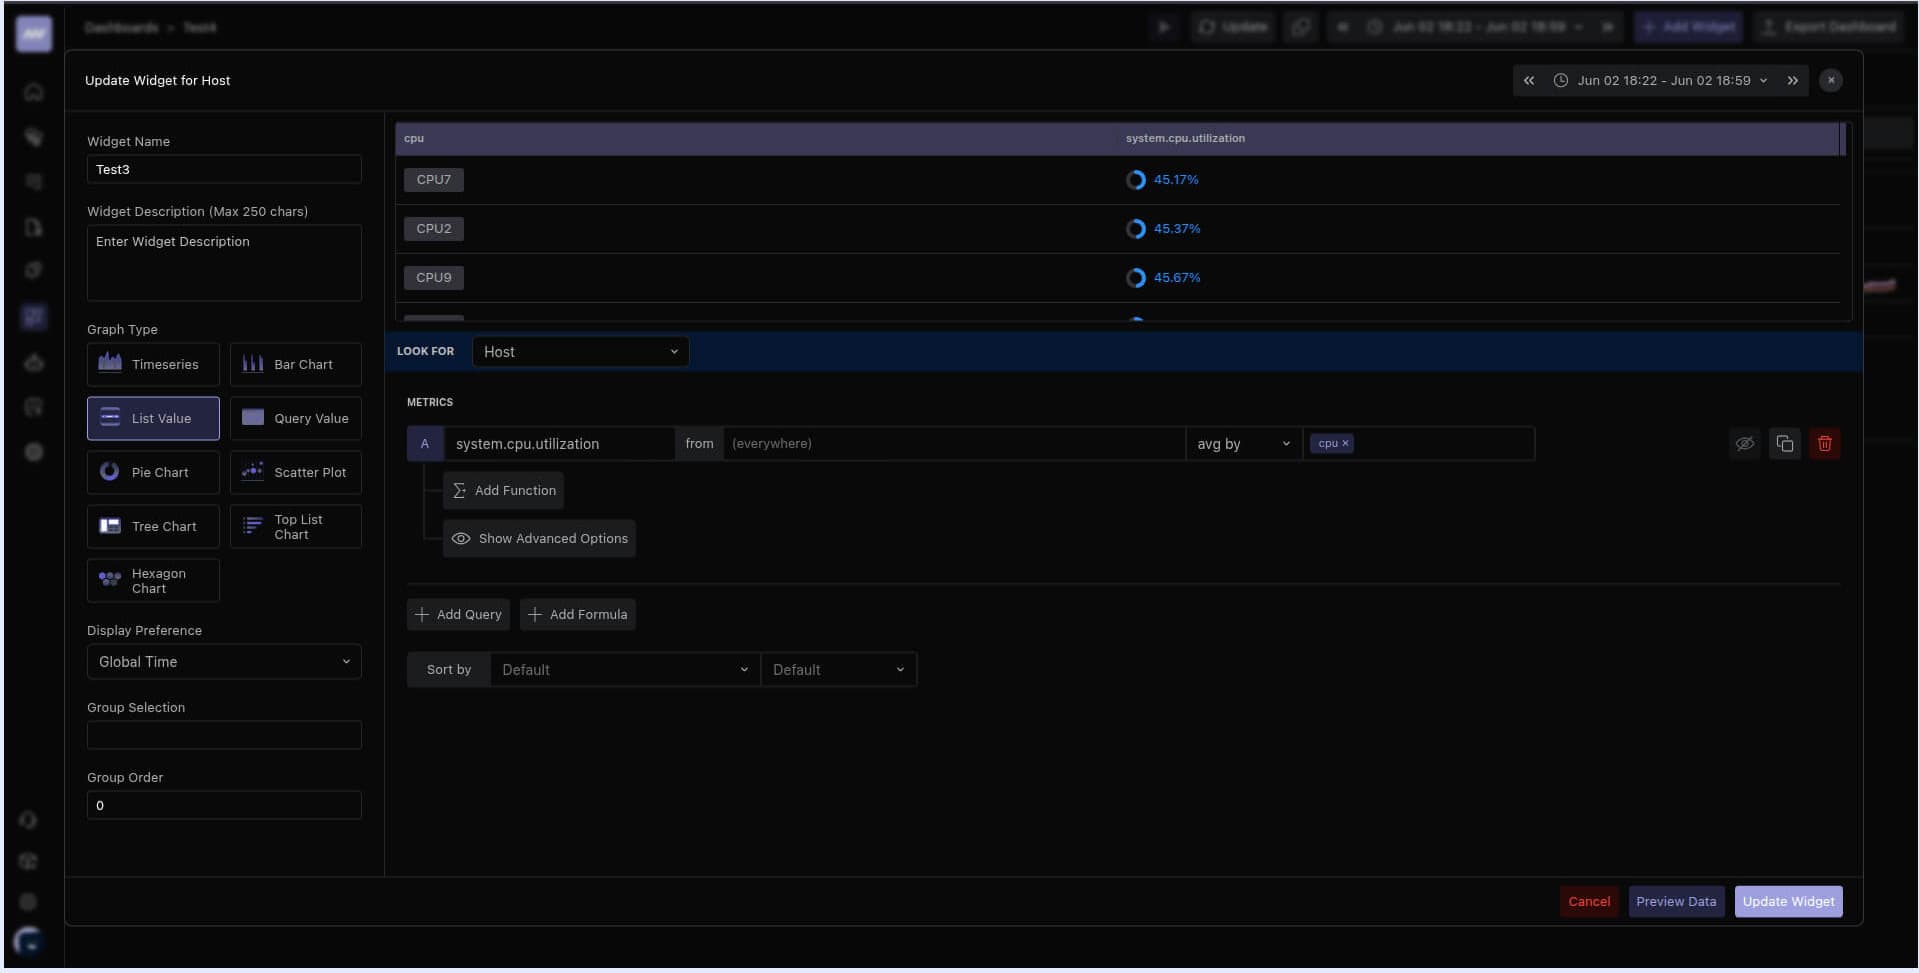
In a Table widget, the unit is shown in each cell:
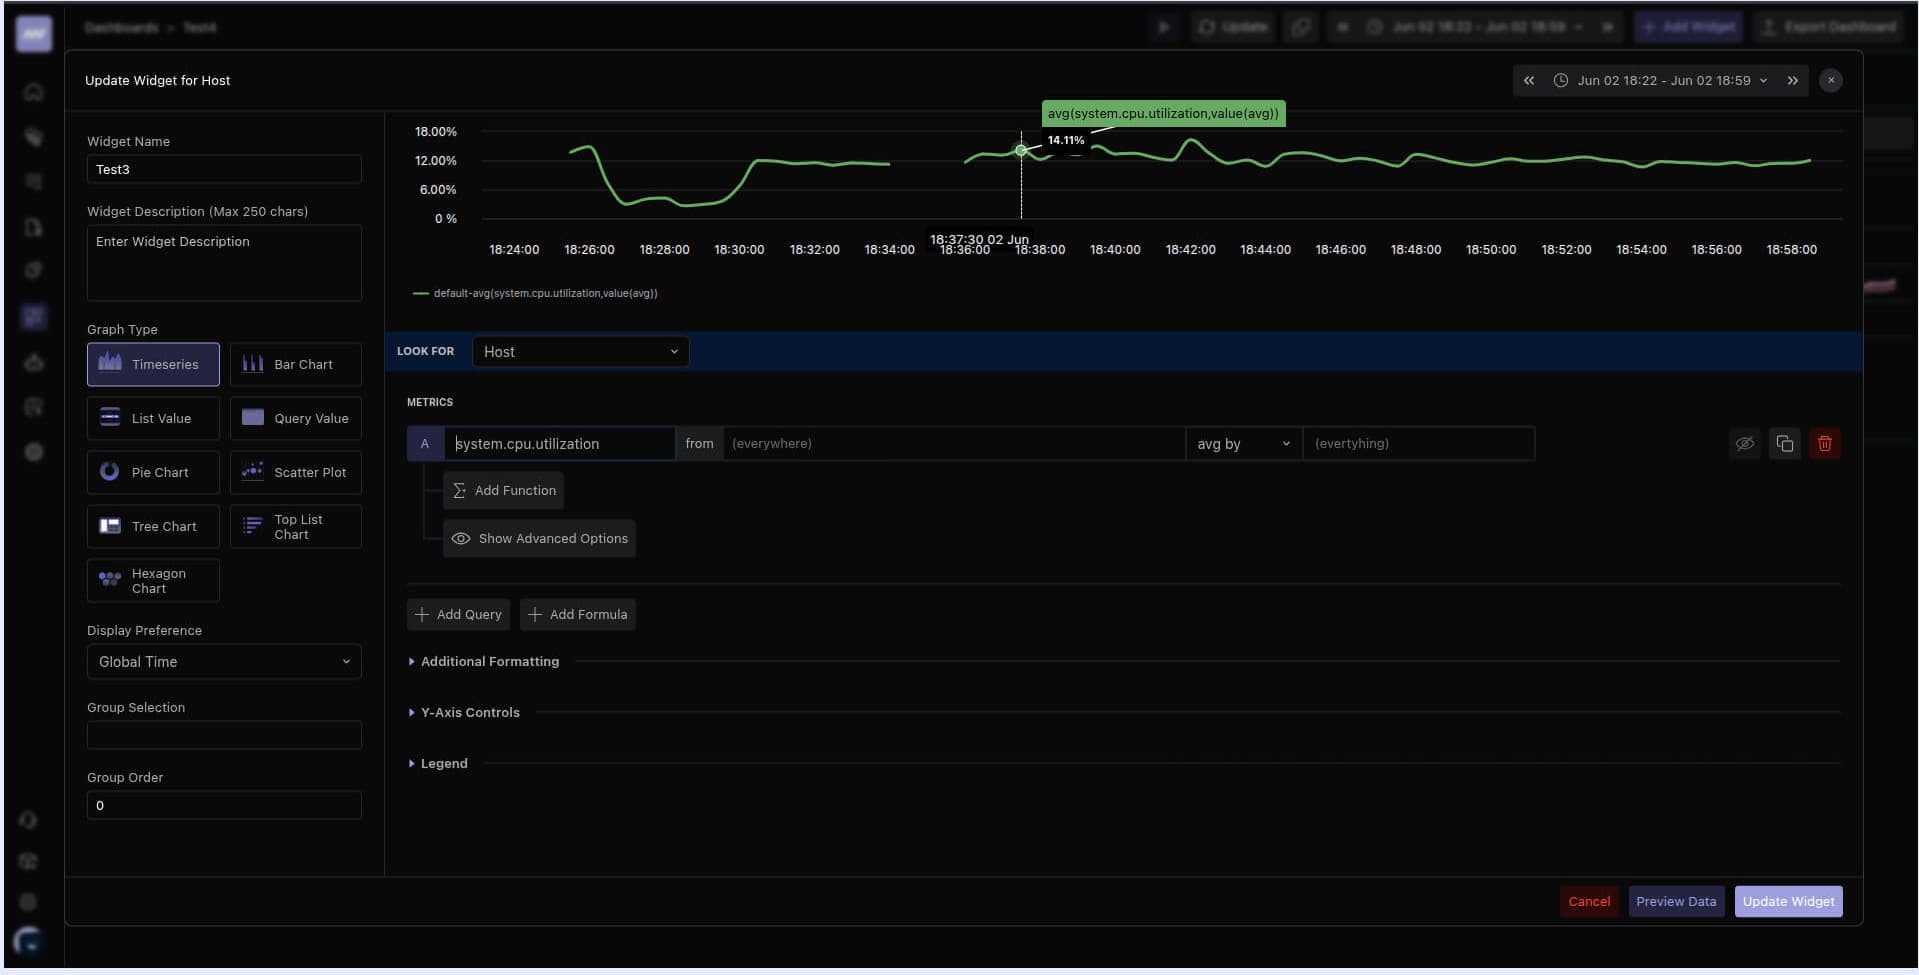
In Timeseries, Pie, and Tree charts, the unit appears in the tooltip when you hover over the data:
Automatic Units from OpenTelemetry#
When you leave the unit set to Default, Middleware picks a unit for each metric in this order:
- Configured display unit: If the metric has a display unit configured in Middleware, that unit is used.
- OpenTelemetry unit: Only if no display unit is configured and the metric reports an OpenTelemetry unit that Middleware recognizes (see the table below), the mapped unit is used.
A unit you select for the query in the widget always overrides all of these.
OpenTelemetry units use UCUM notation and are case-sensitive. The unit only tells the dashboard how to read the value. The value itself is not converted, and auto scaling then picks a readable size, so a metric reported in ms with a value of 1500 is displayed as 1.5 s.
| OpenTelemetry Unit | Displayed As |
|---|---|
ns, us (µs), ms, s, min, h, d | Time |
By | Bytes (Binary) |
KiBy, MiBy, GiBy | Bytes (Binary) |
kBy, MBy, GBy | Bytes (Decimal) |
bit, kbit, Mbit, Gbit | Bits |
By/s, bit/s | Bytes Rate, Bit Rate |
% | Percentage |
Hz, kHz, MHz, GHz | Frequency |
{cpu}, {core}, {cores} | CPU (cores) |
USD | Dollars |
{request}, or any other {…} annotation | Count |
{packet}/s, or any other {…}/s | Count Rate |
Some additional rules apply:
- Annotations are ignored when a base unit is present. For example,
s{CPU}is treated ass. - Quotients become rate units. A unit such as
MiBy/sorkBy/minis shown as the first unit with per set to the second, for exampleMiB/s. - Cloud integration spellings are recognized. Units such as
Seconds,Bytes,Kilobytes/Second,Percent, andCount/Secondmap the same way as their OpenTelemetry equivalents.
Customizing the Unit#
In some cases, you may want to override the default unit, especially if you know the data's context better or need to align it with a specific reporting format. The unit can be customized for any widget type.
Selecting a unit tells Middleware how to interpret the raw value; it does not convert the value. Choose the unit the metric is actually reported in. For example, if a metric is reported in milliseconds and you select Seconds, every value is displayed 1000× too large.
To set a custom unit:
- Open the widget in the Dashboard Builder and go to its query.
- Click Show Advanced Options in the query panel.
- In the expanded section, locate the Unit field.
- Select the appropriate unit from the dropdown.
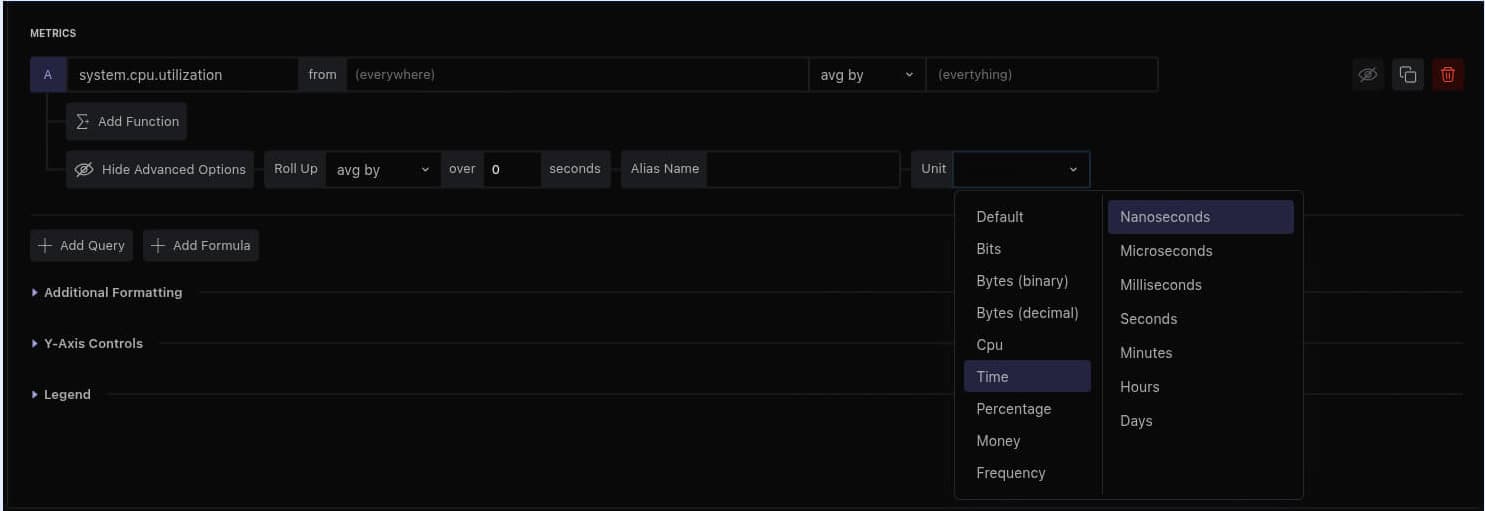

The metric values will now be interpreted and displayed using the selected unit. A unit you select always takes priority over the metric's default unit.
Tip: If you're unsure of the correct unit, leave the Default option selected. The system will apply the most suitable unit automatically based on the metric.
Auto Scaling#
The system automatically scales the value to a larger or smaller unit in the same family for better readability. For example, with the unit set to Kibibyte (KiB):
| Raw Value | Displayed As | Instead Of |
|---|---|---|
32343454534 | 30.12 TiB | 32343454534 KiB |
0.0035 | 3.58 B | 0.0035 KiB |
Adding a Rate Unit#
If your metric represents a rate, such as a value over time (e.g., requests per second), you can specify this as well:
- Click the + icon next to the unit dropdown.

- A per dropdown appears next to the unit. Choose a rate unit, for example Seconds (
/s), Minutes (/min), or Dollars (/$). To remove the rate, click the × icon next to it.
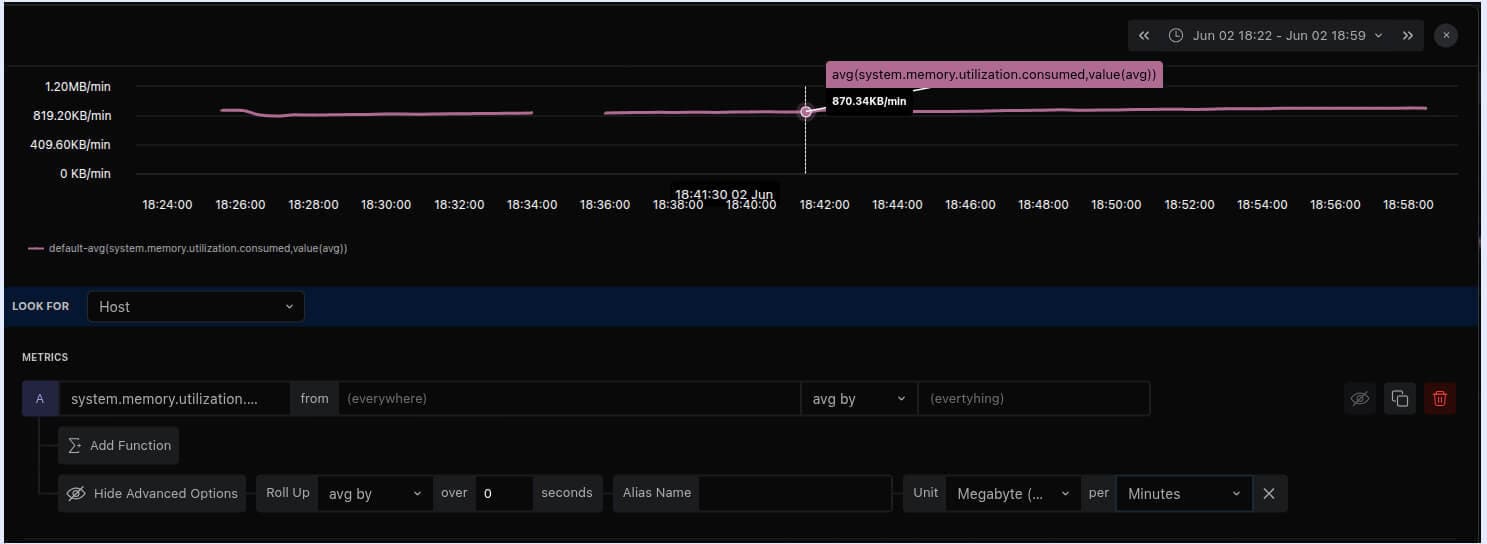
This ensures that rate-based metrics are accurately labeled and rendered, making your dashboards more informative and easier to interpret. When you apply a rate function to a query, per is set automatically.
Unit List#
| Type | Unit |
|---|---|
| Bits | Bit / Byte / Kilobit (kb) / Megabit (mb) / Gigabit (gb) |
| Bytes (Binary) | Bit / Byte / Kibibyte (KiB) / Mebibyte (MiB) / Gibibyte (GiB) |
| Bytes (Decimal) | Bit / Byte / Kilobyte (KB) / Megabyte (MB) / Gigabyte (GB) |
| CPU | nanocores (ncores) / microcores (μcores) / millicores (mcores) / cores / kilocores (Kcores) / megacores (Mcores) / gigacores (Gcores) |
| Time | Nanoseconds / Microseconds / Milliseconds / Seconds / Minutes / Hours / Days |
| Percentage | Percentage |
| Money | Dollars |
| Frequency | Hertz / Kilo Hertz / Mega Hertz / Giga Hertz |
| General | Date Format / Time Ago / Ago / Bytes Rate / Count / Age / Seconds / Percentage Rate / Percentage Without Bar / Badge / Text Style / Cost / Icon / OS Icon / Bit Rate / Time Utilization / Count Rate / Status / Rate / Nanosecond / Milliseconds |
Examples#
| Unit | Family | Raw Value | Formatted |
|---|---|---|---|
| Bit | Bits | 3 | 3 b |
| Byte | Bits | 500234.3454 | 4 mb |
| Kilobit | Bits | 0.5 | 62.5 B |
| Megabit | Bits | 5 | 5 mb |
| Gigabit | Bits | 50 | 50 gb |
| Bit | Bytes (Binary) | 10 | 1.25 B |
| Byte | Bytes (Binary) | 50 | 50 B |
| Kibibyte (KiB) | Bytes (Binary) | 23090 | 22.55 MiB |
| Mebibyte (MiB) | Bytes (Binary) | 0.2048 | 209.72 KiB |
| Gibibyte (GiB) | Bytes (Binary) | 40 | 40 GiB |
| Bit | Bytes (Decimal) | 5 | 5 b |
| Byte | Bytes (Decimal) | 0.2 | 1.6 b |
| Kilobyte (KB) | Bytes (Decimal) | 20 | 20 KB |
| Megabyte (MB) | Bytes (Decimal) | 500 | 500 MB |
| Gigabyte (GB) | Bytes (Decimal) | 50 | 50 GB |
| Nanocores (ncores) | CPU | 1 | 1 ncores |
| Microcores (μcores) | CPU | 1000 | 1 mcores |
| Millicores (mcores) | CPU | 0.5 | 500 μcores |
| Cores | CPU | 10 | 10 cores |
| Kilocores (Kcores) | CPU | 3000 | 3 Mcores |
| Megacores (Mcores) | CPU | 0.6 | 600 Kcores |
| Gigacores (Gcores) | CPU | 50 | 50 Gcores |
| Nanoseconds | Time | 1000000000 | 1 s |
| Microseconds | Time | 10 | 10 μs |
| Milliseconds | Time | 0.000001 | 1 ns |
| Seconds | Time | 60 | 1 min |
| Minutes | Time | 120 | 2 hr |
| Hours | Time | 0.5 | 30 min |
| Days | Time | 30 | 30 days |
| Percentage | Percentage | 50.23432 | 50.23 % |
| Dollars | Money | 100.23409234 | $100.23409 |
| Hertz | Frequency | 20 | 20 Hz |
| Kilo Hertz | Frequency | 1234 | 1.23 MHz |
| Mega Hertz | Frequency | 340 | 340 MHz |
| Giga Hertz | Frequency | 34 | 34 GHz |
| Date Format | General | 1751354083000 | 2025-07-01 07:14:43 |
| Time Ago | General | Timestamp 10 minutes ago | 10 minutes ago |
| Ago | General | Timestamp 1 year ago | 1 year ago |
| Bytes Rate | General | 100 | 100 B/s |
| Count | General | 3420 | 3.42 K |
| Age | General | Timestamp 1 year ago | 1 year ago |
| Seconds | General | 40 | 40 s |
| Percentage Rate | General | 50.23432 | 50.23 %/s |
| Cost | General | 50 | $50.00 |
| Bit Rate | General | 8 | 1 B/s |
| Time Utilization | General | 9360.244650086986 | 2 hrs 36 m 1 s |
| Count Rate | General | 3420 | 3.42 K/s |
| Rate | General | 3420 | 3.42 K |
| Nanosecond | General | 3000000000 | 3.0 s |
| Milliseconds | General | 3452 | 3.45 s |
Date Format, Time Ago, Ago, and Age take a Unix timestamp in milliseconds. Date Format displays the time in your browser's local timezone; the example above is shown in UTC. Time Ago, Ago, and Age are calculated relative to the current time.
What did you think of this content?