AWS Lambda
Middleware instruments AWS Lambda functions to collect application telemetry and help investigate function execution, errors, and requests across serverless services. Available signals and export configuration depend on the runtime and instrumentation method described below.
Middleware supports AWS Lambda instrumentation for Node.js, Python, Java, Go, and .NET.
How it works#
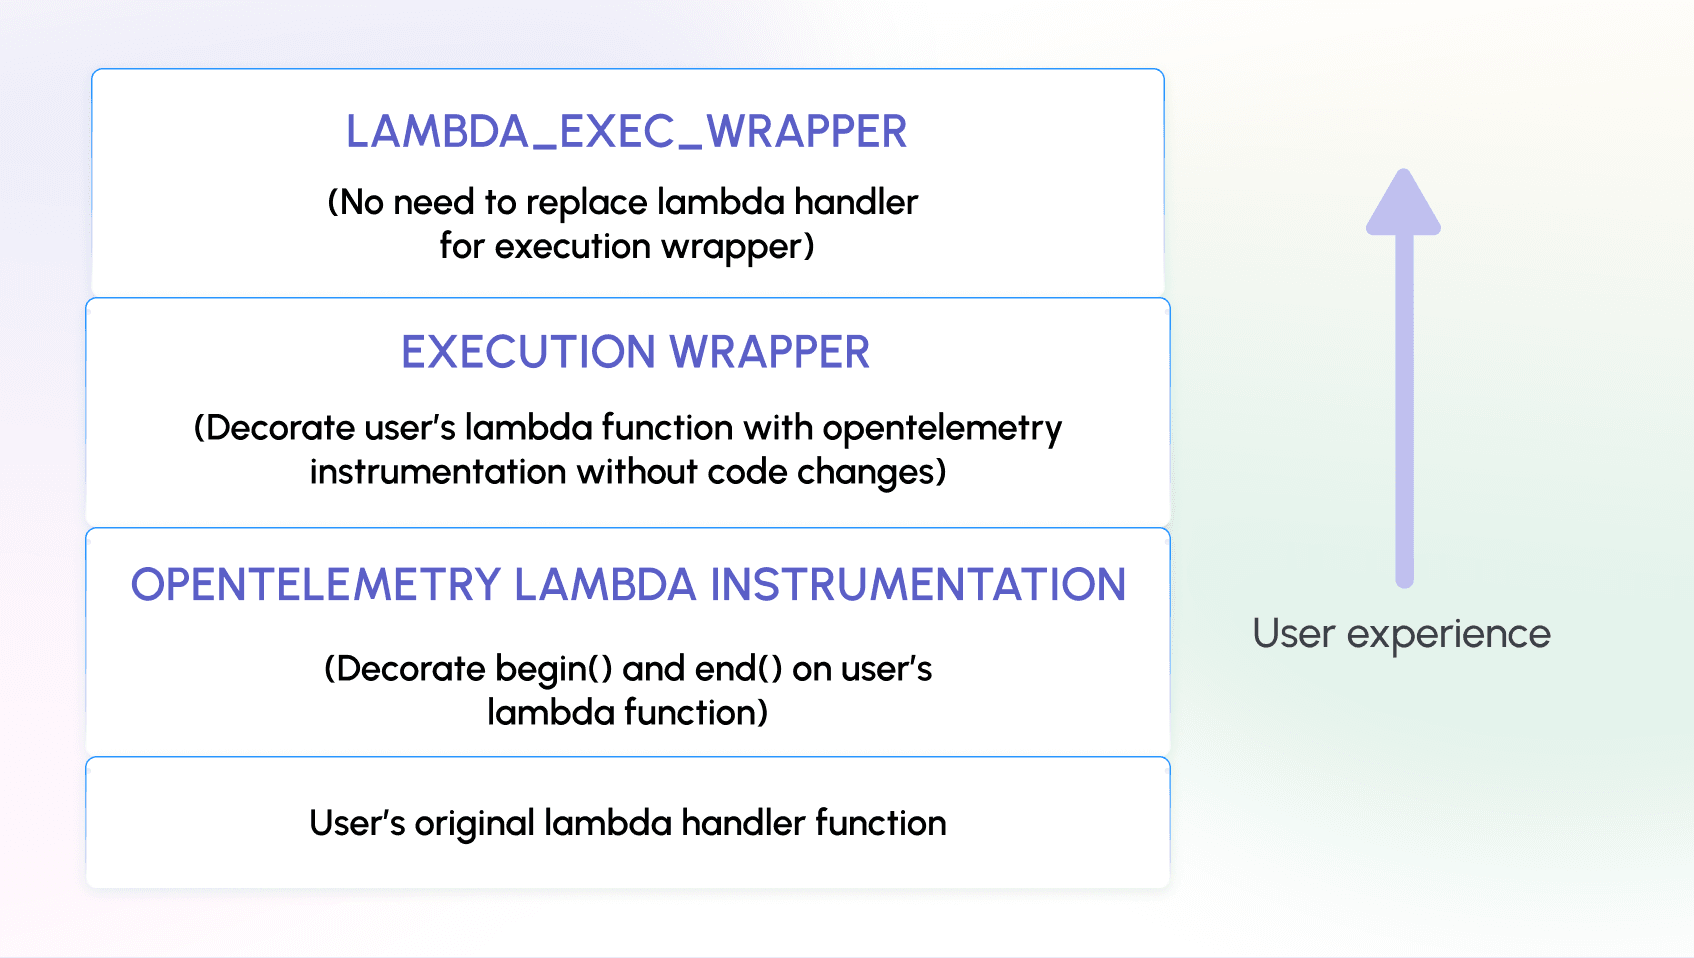
Middleware uses OpenTelemetry to collect telemetry from AWS Lambda functions.
Depending on the runtime, instrumentation works through:
- OpenTelemetry Lambda layers: Automatically instrument Node.js, Python, and Java functions using runtime-specific layers and, where required, an OpenTelemetry Collector extension.
- OpenTelemetry SDK: Instrument Go Lambda handlers and export traces directly to Middleware.
- Middleware APM SDK: Configure .NET applications to send telemetry to Middleware.
Lambda execution environments can freeze after an invocation. Configure telemetry flushing to ensure spans are exported before the function stops processing.
Supported telemetry#
| Traces | Metrics | App Logs | Custom Logs | Profiling |
|---|---|---|---|---|
| ✅ | ✅ | ✅ | ✅ | ✖ |
Telemetry availability depends on the runtime and the instrumentation configuration.
Prerequisites#
Before instrumenting AWS Lambda, verify the following:
- An AWS account with an existing Lambda function.
- Permissions to update Lambda layers, environment variables, and function code.
- A Middleware account with an API key and target URL.
- Outbound HTTPS access from the Lambda function to your Middleware endpoint on port 443.
- The appropriate OpenTelemetry Lambda layer for your runtime, AWS Region, and processor architecture, where applicable.
Optional: Enable AWS X-Ray Active Tracing if you need X-Ray integration and compatible trace context propagation.
Select your runtime#
| Runtime | Installation method |
|---|---|
| Node.js | OpenTelemetry Collector and auto-instrumentation layers |
| Python | OpenTelemetry Collector and auto-instrumentation layers |
| Java | OpenTelemetry Java instrumentation layer |
| Go | OpenTelemetry Go SDK and Lambda handler wrapper |
| .NET | Middleware APM SDK |
Note: OpenTelemetry Lambda layer ARNs are Region- and architecture-specific. Use the appropriate published version from the OpenTelemetry Lambda releases rather than relying on an older example ARN.
Installation#
Use OpenTelemetry Lambda layers to automatically instrument your Node.js function and send traces to Middleware.
1 Get the OpenTelemetry layer ARNs#
Open the OpenTelemetry Lambda repository.
Find the compatible versions of:
- OpenTelemetry Collector Lambda layer
- OpenTelemetry Node.js auto-instrumentation layer
Select the layer ARNs for your AWS Region, runtime, and architecture.
2 Add the layers to your Lambda function#
- Open AWS Console → Lambda → Functions.
- Select the function you want to instrument.
- Scroll to Layers.
- Click Add a layer → Specify an ARN.
- Add the Collector layer.
- Add the Node.js auto-instrumentation layer
Add the layers in the order specified above.
3 Configure environment variables#
Go to Configuration → Environment variables → Edit.
Add the following:
AWS_LAMBDA_EXEC_WRAPPER=/opt/otel-handler
NODE_OPTIONS=--require ./lambda-config.js
OTEL_SERVICE_NAME=your-service-name
OTEL_EXPORTER_OTLP_ENDPOINT=https://<MW_UID>.middleware.io:443
OTEL_RESOURCE_ATTRIBUTES=mw.account_key=<MW_API_KEY>
OTEL_LAMBDA_DISABLE_AWS_CONTEXT_PROPAGATION=true
OTEL_PROPAGATORS=tracecontext
Replace the placeholders with your Middleware account details and service name.
Note: For ESM-based Node.js applications, use the appropriate --import configuration instead of --require.
4 Configure trace exporting#
Create a file named lambda-config.js in your Lambda function's root directory.
const { SimpleSpanProcessor } = require("@opentelemetry/sdk-trace-base");
const {
  OTLPTraceExporter,
} = require("@opentelemetry/exporter-trace-otlp-proto");

global.configureTracerProvider = (tracerProvider) => {
  const spanProcessor = new SimpleSpanProcessor(new OTLPTraceExporter());
  tracerProvider.addSpanProcessor(spanProcessor);
};
This configures the trace provider to export spans as they finish, reducing the risk of losing spans when Lambda freezes the execution environment.
Ensure the required OpenTelemetry dependencies are included in your application package.
5 Deploy and verify#
Deploy the updated Lambda function and invoke it.
Go to APM → Services in Middleware and verify that your configured service appears.
Add custom spans (optional)#
You can use the OpenTelemetry API to capture custom operations in your Lambda function.
const { trace } = require("@opentelemetry/api");

const tracer = trace.getTracer("lambda-handler", "1.0.0");

exports.handler = async (event) => {
  const span = tracer.startSpan("process-request");

  try {
    span.setAttribute("function.operation", "process-request");

    // Your application logic here

    return {
      statusCode: 200,
      body: JSON.stringify({ message: "Success" }),
    };
  } catch (error) {
    span.recordException(error);
    throw error;
  } finally {
    span.end();
  }
};
Use custom spans to capture application-specific operations that automatic instrumentation does not cover.
Use OpenTelemetry Lambda layers to collect traces and logs from Python functions.
1 Get the OpenTelemetry layer ARNs#
From the OpenTelemetry Lambda repository find the compatible:
- OpenTelemetry Collector Lambda layer
- OpenTelemetry Python auto-instrumentation layer
Select the correct ARNs for your AWS Region and architecture.
2 Create the Collector configuration#
Create a file named collector.yaml in your Lambda deployment package.
receivers:
  telemetryapi: {}
  otlp:
    protocols:
      grpc:
        endpoint: "localhost:9319"
      http:
        endpoint: "localhost:9320"

exporters:
  debug:
    verbosity: detailed
  otlp:
    endpoint: "https://<MW_UID>.middleware.io:443"
    headers:
      authorization: <MW_API_KEY>

processors:
  decouple: {}
  resource:
    attributes:
      - action: upsert
        key: service.name
        value: my-service-name

service:
  pipelines:
    traces:
      receivers:
        - telemetryapi
        - otlp
      processors:
        - resource
        - decouple
      exporters:
        - otlp

    logs:
      receivers:
        - telemetryapi
        - otlp
      processors:
        - resource
        - decouple
      exporters:
        - otlp
Replace the Middleware credentials and service name.
The Collector receives telemetry locally and exports it to Middleware.
Note: This configuration requires a Collector distribution that supports the telemetryapi receiver and decouple processor. Verify compatibility with the selected Collector Lambda layer.
3 Add the Lambda layers#
- Open AWS Console → Lambda → Functions.
- Select your Python Lambda function.
- Go to Layers → Add a layer.
- Add the Collector layer.
- Add the Python auto-instrumentation layer.
Use the appropriate ARNs for your deployment.
4 Configure environment variables#
Under Configuration → Environment variables, add:
AWS_LAMBDA_EXEC_WRAPPER=/opt/otel-instrument
OPENTELEMETRY_COLLECTOR_CONFIG_URI=/var/task/collector.yaml
OPENTELEMETRY_EXTENSION_LOG_LEVEL=info
OTEL_BSP_SCHEDULE_DELAY=500
OTEL_EXPORTER_OTLP_ENDPOINT=http://localhost:9320
OTEL_LAMBDA_DISABLE_AWS_CONTEXT_PROPAGATION=true
OTEL_PROPAGATORS=tracecontext
The application sends telemetry to the local Collector, which forwards it to Middleware.
5 Enable JSON logging#
To collect structured application logs:
- Open your Lambda function.
- Go to Configuration → Monitoring and operations tools.
- Click Edit.
- Set the log format to JSON.
- Save the configuration.
6 Configure application logging (optional)#
Use Python's logging module to emit application logs.
import json
import logging

def lambda_handler(event, context):
    logger1 = logging.getLogger("logger1")
    logger1.setLevel(logging.DEBUG)

    logger1.debug("This is a debug message from aws lambda")
    logger1.info("This is an info message from aws lambda")

    logger1.propagate = False

    logging.shutdown()

    return {
        "statusCode": 200,
        "body": json.dumps("Hello from Lambda!")
    }
Set logger1.propagate = False in this configuration to avoid duplicate log records.
Deploy the function and invoke it to generate telemetry.
Use the OpenTelemetry Java Lambda instrumentation layer to collect application traces.
1 Add the Java instrumentation layer#
- Open AWS Console → Lambda → Functions.
- Select your Java Lambda function.
- Go to Layers → Add a layer.
- Add the compatible OpenTelemetry Java instrumentation layer ARN for your AWS Region and runtime.
Find the current layer information in the OpenTelemetry Lambda repository.
2 Configure environment variables#
Add the following variables to your Lambda function:
AWS_LAMBDA_EXEC_WRAPPER=/opt/otel-handler
OTEL_EXPORTER_OTLP_ENDPOINT=https://<MW_UID>.middleware.io:443
OTEL_LAMBDA_DISABLE_AWS_CONTEXT_PROPAGATION=true
OTEL_PROPAGATORS=tracecontext
OTEL_RESOURCE_ATTRIBUTES=mw.account_key=<YOUR_MW_ACCOUNT_KEY>
OTEL_SERVICE_NAME=<JAVA_LAMBDA_SERVICE>
Replace the placeholders with your Middleware credentials and service name.
3 Add custom instrumentation (optional)#
Automatic instrumentation captures supported Lambda operations. To create custom spans, add the OpenTelemetry API dependency.
Gradle
dependencies {
    implementation 'io.opentelemetry:opentelemetry-api:1.28.0'
    implementation 'com.amazonaws:aws-lambda-java-core:1.2.1'
}
Maven
<dependencies>
    <dependency>
        <groupId>io.opentelemetry</groupId>
        <artifactId>opentelemetry-api</artifactId>
        <version>1.28.0</version>
    </dependency>
    <dependency>
        <groupId>com.amazonaws</groupId>
        <artifactId>aws-lambda-java-core</artifactId>
        <version>1.2.1</version>
    </dependency>
</dependencies>
Use dependency versions compatible with your Java runtime and OpenTelemetry instrumentation layer.
4 Deploy and verify#
Deploy the updated function and invoke it.
Go to APM → Services in Middleware to verify trace collection.
Instrument Go Lambda functions using the OpenTelemetry Go SDK and the official Lambda handler wrapper.
Unlike the layer-based methods, this setup exports traces directly to Middleware using OTLP/HTTP.
1 Install the required packages#
Add the OpenTelemetry and AWS Lambda packages to your Go project.
go get github.com/aws/aws-lambda-go/lambda
go get go.opentelemetry.io/contrib/instrumentation/github.com/aws/aws-lambda-go/otellambda
go get go.opentelemetry.io/otel
go get go.opentelemetry.io/otel/sdk
go get go.opentelemetry.io/otel/exporters/otlp/otlptrace/otlptracehttp
2 Configure the trace exporter#
Create a tracer provider that exports spans to Middleware.
func initTracerProvider(ctx context.Context) (*trace.TracerProvider, error) {
    exp, err := otlptracehttp.New(ctx,
        otlptracehttp.WithEndpointURL(
            "https://<MW_UID>.middleware.io:443/v1/traces",
        ),
    )
    if err != nil {
        return nil, err
    }

    res := resource.NewSchemaless(
        attribute.String("service.name", "go-lambda-service"),
        attribute.String("mw.account_key", "<YOUR_MW_ACCOUNT_KEY>"),
        attribute.String("library.language", "go"),
    )

    tp := trace.NewTracerProvider(
        trace.WithBatcher(exp),
        trace.WithResource(res),
    )

    otel.SetTracerProvider(tp)

    return tp, nil
}
The WithEndpointURL option requires the complete OTLP/HTTP traces URL, including /v1/traces.
3 Instrument the Lambda handler#
Add a custom span to your Lambda handler.
type MyEvent struct {
    Name string `json:"name"`
    Age  int    `json:"age"`
}

type MyResponse struct {
    Message string `json:"message"`
}

func HandleLambdaEvent(ctx context.Context, event *MyEvent) (*MyResponse, error) {
    tracer := otel.Tracer("lambda")
    _, span := tracer.Start(ctx, "HandleLambdaEvent")
    defer span.End()

    span.SetAttributes(
        attribute.String("user.name", event.Name),
        attribute.Int("user.age", event.Age),
    )

    return &MyResponse{Message: "ok"}, nil
}
4 Configure trace flushing#
Wrap the handler using otellambda.InstrumentHandler.
func main() {
    ctx := context.Background()

    tp, err := initTracerProvider(ctx)
    if err != nil {
        log.Fatalf("failed to init tracer provider: %v", err)
    }

    defer tp.Shutdown(ctx)

    lambda.Start(otellambda.InstrumentHandler(
        HandleLambdaEvent,
        otellambda.WithFlusher(tp),
    ))
}
WithFlusher helps export completed spans before the Lambda execution environment freezes.
Note: Include the required imports from the existing Go example and verify that the selected exporter supports your Middleware authentication configuration.
5 Deploy and verify#
Build and deploy your Go Lambda function.
Invoke the function and verify traces under APM → Services in Middleware.
Use the Middleware APM package to instrument supported .NET applications.
1 Verify the .NET version#
Ensure .NET 6 or later is installed in your development environment.
dotnet --version2 Install the Middleware APM package#
dotnet add package MW.APM3 Configure instrumentation#
Add the Middleware instrumentation configuration to your application startup.
For an ASP.NET Core application using the minimal hosting model:
var builder = WebApplication.CreateBuilder(args);

var configuration = new ConfigurationBuilder()
    .SetBasePath(Directory.GetCurrentDirectory())
    .AddJsonFile("appsettings.json", optional: false, reloadOnChange: true)
    .AddEnvironmentVariables()
    .Build();

builder.Services.ConfigureMWInstrumentation(configuration);

builder.Logging.AddConfiguration(configuration.GetSection("Logging"));
builder.Logging.AddConsole();
builder.Logging.SetMinimumLevel(LogLevel.Debug);

var app = builder.Build();

Logger.Init(app.Services.GetRequiredService<ILoggerFactory>());

app.Run();
4 Configure Middleware credentials#
Add the following configuration to appsettings.json:
{
  "MW": {
    "ApiKey": "<YOUR_MW_ACCOUNT_KEY>",
    "TargetURL": "<MW_UID>.middleware.io:443",
    "ServiceName": "<SERVICE_NAME>"
  },
  "Logging": {
    "LogLevel": {
      "Default": "Information",
      "Microsoft.AspNetCore": "Warning"
    }
  }
}
Replace the placeholders with your Middleware account details.
Note: The startup example above is for ASP.NET Core. A Lambda project using a different hosting model may require a different initialization method.
5 Deploy and verify#
Deploy the updated application to AWS Lambda.
Invoke the function and check APM → Services in Middleware for the configured service.
Collect Lambda logs without code changes#
Collect logs from your AWS Lambda functions without changing your function code. The OpenTelemetry Collector Lambda layer runs as a Lambda extension. It subscribes to the Lambda Telemetry API to receive everything your function writes to stdout and stderr, plus platform logs, and exports them to Middleware over OTLP.
Lambda function ──(stdout/stderr)──► Telemetry API ──► OTel Collector extension ──(OTLP)──► MiddlewareThis method works for any runtime. If you already use the Collector layer for traces, add the telemetryapi receiver and logs pipeline below to your existing collector.yaml.
1 Add the OpenTelemetry Collector layer#
Go to the opentelemetry-lambda releases page and copy the latest Collector layer ARN. The layers are published per region by AWS account 184161586896:
arn:aws:lambda:<aws-region>:184161586896:layer:opentelemetry-collector-<amd64|arm64>-<version>:<layer-version>- Replace
<aws-region>with your function's region. - Replace
<amd64|arm64>with your function's architecture. - Replace
<version>and<layer-version>with the values from the release.
In the AWS Console, go to Lambda → Functions → your function → Layers → Add a layer, choose Specify an ARN, paste the ARN, and click Add.
2 Create the collector configuration#
Create a file named collector.yaml in the root of your function's deployment package:
receivers:
  telemetryapi:

processors:
  batch:
  decouple:
  resource:
    attributes:
      - key: mw.account_key
        value: <MW_API_KEY>
        action: upsert
      - key: service.name
        value: "my-lambda-function"
        action: upsert
      - key: deployment.environment
        value: "production"
        action: upsert

exporters:
  otlp:
    endpoint: https://<MW_UID>.middleware.io:443
    headers:
      authorization: <MW_API_KEY>

service:
  pipelines:
    logs:
      receivers: [telemetryapi]
      processors: [resource, batch, decouple]
      exporters: [otlp]
Replace:
<uid>with your Middleware project UID.<MW_API_KEY>with your Middleware API key.my-lambda-functionandproductionwith your service name and environment.
Keep the service.name attribute. Middleware rejects logs that do not identify a resource (such as service.name or host.id).
The decouple processor must be the last processor in the pipeline. It lets the function return without waiting for the export to finish.
Store your API key in AWS Secrets Manager or an encrypted environment variable instead of in plain text. The collector can read environment variables with ${env:MW_API_KEY}.
3 Point the layer to the configuration#
Go to Configuration → Environment variables and add:
OPENTELEMETRY_COLLECTOR_CONFIG_URI=/var/task/collector.yaml/var/task is the root of your deployment package.
4 Deploy and invoke the function#
Deploy the function with collector.yaml included, then invoke it. Logs appear in the Logs section of your Middleware account.
Limitations#
- Logs are delayed. The
decoupleprocessor sends buffered logs at the start of the next invocation, or when the execution environment shuts down. A function that is invoked rarely may need a second invocation before its logs appear. - Remote configuration adds cold-start latency.
OPENTELEMETRY_COLLECTOR_CONFIG_URIalso supportss3://andhttps://URIs, but loading the file from your deployment package is faster.
Verify Installation#
After instrumenting your Lambda function, invoke it to generate telemetry.
1 Invoke the function#
Use the AWS Lambda console to create and run a test event.
Alternatively, invoke the function using the AWS CLI:
aws lambda invoke \
  --function-name <FUNCTION_NAME> \
  --payload '{}' \
  --cli-binary-format raw-in-base64-out \
  response.json
2 Verify traces#
- Log in to Middleware.
- Go to APM → Services.
- Find the service name configured using
OTEL_SERVICE_NAMEor the Middleware SDK configuration. - Open the service to view its traces, errors, and latency.
3 Verify logs#
Go to Log Monitoring
If logs do not appear, verify that logging is enabled and that the configured Collector or SDK exports logs to Middleware.
AWS X-Ray tracing (optional)#
AWS X-Ray provides additional tracing context for Lambda functions and their AWS service dependencies.
To enable Active Tracing:
- Open AWS Console → Lambda → Functions.
- Select your Lambda function.
- Go to Configuration → Monitoring and operations tools.
- Under AWS X-Ray, enable Active tracing.
- Save the changes.
For W3C trace context propagation, use:
OTEL_PROPAGATORS=tracecontextIf you need AWS X-Ray interoperability, configure compatible propagators rather than disabling AWS context propagation.
Environment variables reference#
| Variable | Description |
|---|---|
AWS_LAMBDA_EXEC_WRAPPER | Starts runtime auto-instrumentation before the Lambda handler |
OTEL_SERVICE_NAME | Service name displayed in Middleware |
OTEL_RESOURCE_ATTRIBUTES | Resource metadata, including Middleware account identification |
OTEL_PROPAGATORS | Trace context propagation format |
OTEL_LAMBDA_DISABLE_AWS_CONTEXT_PROPAGATION | Controls AWS-specific context propagation |
OTEL_EXPORTER_OTLP_ENDPOINT | Base endpoint for OTLP export |
OTEL_EXPORTER_OTLP_TRACES_ENDPOINT | Signal-specific endpoint for traces |
OTEL_BSP_SCHEDULE_DELAY | Span batch processor delay in milliseconds |
NODE_OPTIONS | Loads the Node.js instrumentation configuration |
OPENTELEMETRY_COLLECTOR_CONFIG_URI | Path to the Collector configuration file |
OPENTELEMETRY_EXTENSION_LOG_LEVEL | Logging level for the Collector extension |
OTEL_LOGS_EXPORTER | Configures the OpenTelemetry logs exporter |
OTEL_PYTHON_LOGGING_AUTO_INSTRUMENTATION_ENABLED | Enables Python logging instrumentation |
Troubleshooting#
No traces in Middleware#
If traces do not appear after invoking your Lambda function:
- Verify that the correct instrumentation layer is attached for your runtime, Region, and architecture.
- Confirm that the required environment variables are configured.
- Check that your Middleware target URL and account key are correct.
- Verify that the Lambda function can reach Middleware over HTTPS.
- Review the function's CloudWatch Logs for instrumentation or exporter errors.
Traces are missing or delayed#
Lambda functions can freeze before buffered spans are exported.
- Reduce the batch span processor delay, for example
OTEL_BSP_SCHEDULE_DELAY=500. - For Go, use
otellambda.WithFlusher(tp)to flush spans after invocations. - Verify that the function timeout allows sufficient time for telemetry export.
Collector layer is not exporting data#
If you use the Collector Lambda layer:
- Verify that
collector.yamlis included in the deployment package. - Confirm that
OPENTELEMETRY_COLLECTOR_CONFIG_URIpoints to the correct file. - Check the Collector exporter configuration and Middleware credentials.
- Review CloudWatch Logs for Collector startup or export errors.
Node.js instrumentation is not loading#
If the Node.js wrapper starts but the bootstrap file does not load:
- Verify that
lambda-config.jsis included in the deployment package. - Check the
NODE_OPTIONSpath. - For ESM applications, use a compatible
--importconfiguration rather than CommonJS--require.
Python logs are missing#
If traces appear but Python application logs are missing:
- Enable OpenTelemetry Python logging instrumentation.
- Set
OTEL_LOGS_EXPORTER=otlpwhen required. - Verify that the Collector has a logs pipeline.
- Check for duplicate log propagation if logs appear more than once.
Lambda logs are missing#
If you use the Collector layer with the Telemetry API to collect logs:
- Check that
OPENTELEMETRY_COLLECTOR_CONFIG_URIis set and thatcollector.yamlis at the root of the deployment package. - Keep the
service.nameresource attribute. Middleware rejects logs that do not identify a resource. - Make sure the layer ARN matches your function's region and architecture (
amd64orarm64). - Check the function's CloudWatch Logs for errors from the
collectorextension. - Invoke the function again. Buffered logs are sent at the start of the next invocation.
Deprecation warning for the otlp exporter#
Collector layers built on collector v0.145.0 or later name the gRPC exporter otlp_grpc. otlp still works as a deprecated alias. To remove the warning, rename the exporter to otlp_grpc in exporters and in the pipeline.
Go traces are not exported#
If Go instrumentation is enabled but traces do not appear:
- Verify that the OTLP/HTTP traces endpoint includes
/v1/traces. - Check that the exporter sends the required Middleware account information.
- Confirm that the Lambda handler uses
otellambda.InstrumentHandler. - Verify that spans are flushed before the invocation ends.
Lambda function cannot connect to Middleware#
If the function runs inside a VPC:
- Verify that its subnet routing provides outbound access.
- Configure a NAT Gateway or another appropriate egress path if required.
- Confirm that security groups and network ACLs allow outbound HTTPS traffic.
Traces are not connected across services#
If traces appear separately instead of forming a distributed trace:
- Use a consistent propagation format across services.
- Verify that upstream services forward the required tracing headers.
- Check AWS X-Ray and W3C propagation settings for compatibility.
If the issue persists, contact Middleware Support at support@middleware.io.
Need assistance or want to learn more about Middleware? Get in touch with us via our Contact Us or join our Slack channel.
What did you think of this content?