Metrics
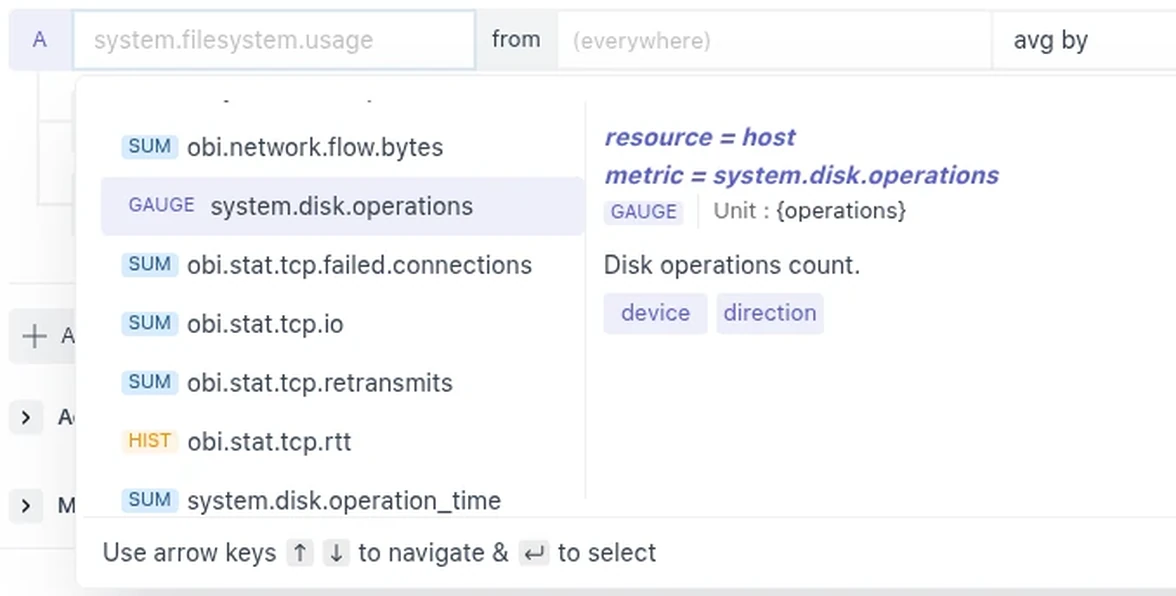
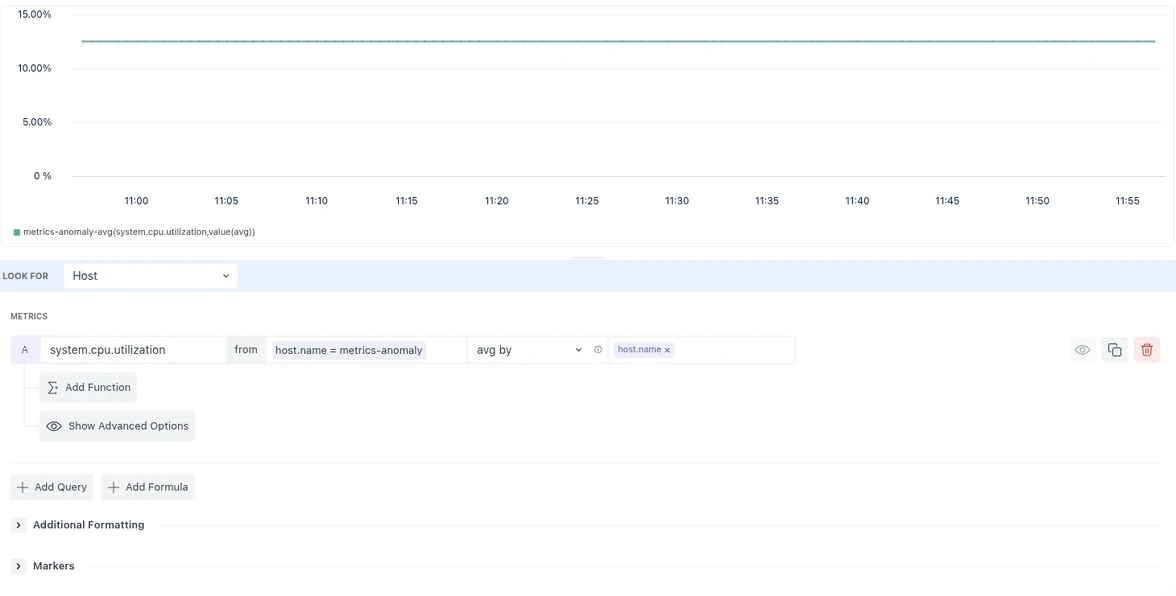
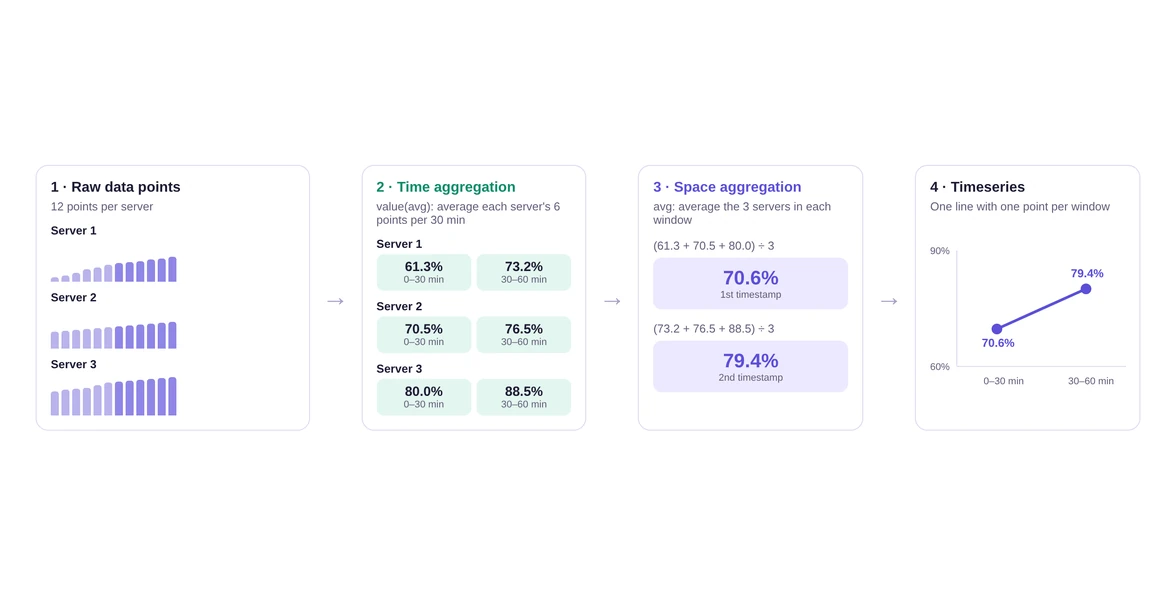
Metrics are the numbers behind every dashboard widget and alert: CPU and memory from your hosts, request rates and latencies from your services, and anything your integrations or custom instrumentation report. Middleware stores them in the OpenTelemetry model, so each metric has a type, such as gauge, sum or histogram, that decides how it can be queried. These pages explain the metric types, how to query them with the visual query builder, and exactly how raw data points are combined into the lines and numbers you see.
Features
Related Features


What did you think of this content?