LLM monitoring
Middleware LLM Observability connects model and agent activity with traces, performance metrics, evaluation results, and cost data. It helps you investigate how an AI application produced a response and whether that response met your quality criteria.
Use it to trace LLM calls, agents, and tool invocations; monitor latency, token usage, and cost; evaluate response quality; and monitor the GPU infrastructure running your AI workloads.
The typical workflow is:
Instrument → Trace → Evaluate → Monitor → Improve
Instrument your application once, then use LLM monitoring to investigate individual requests, evaluations to measure response quality, and metrics and dashboards to monitor behavior over time.
How LLM Observability Works#
Middleware adds LLM-specific observability signals alongside your existing application and infrastructure telemetry.
Once your application is instrumented, you can use:
- Traces to understand how an LLM request, agent, or tool execution behaved.
- Evaluations to measure the quality of generated responses.
- Metrics to track latency, token usage, and cost.
- Dashboards to monitor LLM behavior and trends.
- GPU Monitoring to monitor the infrastructure running GPU workloads.
This lets you correlate model behavior, response quality, cost, and infrastructure performance from the same platform.
Traces#
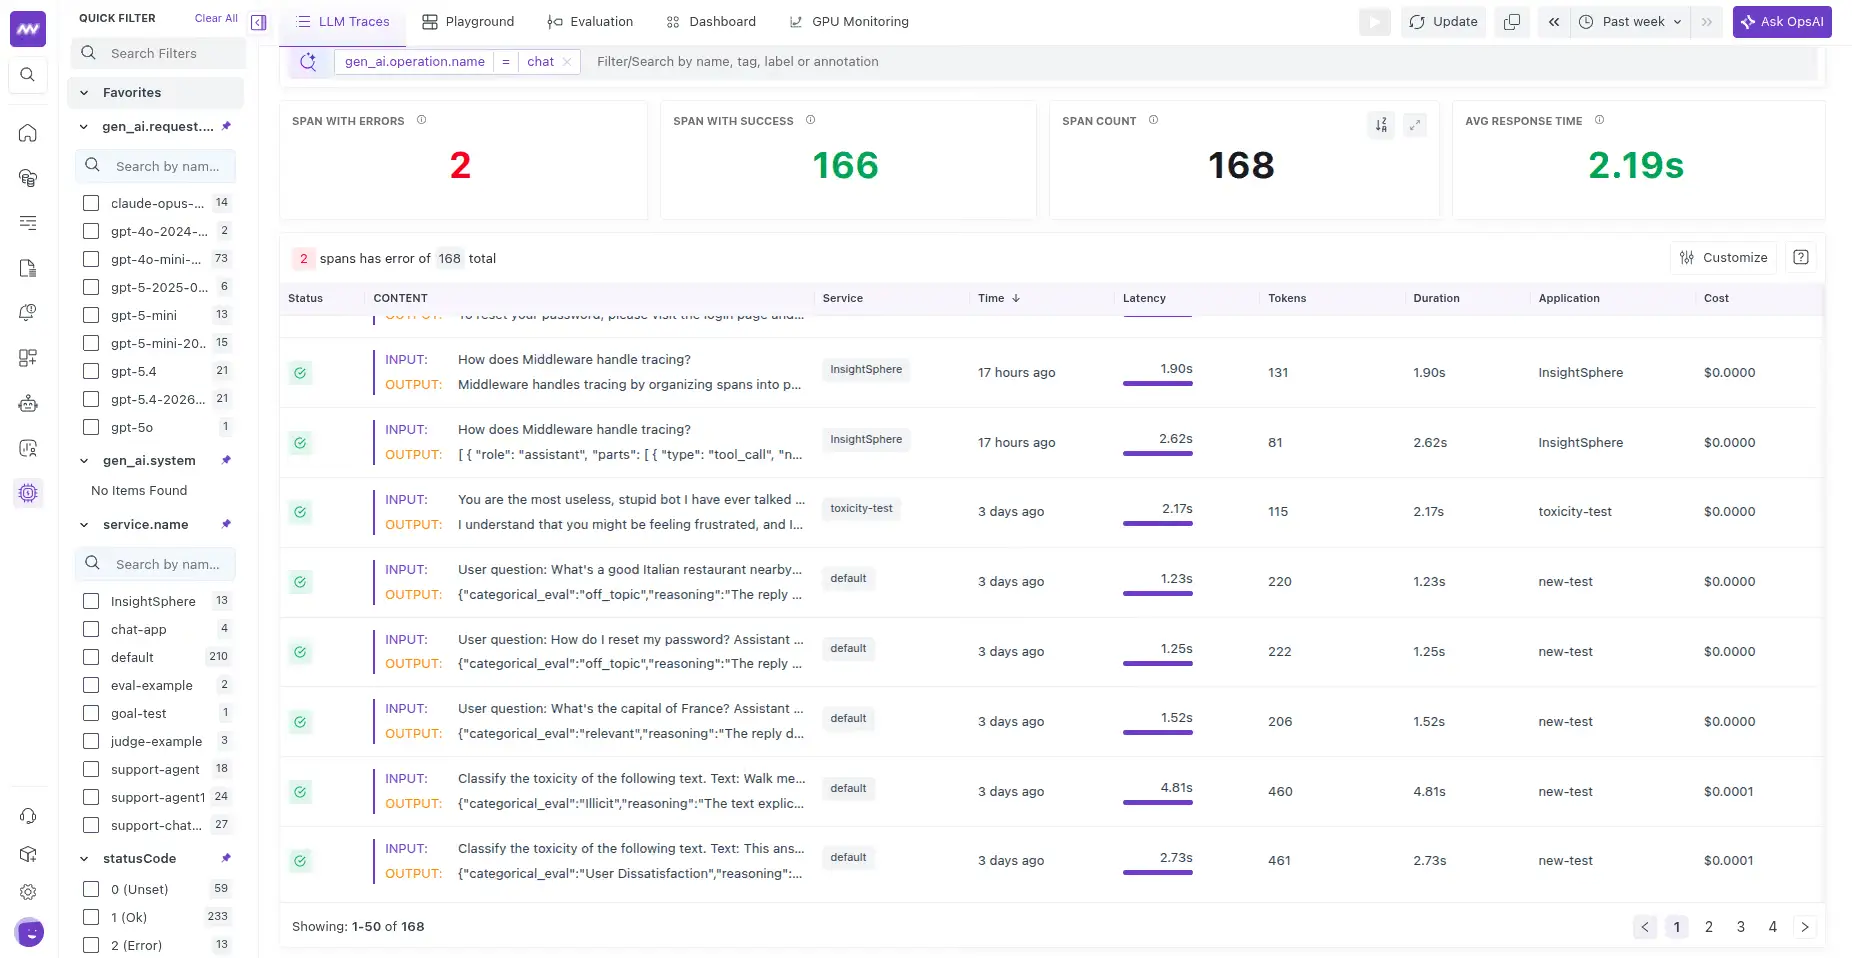
Traces provide end-to-end visibility into LLM requests and the operations involved in producing a response.
Depending on your application, a trace can include:
- LLM calls
- Agent steps
- Tool invocations
- RAG operations
- Other instrumented operations in the request path
Use traces to understand the sequence of operations, identify where time was spent, and inspect what happened at each step.
For example:
User Request ↓ Agent ↓ Retrieve Context ↓ LLM Call ↓ Tool Call ↓ LLM Response
When a dashboard indicates increased latency, token usage, or another unexpected change, open the relevant trace to investigate the individual spans responsible for it.
Evaluations#
Evaluations turn LLM response quality into measurable signals that can be monitored alongside traces.
You can evaluate responses using criteria such as:
- Correctness
- Groundedness
- Toxicity
- Tool usage
- Goal completion
- Custom evaluation criteria
Evaluation results are associated with the span that produced the response, allowing you to inspect model behavior and quality together.
Middleware supports two evaluation approaches:
- Server-side evaluations: Configure evaluations from the Middleware UI and run them against live traffic.
- Client-side evaluations: Run evaluations in your application and submit the results from your code.
Evaluations assess the quality of an output, while performance metrics describe how the request ran. A request can complete successfully and still produce an irrelevant or incorrect response.
Metrics#
Middleware captures LLM-specific metrics from your instrumented traces.
These include signals such as:
- Latency
- Token usage
- Cost
Use these metrics to monitor changes over time and identify increases in response latency, token consumption, or model cost.
You can then open the associated traces when you need request-level context for a change in a metric.
Dashboards#
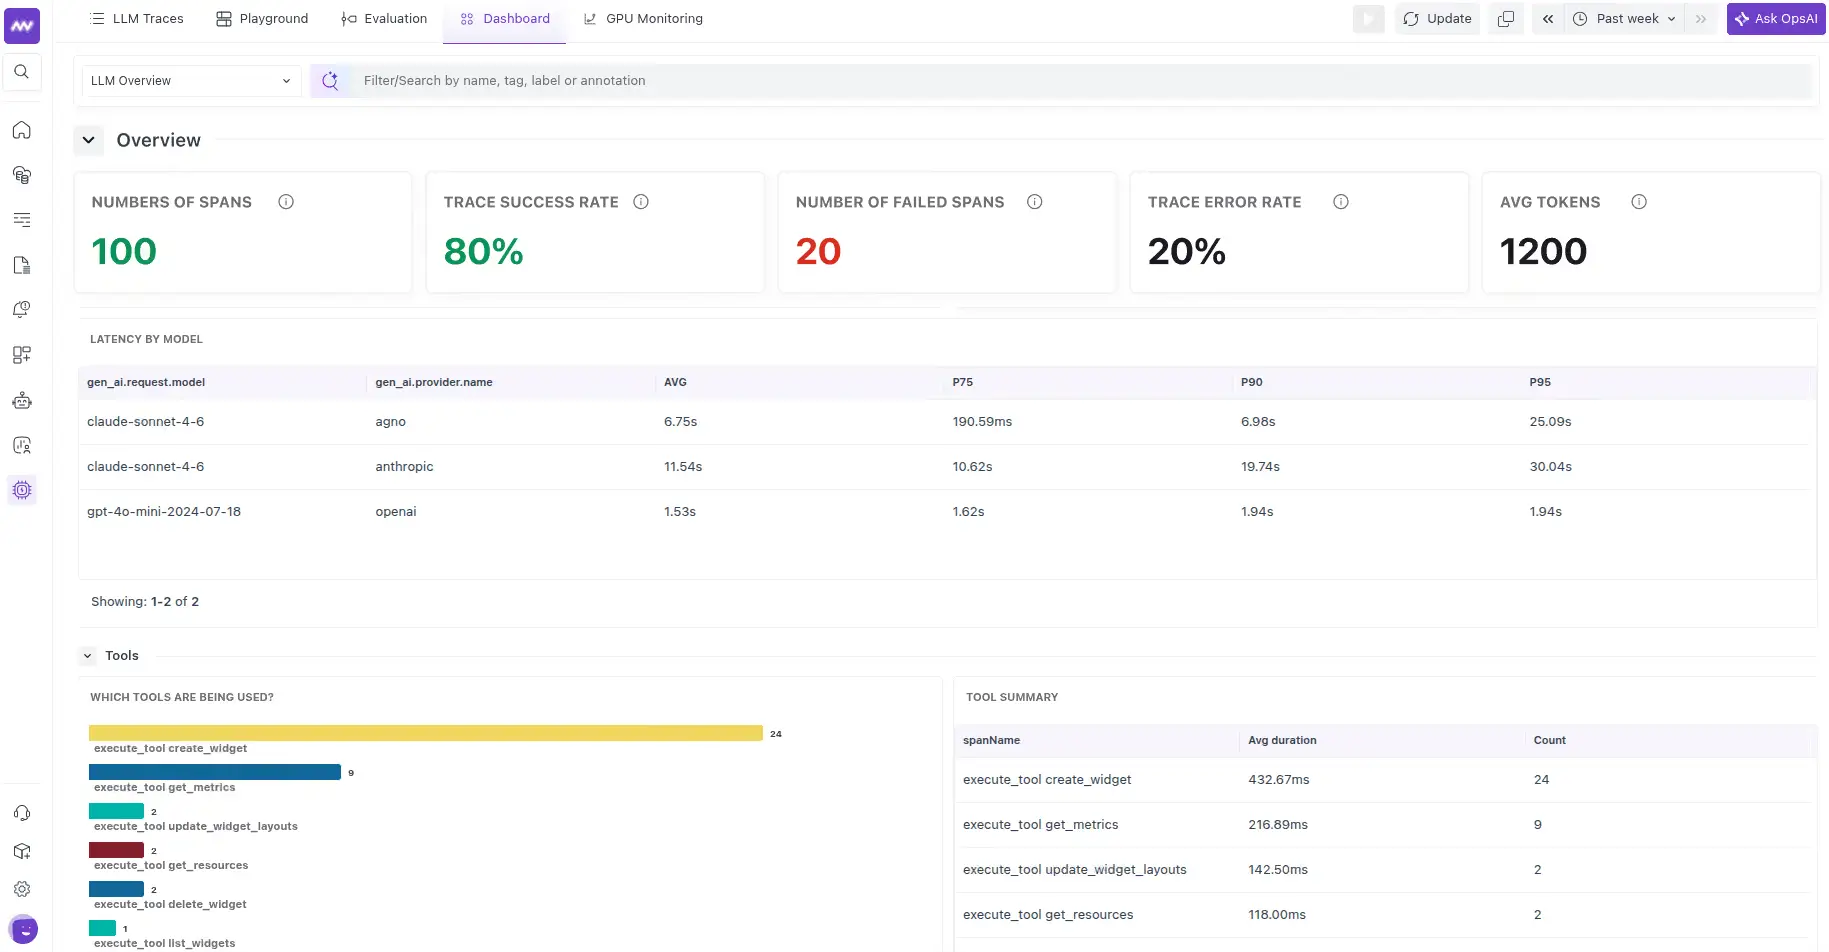
LLM Observability dashboards provide an aggregated view of your application's LLM activity.
Use dashboards to monitor overall behavior and identify changes that need further investigation.
GPU Monitoring#
For applications running on GPU infrastructure, GPU Monitoring provides visibility into NVIDIA GPU health and utilization.
You can monitor signals such as:
- GPU utilization
- Memory usage
- Power usage
- Temperature
- Errors
- Per-process usage
Middleware collects these metrics using a lightweight DCGM/NVML collector.
Use GPU Monitoring alongside LLM traces and metrics to determine whether application-level performance changes correspond with GPU resource behavior.
Instrument Your Application#
Middleware supports multiple OpenTelemetry-compatible instrumentation options.
Regardless of the SDK used, collected traces, evaluations, and metrics are available through the same LLM Observability experience.
Middleware SDK#
The Middleware SDK is the first-party option for Python applications.
It uses OpenInference instrumentation internally and supports automatic instrumentation of LLM providers and agent frameworks.
For example, automatic instrumentation can be enabled using:
register(auto_instrument=True)
The Middleware SDK also includes evaluation support in the same package.
Use the Middleware SDK for Python applications when you want Middleware's first-party LLM instrumentation.
Traceloop#
Traceloop can be used to instrument applications written in:
- Python
- Node.js
- Next.js
- Go
- Ruby
Traceloop supports the application environments described in the linked instrumentation guides and can be used when your application already uses Traceloop instrumentation.
OpenLIT#
OpenLIT supports:
- Python
- TypeScript
Use OpenLIT for TypeScript applications or when OpenLIT is already part of your observability setup.
Refer to the individual instrumentation guides for SDK installation, supported providers, frameworks, and configuration.
Read details doc about openlit instrumentation.
Get Started#
A typical LLM Observability setup follows these steps:
- Choose an instrumentation option and configure it in your application.
- Generate traffic by running an LLM call, agent, or RAG workflow.
- Open LLM Observability and verify that traces are being received.
- Inspect a trace to review LLM calls, agent steps, tools, and token usage.
- Add server-side or client-side evaluations to measure response quality.
- Monitor latency, tokens, cost, and evaluation results using metrics and dashboards.
- Configure GPU Monitoring when the application runs on supported GPU infrastructure.
For Python applications using the Middleware SDK, install the package with:
pip install middleware-llmobs
Then initialize the SDK before your application's LLM operations.
Refer to the Middleware SDK documentation and cookbooks for complete configuration examples for LLM applications, agents, RAG, sessions, and evaluations.
Investigate an LLM Issue#
A typical investigation can follow this workflow:
- Open the LLM Observability dashboard and identify a change in latency, token usage, cost, or another monitored signal.
- Open a relevant trace from the affected time range.
- Review the request path and individual spans.
- Identify the LLM call, agent step, tool, or dependency contributing to the issue.
- Review evaluation results to determine whether response quality was also affected.
- Compare token usage and cost with expected behavior.
- For GPU-hosted workloads, review GPU metrics to check whether infrastructure behavior corresponds with the application-level issue.
- Use the combined trace, evaluation, metric, and infrastructure context to narrow down the cause.
Troubleshooting#
No LLM data appears#
Verify that:
- The SDK is initialized before any LLM calls are made.
- The correct Middleware endpoint is configured.
- The
Authorizationheader is configured correctly. - The application can reach Middleware.
When using the Middleware SDK, also verify that the following header is configured:
X-Trace-Source=openinferenceAgent or tool spans are missing#
When using auto-instrumentation, verify that the required OpenInference instrumentation package is installed for each LLM provider or framework used by your application.
Missing instrumentation packages can result in partial traces where some agent or tool operations are not captured.
Spans are missing from short-running scripts#
Short-lived applications can exit before buffered spans are exported.
Flush the tracer before the process exits:
providers.tracer.force_flush()Long-running servers can rely on the batch processor to export spans during application execution.
Evaluations are not appearing#
For server-side evaluations, verify that the evaluator is published and configured for the correct spans.
For client-side evaluations, verify that the evaluation result is submitted while the relevant span is active.
Need assistance or want to learn more about Middleware? Get in touch with us via our Contact Us or join our Slack channel.
What did you think of this content?