August 12, 2026
Middleware 2.8.0 adds grouped OpsAI issues, investigation plans, SAP HANA monitoring, and a Log Tree view. The release also updates APM trace inspection, log details, and integration controls.
Grouped Issues in OpsAI#
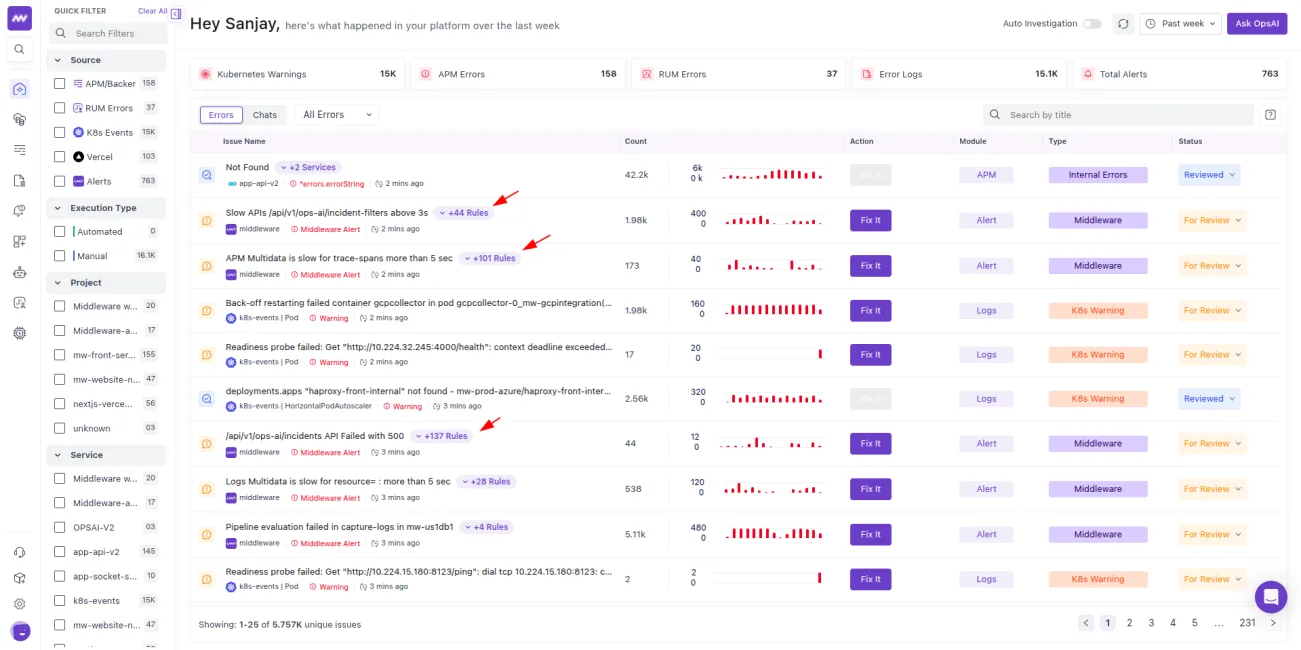
OpsAI now groups similar Kubernetes, APM, and alert issues. Expand a group to review occurrences across services, applications, hosts, or clusters and investigate individual issues.
OpsAI Investigation Plans and Hypotheses#
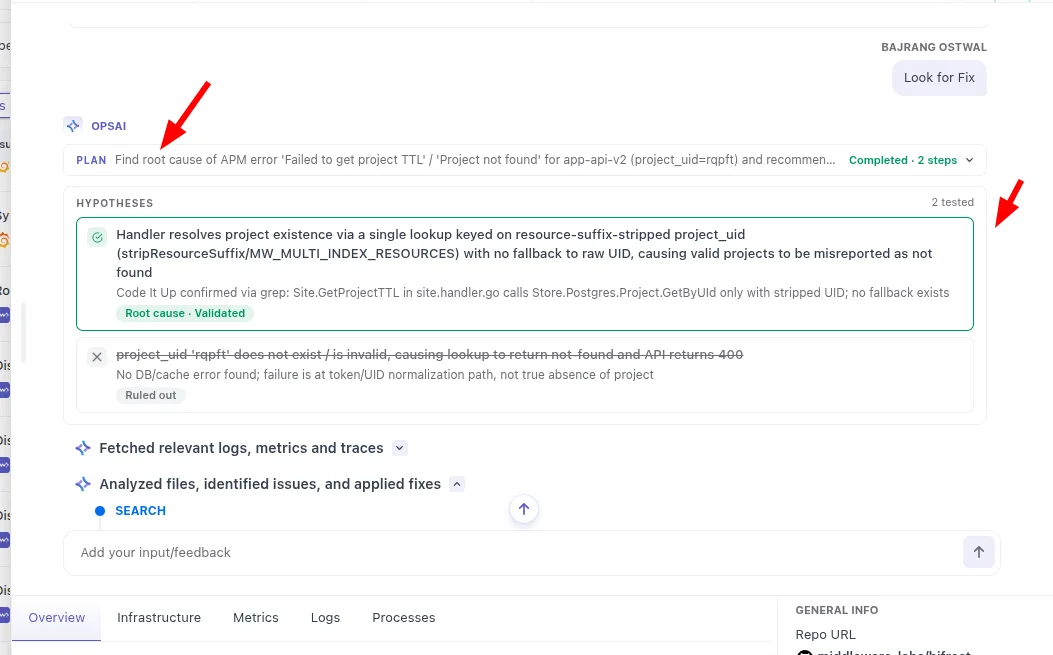
Follow OpsAI investigations through a live checklist and hypothesis board.
- Investigation plan: Review the goal, steps, and progress.
- Hypothesis board: Track potential causes as Testing, Validated, Ruled Out, or Inconclusive, with the validated root cause highlighted.
APM Trace and Span Inspection#
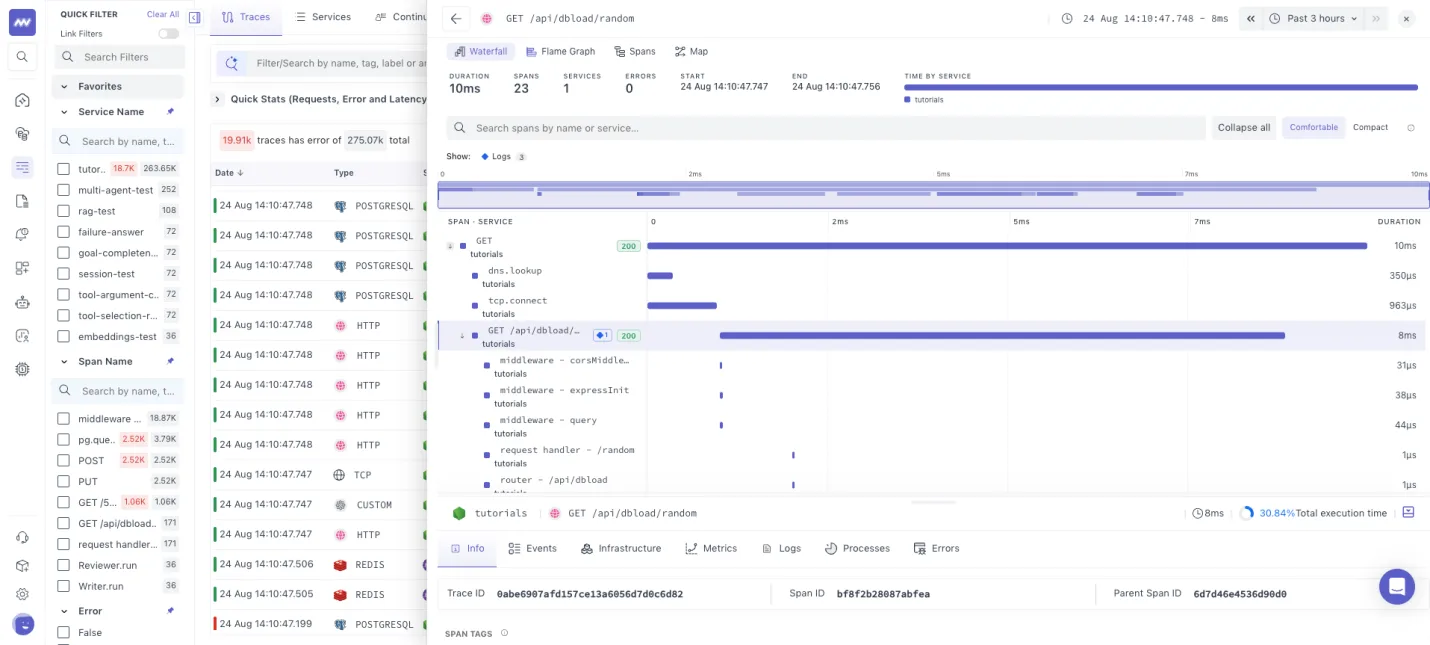
The APM trace list and detail panel now include waterfall and flame graphs, plus error and event counts, for inspecting long requests.
- Span zoom: Zoom into individual spans.
- Span search: Find spans by name.
- Large traces: Load additional spans when inspecting large traces.
SAP HANA Monitoring#
Monitor SAP HANA on Linux hosts and Kubernetes clusters, including multiple instances on the same host or cluster. Collect metrics from each instance.
Log Tree for Pattern Analysis#
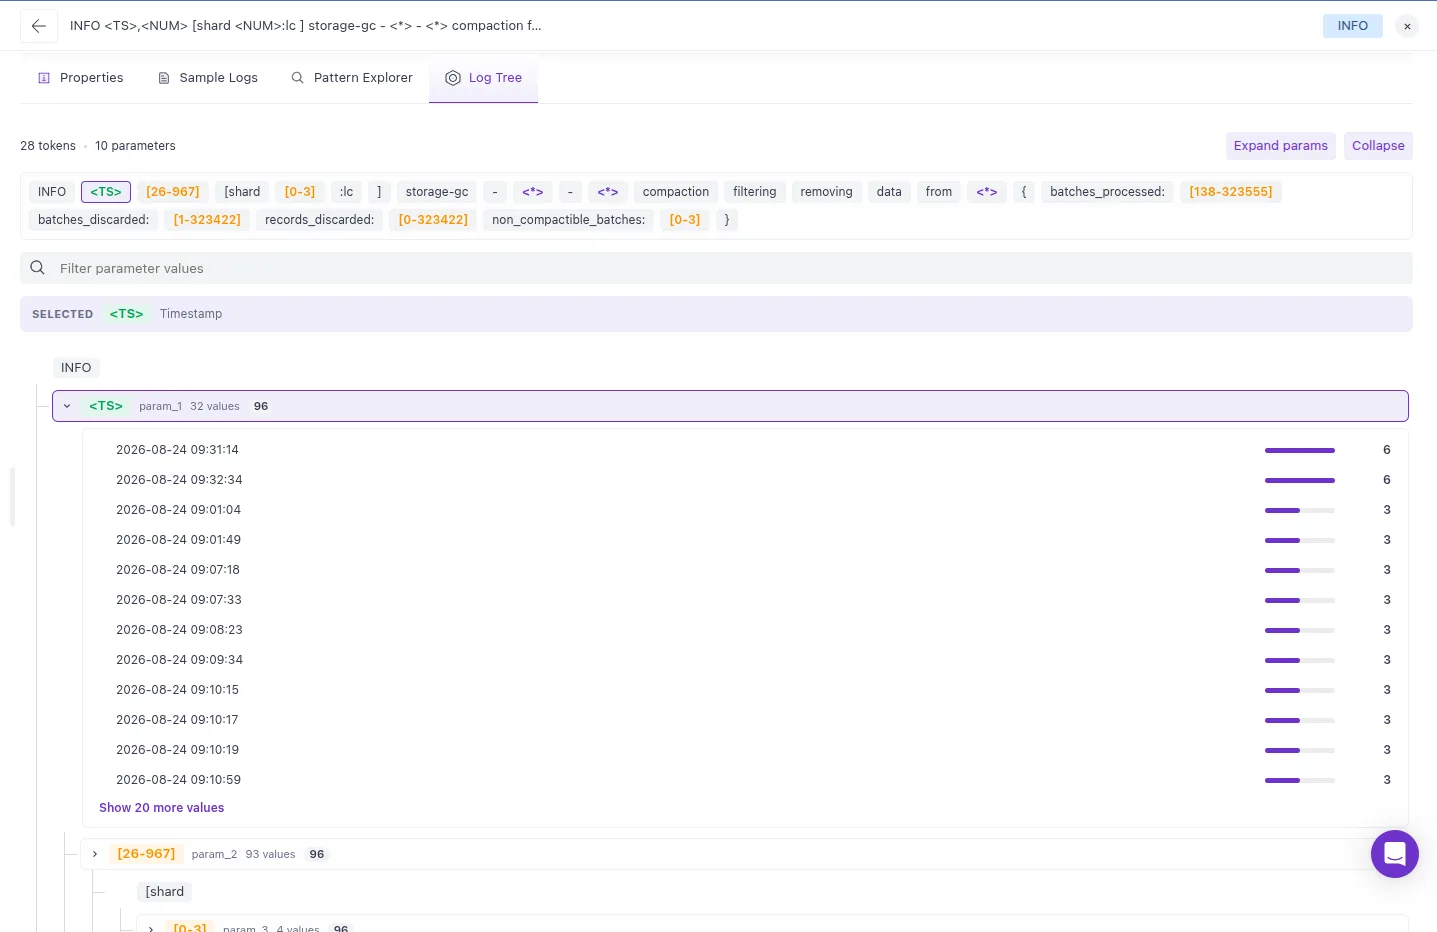
Expand Log Tree parameters to inspect values and occurrence counts. Use the hierarchy to review value distribution within a recurring log pattern.
Log Properties and Filtering#
- Log properties: Attributes are sorted alphabetically, with log and resource attributes combined under Log Property.
- JSON parsing: Fixed JSON parsing issues.
- Attribute copying: Added copy options for attributes such as OS, source, file name, host, container, cluster, pod, and deployment.
- Combined filters: Apply log pattern filters alongside log body filters.
Integration and Interface Updates#
- Datadog and Grafana: Added clearer autosave states in the integration interface.
- Prometheus on Kubernetes: Updated the metrics scraping configuration layout.
- Icons: Standardized import, export, and download icons.
- Number formatting: Standardized values across screens and tables to two decimal places, such as
1.25.
Need assistance or want to learn more about Middleware? Get in touch with us via our Contact Us or join our Slack channel.
What did you think of this content?