Network Monitoring
Network Monitoring provides visibility into communication between your services, hosts, and containers. Use it to identify which resources communicate, how much traffic they exchange, and which connections are slow or failing.
Cloud Network Monitoring collects TCP/UDP traffic and DNS activity through the Middleware Agent using eBPF on the Linux kernel. Network collection does not require application code changes.
With Cloud Network Monitoring, you can:
- Monitor traffic volume, throughput, connection failures, retransmissions, and latency.
- Explore service dependencies using Table, Sankey, and Map views.
- Investigate slow or failed DNS lookups.
- Review related logs, traces, processes, and alerts from connection details.
- Investigate network findings with OpsAI.
Configure Network Monitoring#
Enable Network Monitoring on the Middleware Agent for the hosts or clusters you want to monitor.
Prerequisites#
- Linux hosts, Docker on Linux, or Kubernetes with a Linux kernel that supports eBPF.
- Middleware Agent version 2.0.1 with Network Monitoring enabled.
- Your Middleware API key and target URL.
- Root access for host installation, or permission to install the Helm chart for Kubernetes.
- A cluster name when configuring Kubernetes.
Enable Data Collection#
Install or update the Middleware Agent for your environment:
Use the installation script for your DEB- or RPM-based distribution.
MW_API_KEY="<MW_API_KEY>" MW_TARGET="https://<MW_UID>.middleware.io:443" MW_AGENT_FEATURES_CLOUD_NETWORK_MONITORING=true bash -c "$(curl -L https://install.middleware.io/scripts/deb-install.sh)"On RPM-based distributions, use rpm-install.sh instead of deb-install.sh.
Use the Docker Agent installation script.
MW_API_KEY="<MW_API_KEY>" MW_TARGET="https://<MW_UID>.middleware.io:443" MW_AGENT_FEATURES_CLOUD_NETWORK_MONITORING=true bash -c "$(curl -L https://install.middleware.io/scripts/docker-install.sh)"Deploy the Middleware Agent using the Helm chart.
helm repo add jetstack https://charts.jetstack.io --force-update
helm install cert-manager jetstack/cert-manager --namespace cert-manager --create-namespace --version v1.14.5 --set installCRDs=true

helm repo add middleware-labs https://helm.middleware.io
helm install mw-agent middleware-labs/mw-kube-agent-v3 \
  --set global.mw.apiKey=<MW_API_KEY> \
  --set global.mw.target=https://<MW_UID>.middleware.io:443 \
  --set opsai.enabled=true \
  --set mw-autoinstrumentation.enabled=true \
  --set global.clusterMetadata.name=my-k8s-cluster \
  --set cloudNetworkMonitoring.enabled=true \
  -n mw-agent-ns --create-namespace
Replace my-k8s-cluster with your cluster name.
Then:
- Restart the agent after updating its configuration.
- Open Network Monitoring → Cloud Network to verify that traffic appears.
Data typically starts appearing within 1–2 minutes after collection begins.
Cloud Network Monitoring#
Go to Network Monitoring → Cloud Network.
The page provides three main areas:
| Area | What you can view |
|---|---|
| Analytics | TCP/UDP connections and DNS lookups in Table, Sankey, or Map views |
| Health | Host coverage, network findings, and failing DNS lookups |
| Dashboards | Network traffic, connectivity, performance, and application metrics |
Select the time range you want to investigate. The available data depends on the hosts collecting network telemetry and the filters applied to the view.
| Term | Meaning |
|---|---|
| Client / Server | The side that opened the connection / the side that accepted it. |
| Connection | Traffic between a client and a server in the selected time range. One table row. |
| Volume / Throughput | Total data moved / data moved per second. |
| TCP failures | Connection attempts that failed: timeout, refused, reset, unreachable or canceled. |
| Retransmits | Packets sent again because they were lost. A rise usually means network trouble. |
| RTT / Latency | Time to reach the server and come back / half of that. |
| DNS errors | NXDOMAIN: the name doesn't exist. SERVFAIL: the DNS server couldn't answer. Timeout: no answer. |
| N/A (unresolved) | A side Middleware couldn't name, such as an external IP. Hidden unless Show Unresolved is on. |
Analytics#
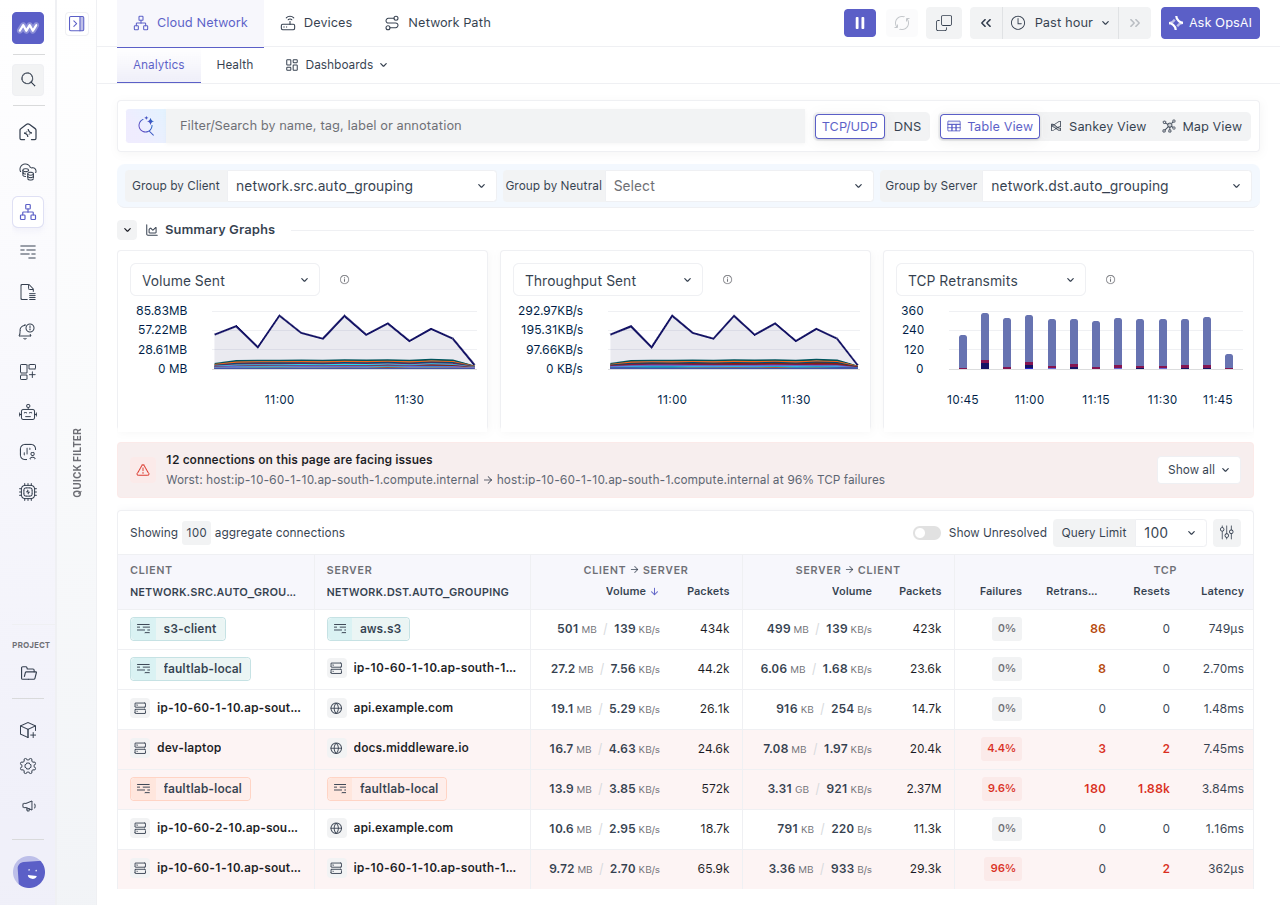
Use Analytics to explore traffic between clients and servers.
A client initiates communication, and a server receives it. The selected grouping determines how each side is represented, such as by service, host, container, availability zone, or IP address.
At the top of the page:
- Select TCP/UDP or DNS traffic.
- Choose Table, Sankey, or Map.
- Set the grouping for the client and server.
- Apply filters to focus on the resources you want to investigate.
The Summary Graphs show trends for the busiest connections. A problem banner identifies how many connections in the current view have detected issues.
Search and Filter Traffic#
Use the search bar or Quick Filter panel on the left to narrow traffic by available resource attributes.
For example, filter by a service and group the destination by host to inspect which hosts receive its traffic.
Additional controls include:
| Control | Purpose |
|---|---|
| Group By | Choose how client and server data is aggregated |
| Show Unresolved | Include traffic where one side could not be identified and appears as N/A |
| Query Limit | Control how many connections are loaded |
| Column Selector | Choose the fields displayed in the table |
The page URL preserves the selected view, grouping, filters, and time range. Copy the link to share the same investigation view with a teammate.
Table View#
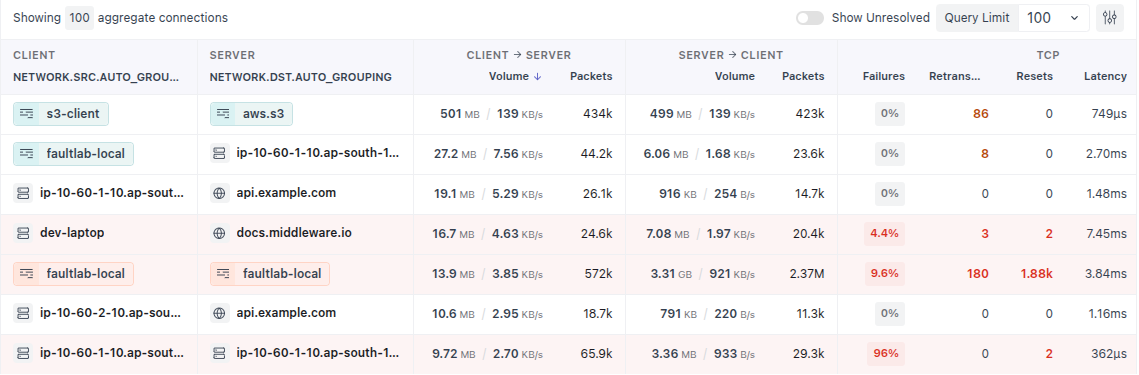
The Table view displays traffic between each client and server grouping. A row can aggregate multiple underlying network flows.
Available fields include:
| Field | Description |
|---|---|
| Client / Server | Resources communicating with each other, based on the selected grouping |
| Volume | Total data transferred during the selected time range |
| Throughput | Data transferred per second |
| Packets | Packet counts for the selected traffic |
| TCP Failures | Recorded TCP failures, such as timeouts, refused connections, and resets |
| Retransmits | TCP packets sent again; an increase can indicate a connection problem |
| Resets | TCP connection resets |
| RTT | Round-trip time between the endpoints |
| Latency | An estimate calculated as RTT divided by two |
TCP health metrics apply to TCP traffic. The latency estimate describes network timing, rather than the complete execution time of an application request.
Select a column heading to sort the table. For example:
- Sort by Volume to identify the connections transferring the most data.
- Sort by Failures to find connections with failed communication.
- Review Retransmits and RTT when investigating slow connections.
Use the column selector to display additional fields, such as RTT or closed connections.
Health Indicators#
The table highlights values that need attention:
- Red row: TCP failure rate is 1% or higher.
- Highlighted values: Failures, retransmits, resets, or elevated latency, including latency of 20 ms or higher.
These indicators help prioritize investigation. Configure alert rules separately when you need notifications.
Connection Details#
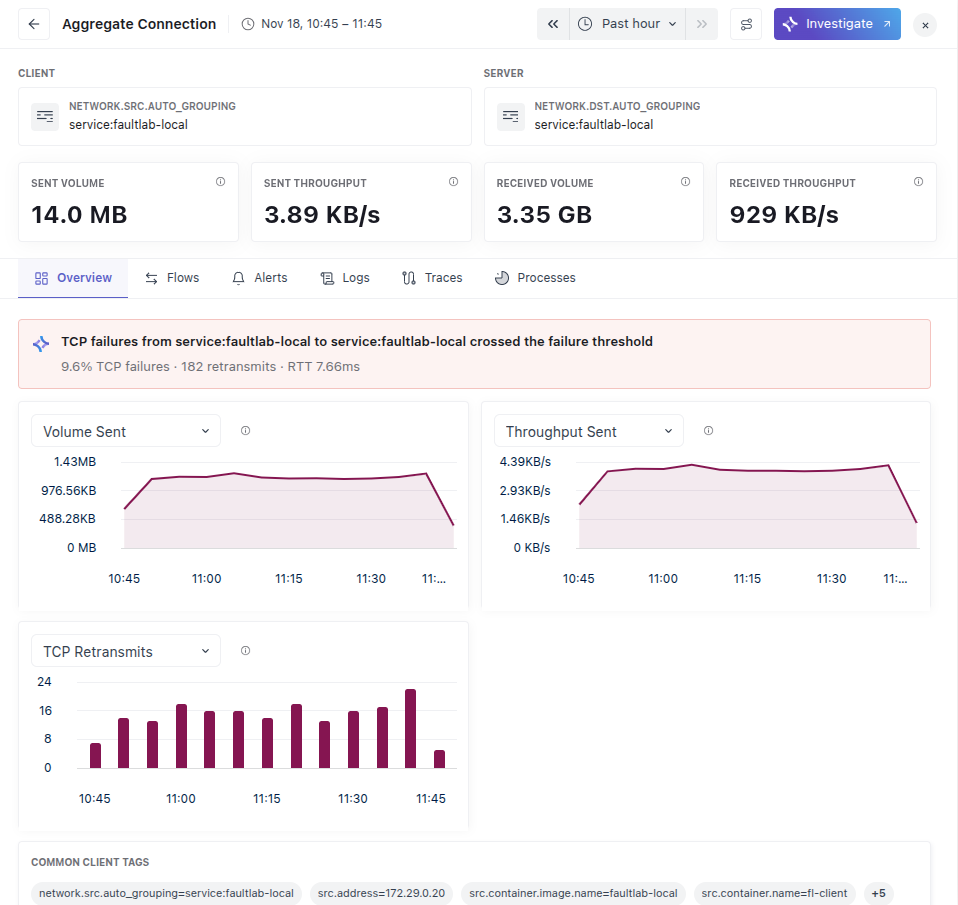
Select a row in the Table view to open its Connection Details panel. You can also open connection details by selecting a band in the Sankey view.
The panel identifies the client and server and shows the amount of data transferred in each direction.
| Tab | Contents |
|---|---|
| Overview | Detected issues, connection-specific charts, and shared tags |
| Flows | Individual flows with client and server IP addresses, ports, hosts, and tags |
| Alerts | Alert rules associated with the connection |
| Logs | Related logs filtered to the client and server |
| Traces | Related application traces filtered to the client and server |
| Processes | Processes associated with the client and server |
For DNS traffic, the Flows tab is labeled Requests.
Review Individual Flows#
Open Flows to inspect the individual network flows behind an aggregated connection.
Use the IP addresses, ports, hosts, and tags to identify which machines are involved. For example, a connection grouped by service may contain flows from several hosts or containers.
Correlate Related Telemetry#
Use Logs, Traces, and Processes to investigate the resources involved in the connection.
These views use the client and server context to narrow the data. Related telemetry is available when the corresponding log collection, application tracing, or process monitoring is configured.
Inspect IP Addresses#
When grouping by IP address, such as src.address or dst.address, hover over an IP to inspect the available information.
| IP Type | Available Context |
|---|---|
| Private IP | Monitored host and containers associated with the address, with links to Infrastructure Monitoring |
| Public IP | Network ownership or autonomous system (AS), domain, country, and continent |
Select Apply as Filter to narrow the page to that IP address.
Use this information to identify the resource behind a private address or understand which external network a service communicates with.
| Private IP | Public IP |
|---|---|
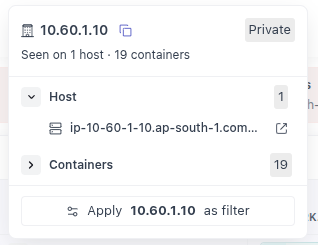 | 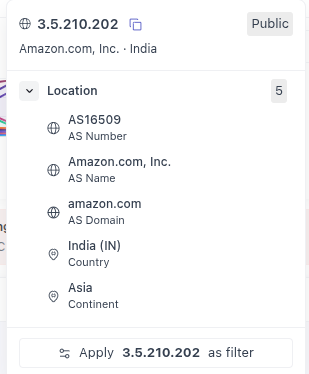 |
| The host and containers behind the IP, with links to them. | Who owns the IP: network (AS), domain, country and continent. |
Sankey View#
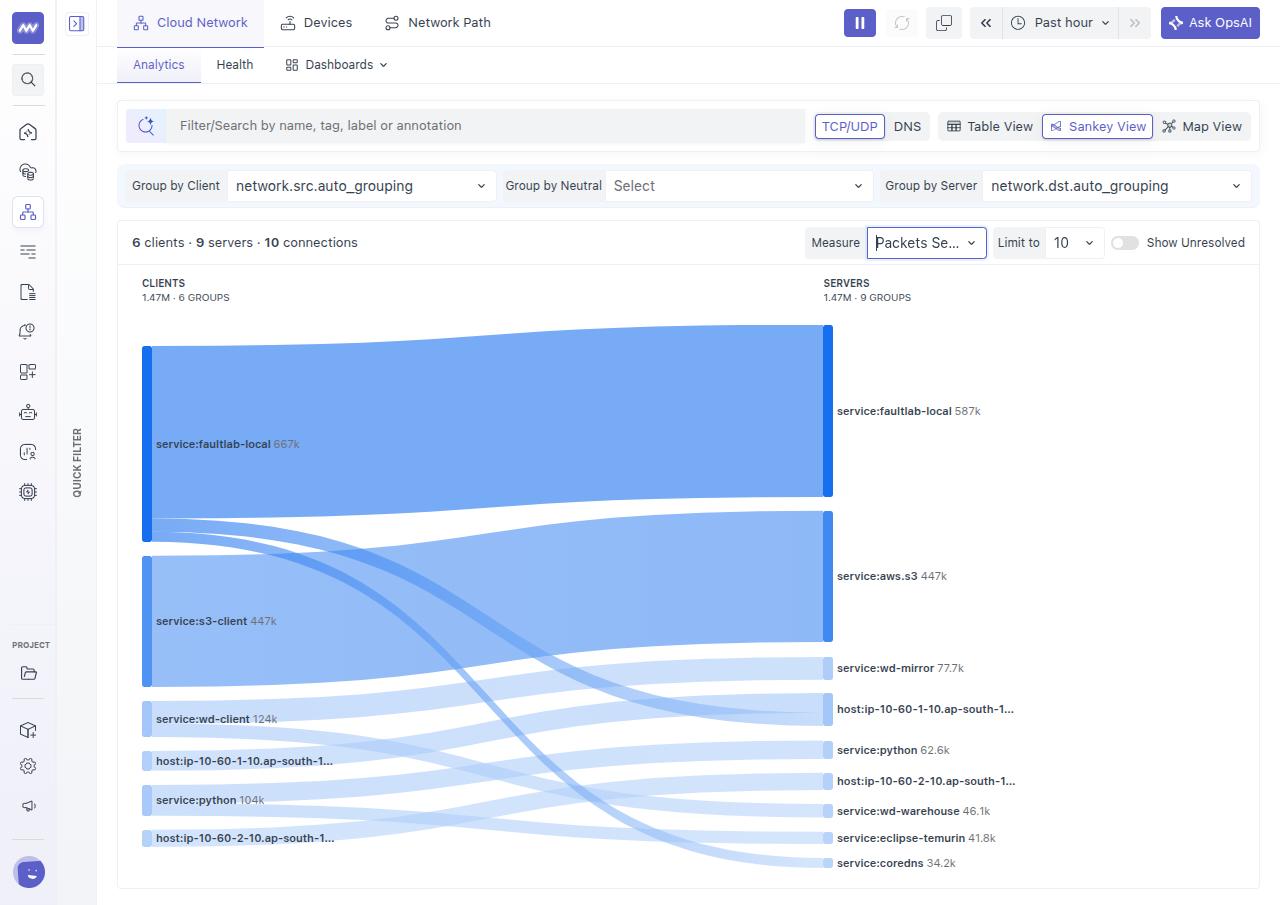
The Sankey view displays communication as flows between clients on the left and servers on the right.
Each band connects a client to a server. Its width represents the selected Measure.
Available measures include:
- Bytes
- Packets
- Retransmits
- Latency
- Failures
When Bytes is selected, wider bands represent connections transferring more data. When Failures is selected, wider bands represent connections with more failures.
Hover over a band or resource to inspect its value. Use Limit to control how many connections are drawn, and select a band to open its connection details.
Use this view to compare traffic distribution or identify which connections contribute most to a selected network metric.
Map View#
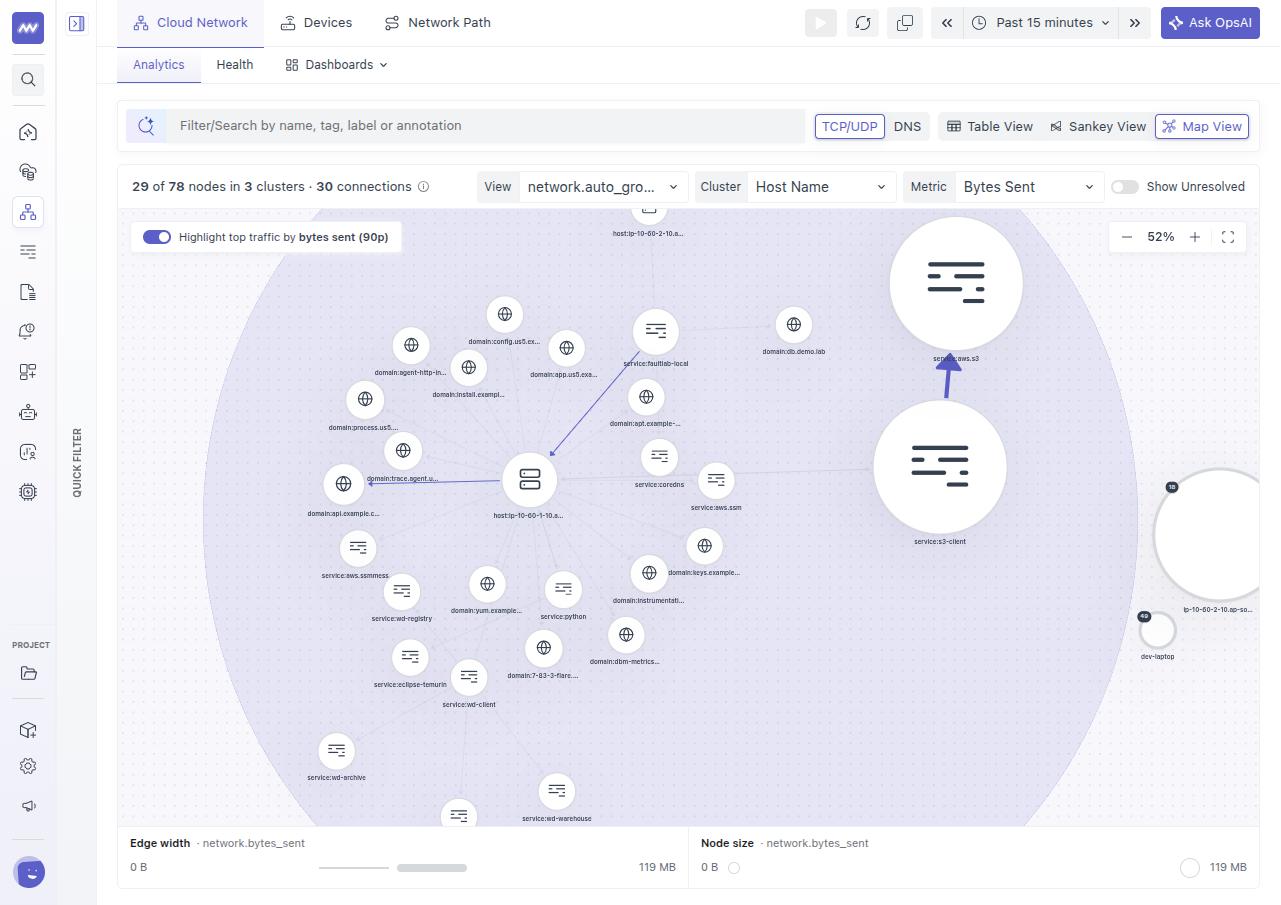
The Map view displays resources and the connections between them.
- Nodes represent services, hosts, containers, or domains.
- Lines represent communication between resources.
- Arrows indicate the direction from client to server.
- Node size and line thickness reflect the selected metric.
Use Highlight Top Traffic to emphasize the busiest connections. Hover over a node to highlight its connections, or select it to focus on that resource and the resources it communicates with.
The View control changes what each node represents. Enable Show Unresolved to include traffic whose resource identity could not be determined.
Use the map to inspect service dependencies, communication with external domains, and resources connected to an affected service.
Group Resources into Clusters#
Use Cluster to group map nodes by attributes such as host, availability zone, or region.
Select a cluster bubble to expand it and inspect the resources inside.
The number on a bubble is the larger of its client count and server count. Hover over the bubble to see both counts. The number of distinct resources inside can be higher because the two groups may contain different resources.
DNS Monitoring#
In Analytics, switch the traffic type to DNS to inspect name resolution activity.
The DNS table provides information such as:
- Client making the lookup.
- Domain being queried.
- DNS server associated with the request.
- Number of lookups.
- Response timing.
- Percentage of failed or timed-out lookups.
Common error types include:
| Error | Meaning |
|---|---|
| NXDOMAIN | The queried domain name does not exist |
| SERVFAIL | The DNS server could not complete the query |
| Timeout | No response was received within the expected time |
Sort by % SERVFAIL or % Timeouts to identify affected clients, domains, and DNS servers.
Select a row to open its details, then use Requests to inspect individual lookups and review available logs or traces.
Network Health#
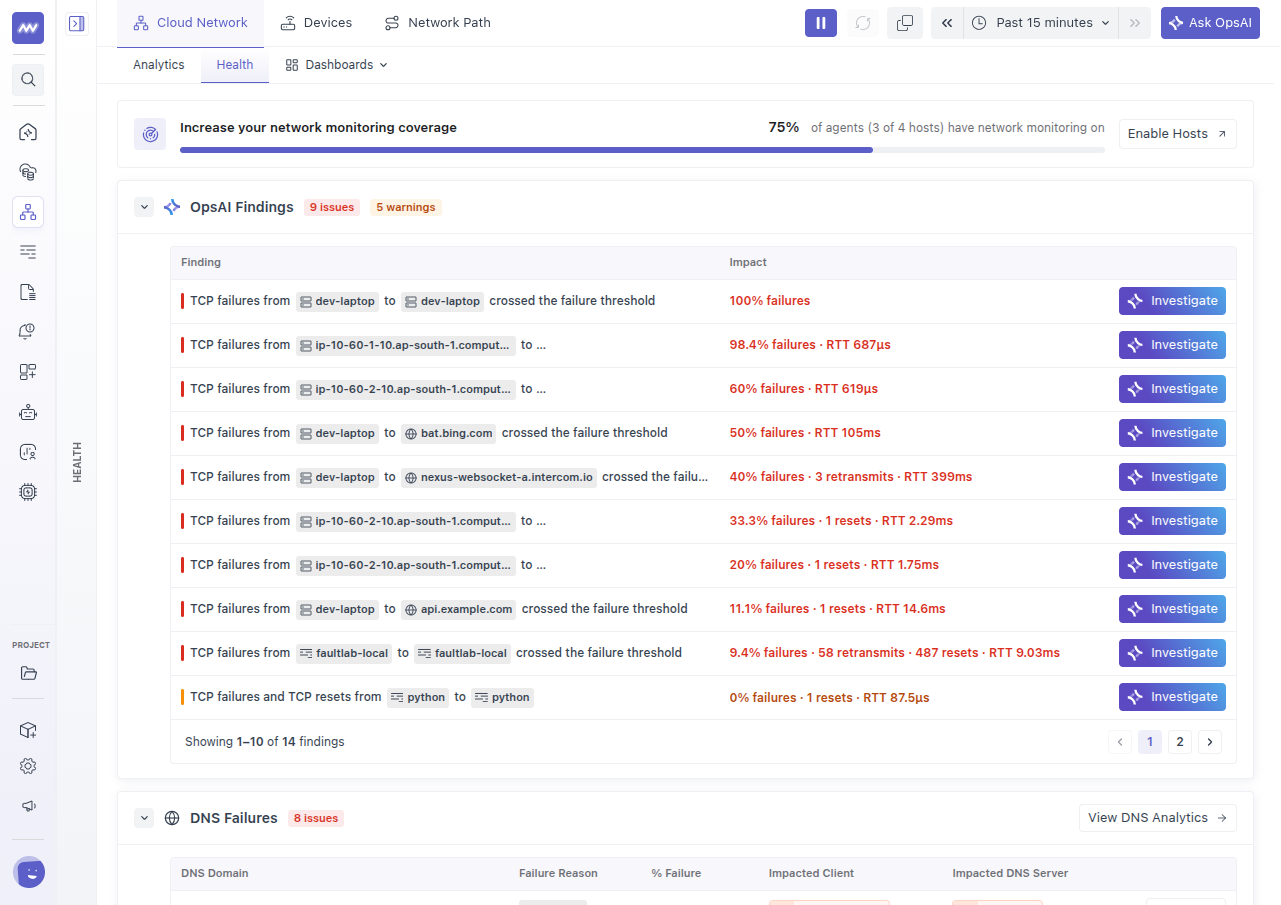
Open Cloud Network → Health to review detected network issues and monitoring coverage.
Host Coverage#
The coverage bar shows how many hosts are sending network data.
Select Enable Hosts to configure collection on additional hosts. Review coverage when checking whether a service or host is represented in the network views.
OpsAI Findings#
OpsAI Findings lists connections with detected problems.
Findings include:
- Critical: TCP failures have crossed the applicable failure threshold.
- Warning: Connections show retransmissions, resets, or elevated round-trip times.
- Impact: Metrics describing the detected issue.
Select a finding to inspect the affected connection, or use Investigate to start an OpsAI analysis.
If no findings are listed, no issues have been detected within the current monitoring scope. Review host coverage and the selected time range when assessing the result.
DNS Failures#
The DNS Failures section highlights domains with failing lookups.
Each entry provides the failure reason, such as SERVFAIL or timeout, together with the client and DNS server involved.
Select Details to inspect the requests, or View DNS Analytics to explore the wider lookup activity.
Investigate Network Issues with OpsAI#
Use Investigate from a connection or Health finding to analyze a network issue.
- Open the affected connection or finding.
- Select Investigate.
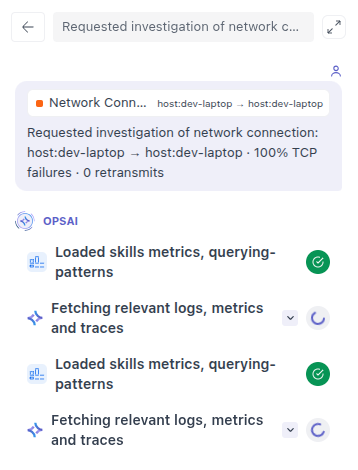
- OpsAI opens a chat panel with the connection and time range included as context.
- Review the investigation as OpsAI retrieves and analyzes available metrics, logs, and traces.
- Read the root cause analysis and ask follow-up questions to clarify the findings.
For example:
- What could be causing failures between these services?
- Do the related logs show errors during the same period?
- Does increased network latency coincide with slower application requests?
- Which hosts or processes should I inspect next?
Investigations are saved under OpsAI → Chats. Use the expand control to open the conversation in full view or return to it later.
Network Dashboards#
Cloud Network Monitoring includes four predefined dashboards.
Two are available under Health → Dashboards. The other two open from the Dashboards menu at the top of Cloud Network.
| Dashboard | Location | What It Shows |
|---|---|---|
| Intro to Cloud Network | Health → Dashboards | Traffic volume, connections, failures, services, external domains, and host coverage |
| Connectivity & Performance | Health → Dashboards | Service-to-service flows, traffic sent and received, RTT, connection failures, retransmits, dependencies, and DNS |
| CNM Metrics Overview | Dashboards menu | Network load, TCP and DNS health, traffic by availability zone, and APM errors and latency |
| CNM Use Case Overview | Dashboards menu | Cross-zone traffic, external destinations, service dependencies, highest-volume connections, and failing DNS lookups |
Use CNM Metrics Overview to compare network behavior with application errors and latency. Use CNM Use Case Overview to inspect traffic patterns, including traffic crossing availability zones that may contribute to data-transfer costs.
The two CNM dashboards are also available in the main Dashboards list by searching for CNM.
To customize a dashboard, open it and select Save as a Copy.
Investigation Workflows#
Investigate a Slow or Failing Connection#
- Open Cloud Network → Health and select a finding, or use Analytics → Table to locate the affected client and server.
- Review failures, retransmits, RTT, and traffic volume for the relevant time range.
- Open Connection Details → Overview to inspect the connection's metric trends.
- Check Flows to identify the hosts, IP addresses, and ports involved.
- Review related Logs, Traces, and Processes for activity during the same period.
- Select Investigate to use OpsAI with the connection context.
Investigate DNS Resolution Failures#
- Open Analytics and select DNS.
- Filter to the affected service, host, or domain.
- Sort by % SERVFAIL or % Timeouts.
- Open an affected entry and review its Requests.
- Compare the failure reason, client, DNS server, and related telemetry to narrow the investigation.
Troubleshooting#
The Setup Page Still Appears After Installation#
Allow approximately 1–2 minutes for data to arrive after network collection starts.
If the setup page remains:
- Confirm that the agent version supports Network Monitoring.
- Verify that the host uses Linux with an eBPF-compatible kernel.
- Confirm that Network Monitoring is enabled and the agent was restarted after configuration changes.
- Check the API key, target URL, and agent connectivity.
Some Connections Show N/A#
N/A means Middleware could not resolve one side of the connection to a named resource.
Enable Show Unresolved to include this traffic. Try grouping by IP address or domain, or enable collection on additional hosts to provide more resource context.
The Map Cluster Count Differs from the Resources Inside#
The cluster badge displays the larger of the client and server counts. Hover over it to review both values; the distinct resources inside may include members of either group.
NXDOMAIN Is High in Kubernetes#
Kubernetes DNS search domains can cause a lookup to try several names before resolving the intended one. Some of those attempts can return NXDOMAIN.
Inspect the queried names and whether the intended lookup eventually succeeds before treating the count as an application failure. See Kubernetes DNS for Services and Pods for search-domain behavior.
Are Application Code Changes Required?#
No. Network traffic is collected through eBPF on the Linux kernel. Application traces and logs require their corresponding instrumentation or collection to appear in related-data views.
What did you think of this content?