Custom Dashboard
You can build your own dashboard with the important metrics you have and use it to check the performance of your infrastructure and applications. Builder is divided into multiple widgets and each widget can have multiple metrics with different types of graphs. Data in builder will purely depend on the agents installed in your system and data you are sending in Middleware.
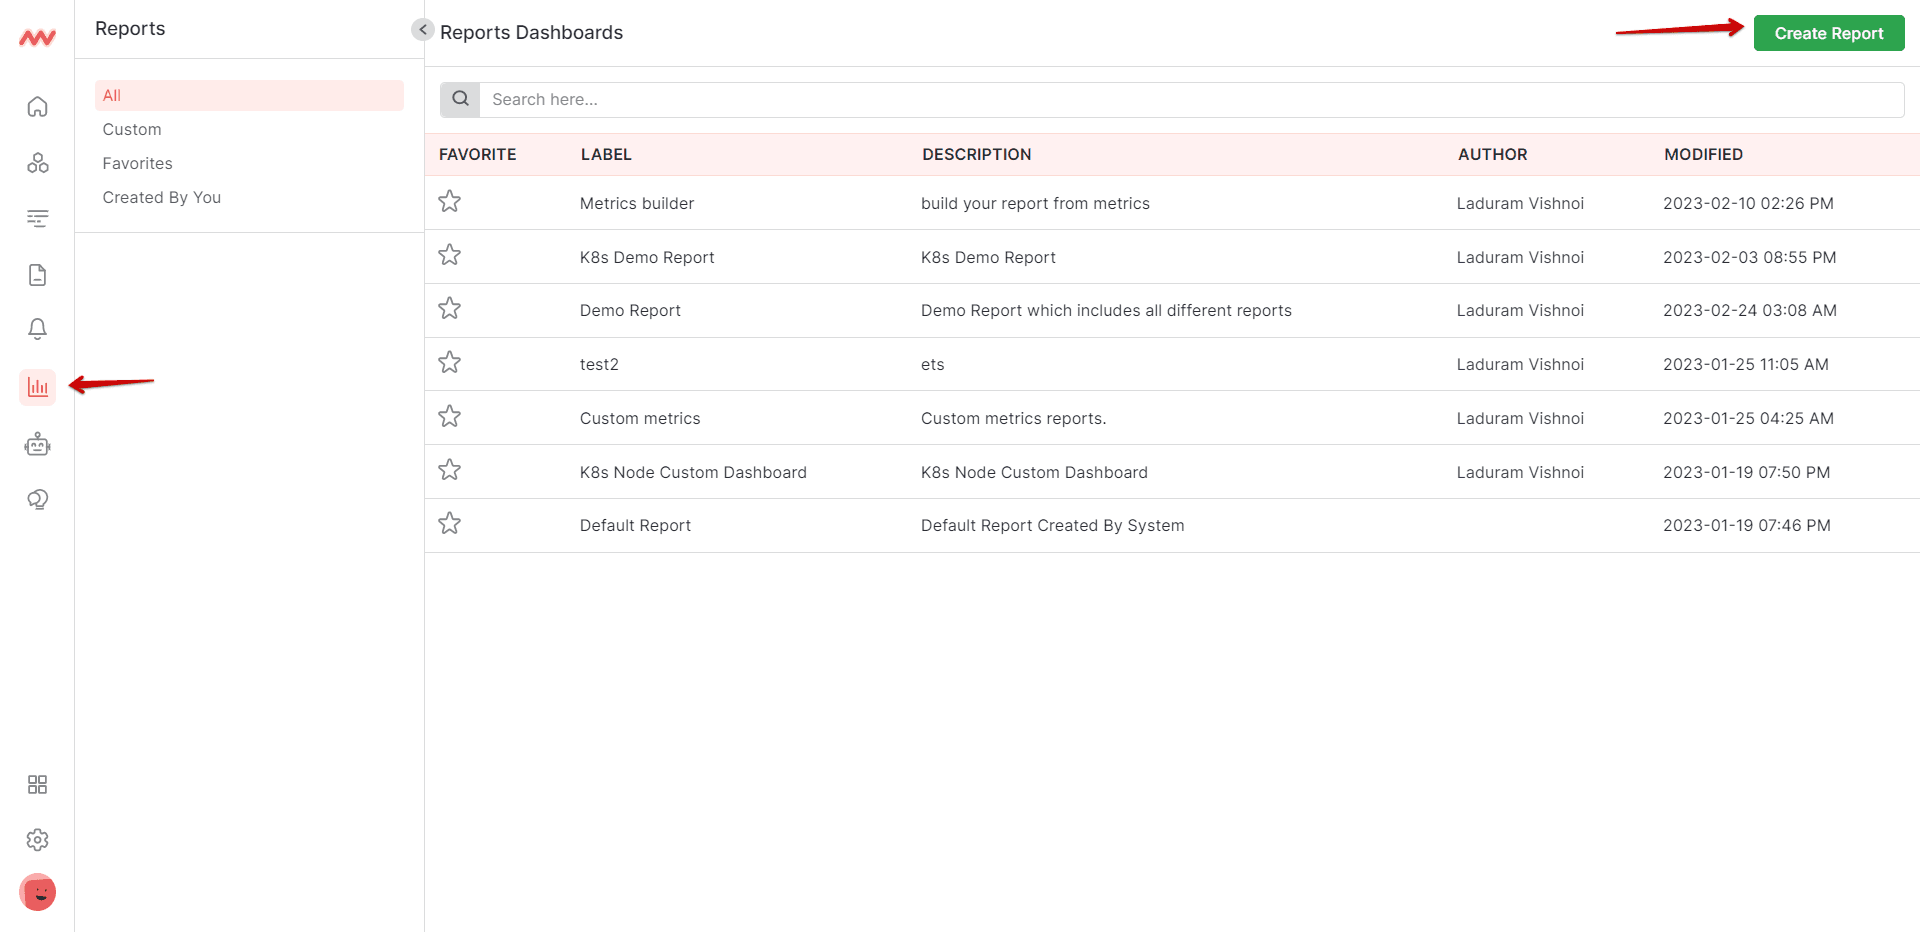
Create new Dashboard/Report#
Create your dashboard in just a few clicks. Login to Middleware -> go to “Dashboard Builder” -> Create Report
You need to add the name and description of your custom dashboard and saving it will redirect you to add widget in that dashboard.
Add data to your dashboard#
Add New Widget#
All the Widgets are draggable and you can adjust your widget as per your requirement. You can edit a particular widget as you hover over a widget, and an edit icon will be visible By clicking on the edit widget, a widget view will open in the dialog to edit the existing widget Or you can click on the “Add New Widget” button to add a new widget with metrics of your choice.
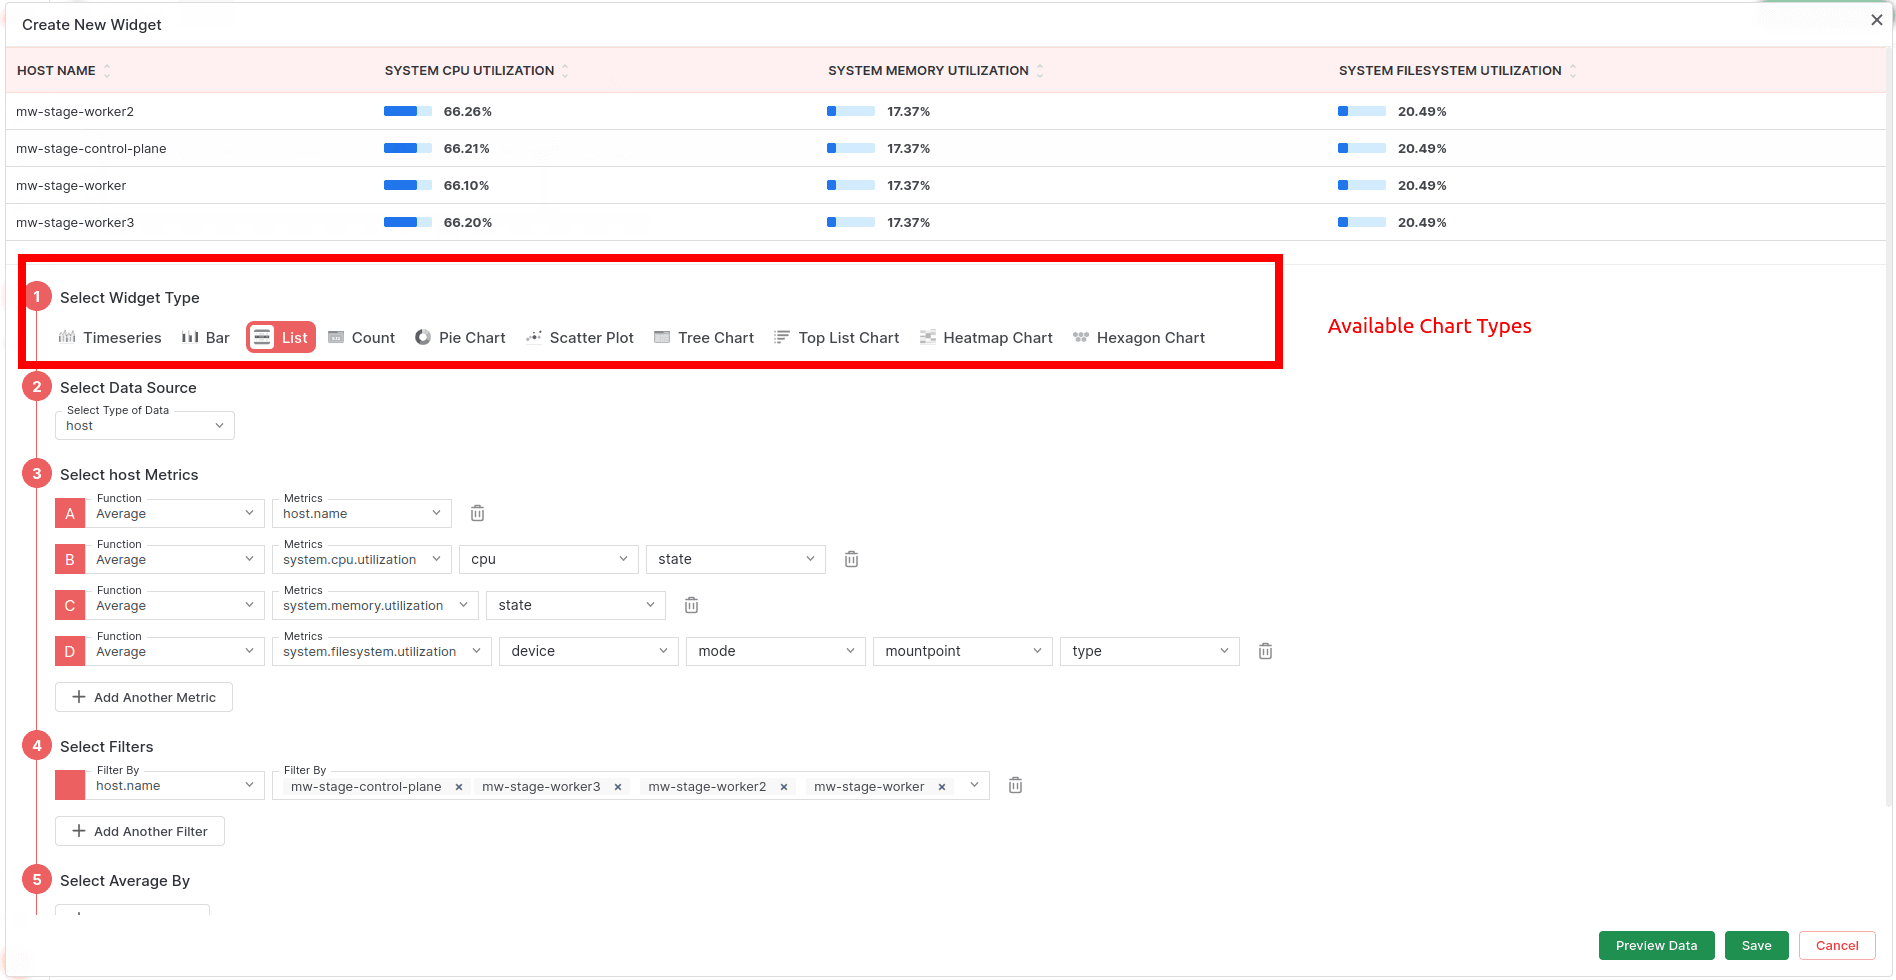
By clicking on “Add New Widget”, a new dialog box will appear with different options.
Available different types of graphs
- Time series: To see data in a time series chart
- Bar chart: To see data in different bars
- List: To see data as the table view
- Count: To see the total number of resources for a particular type
- Pie Chart: To see data in different pies based on the percentage of data
- Scatter Plot: To see data in a scatter plot chart
- Tree Chart: To see data in a tree chart
- Top List Chart: To see data in a top list chart
- Heatmap Chart: To see data in a heatmap chart
- Hexagon Chart: To see data in a hexagon chart
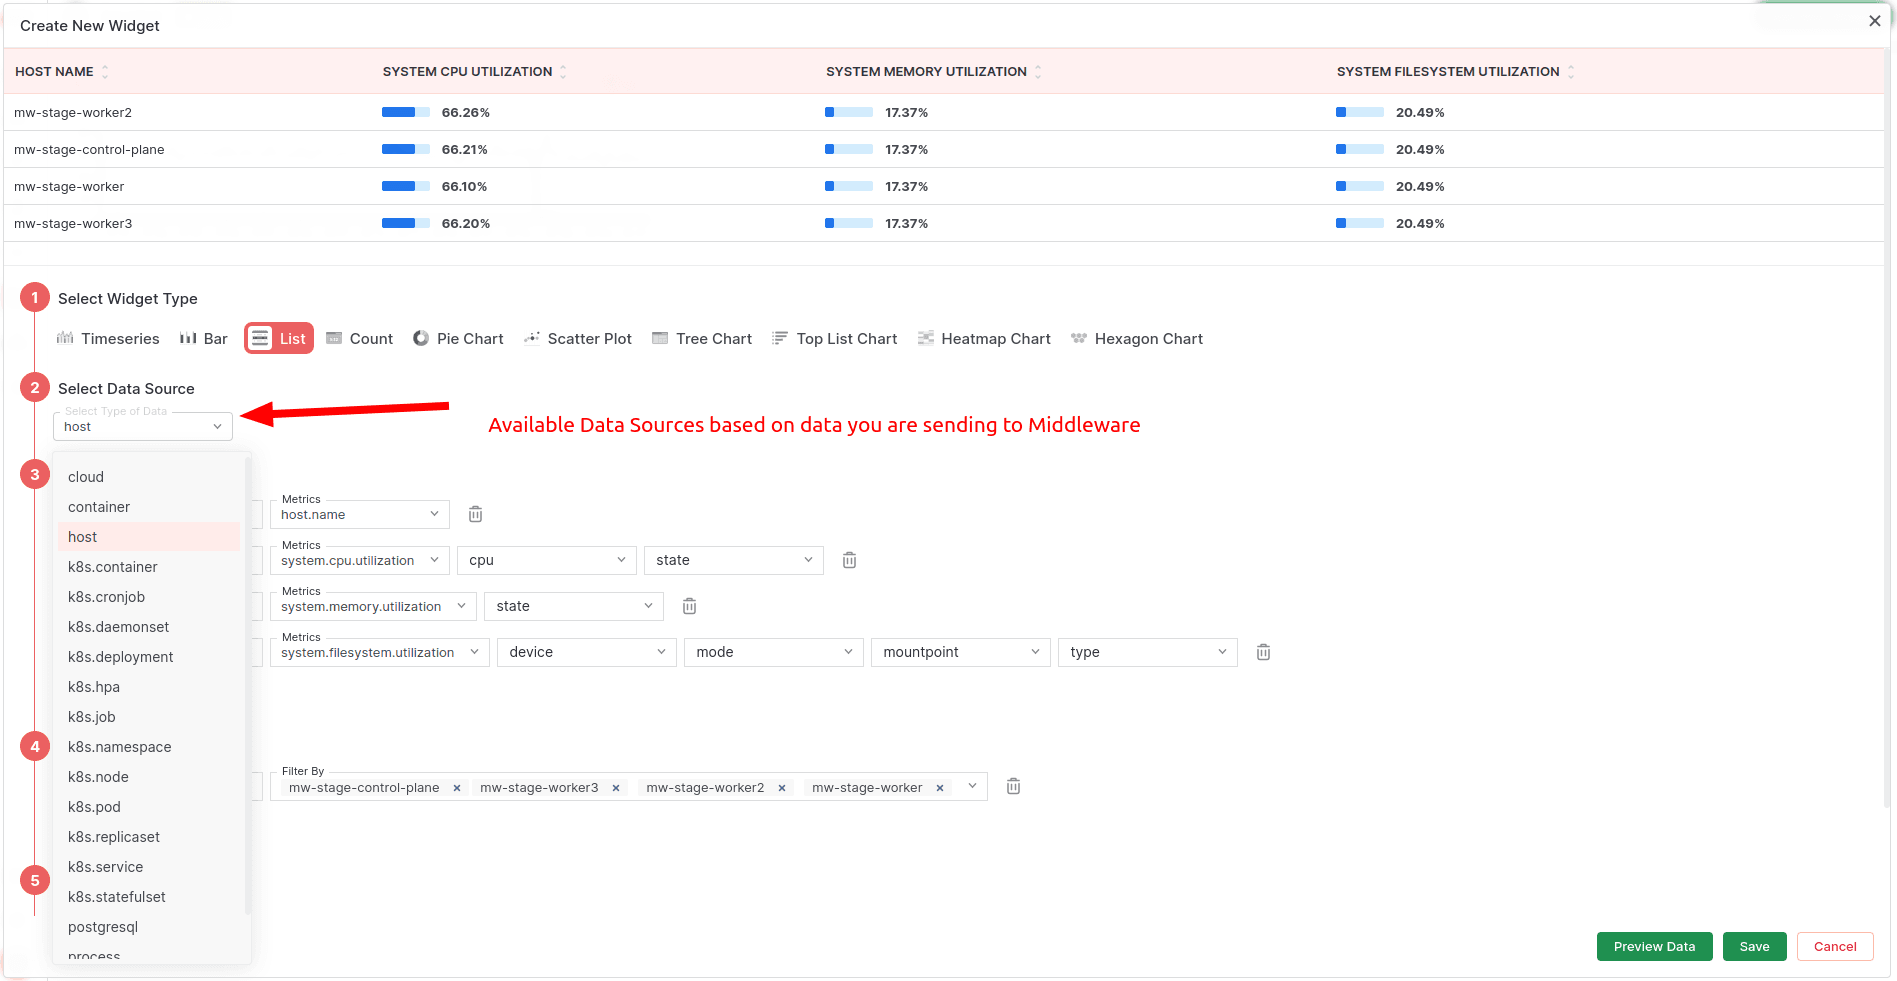
Select Data Source#
You can select a data source to create the dashboard. You will get a list of data sources based on the data of your infrastructure. Data sources will be based on resource types that we are getting in our system. If you are sending custom metrics with your own resource type, that resource type will be shown here in the dropdown. We have our system to identify resources based on some attributes and metrics. So based on some parameters, we are identifying resource types to display and select metrics of that resource type.
Ex. If you have a host agent installed, you will get “host”, and “process” in the dropdown. If you have docker installed then the host agent will identify all containers in the host and will add “container” in this dropdown. If you have installed a K8s agent in the K8s cluster, our system will identify all K8s resources and will add them to this dropdown. Ex. “k8s.cluster”, “k8s.node”, “k8s.pod”, “k8s.container”, “k8s.deployments”, “k8s.replicasets”, “k8s.jobs”, “k8s.cronjobs”, “k8s.deamonsets”, “k8s.statefulsets”
This section is dynamic and purely depends on data we are receiving from different types of MW agents.
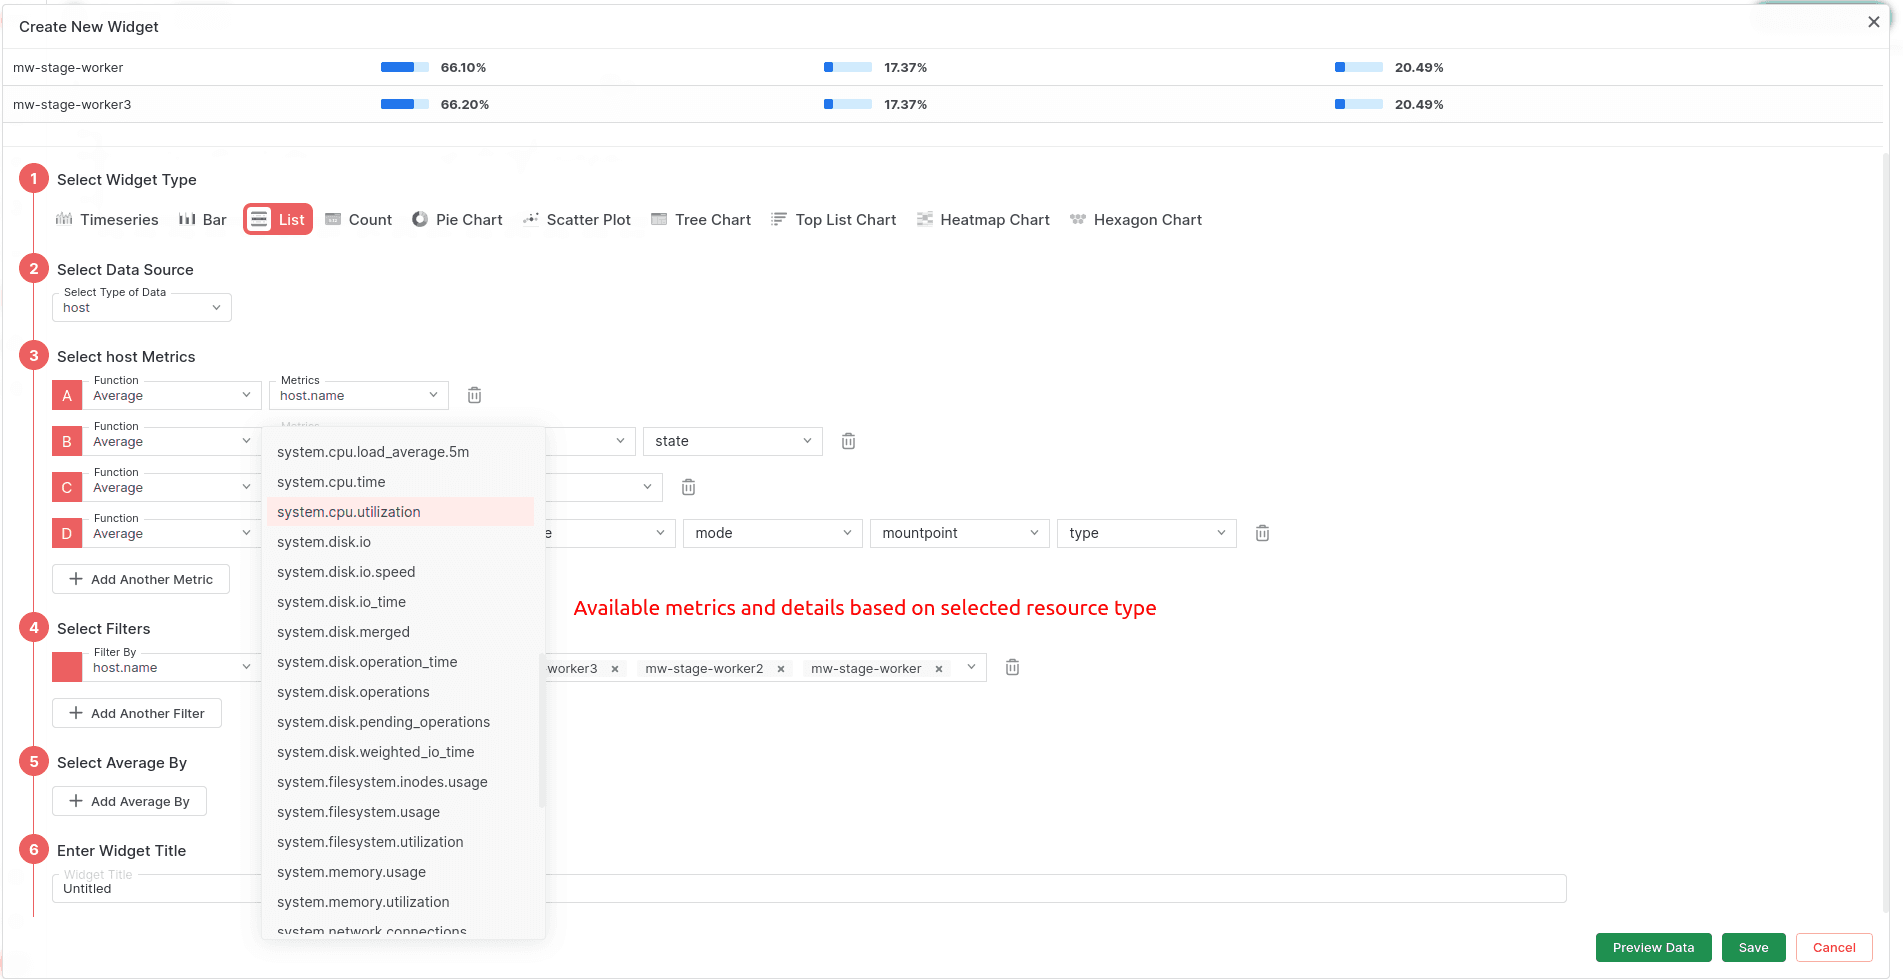
Select Metrics#
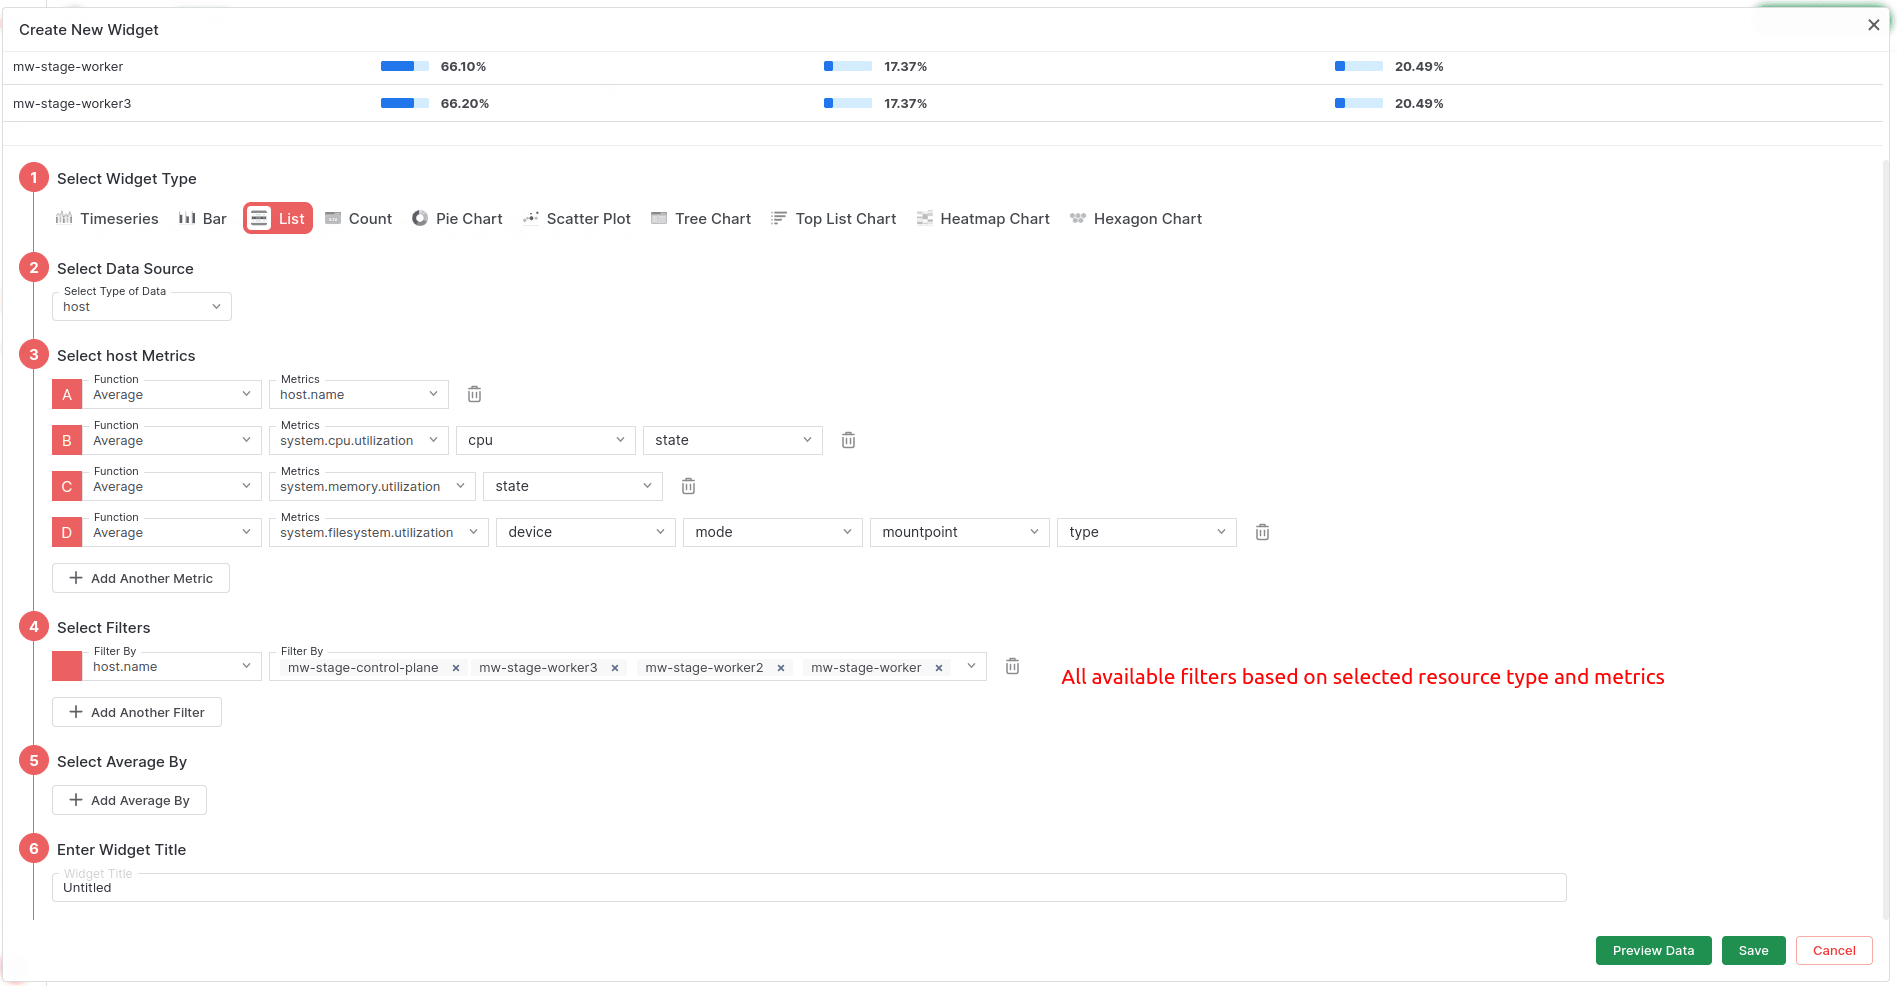
You will get a list of all available metrics based on selected data resources. Along with metrics, the system will show available attributes in different dropdowns beside the main metric. Our system will identify all metrics attributes sent to our system through our agent or custom API
You can select Aggregation type for your metrics. You can select any one of the following aggregation types for your metrics. Available aggregation types are
- Average
- Sum
- Count
- Min
- Max
- Any
Ex. If you have selected Host as the resource type, this dropdown has all metrics related to hosting resource type…like Host.name, system.disk.io.speed, system.network.connections,system.cpu.time, system.cpu.utilization, system.memory.utilization, system.network.io.bandwidth, system.network.io and many more…
Once you select any one metrics from the first dropdown, the system will show all available attributes and the values of that selected metrics. If you have selected system.cpu.utilization then our system has different attributes of that metrics like CPU Core Name, CPU State.
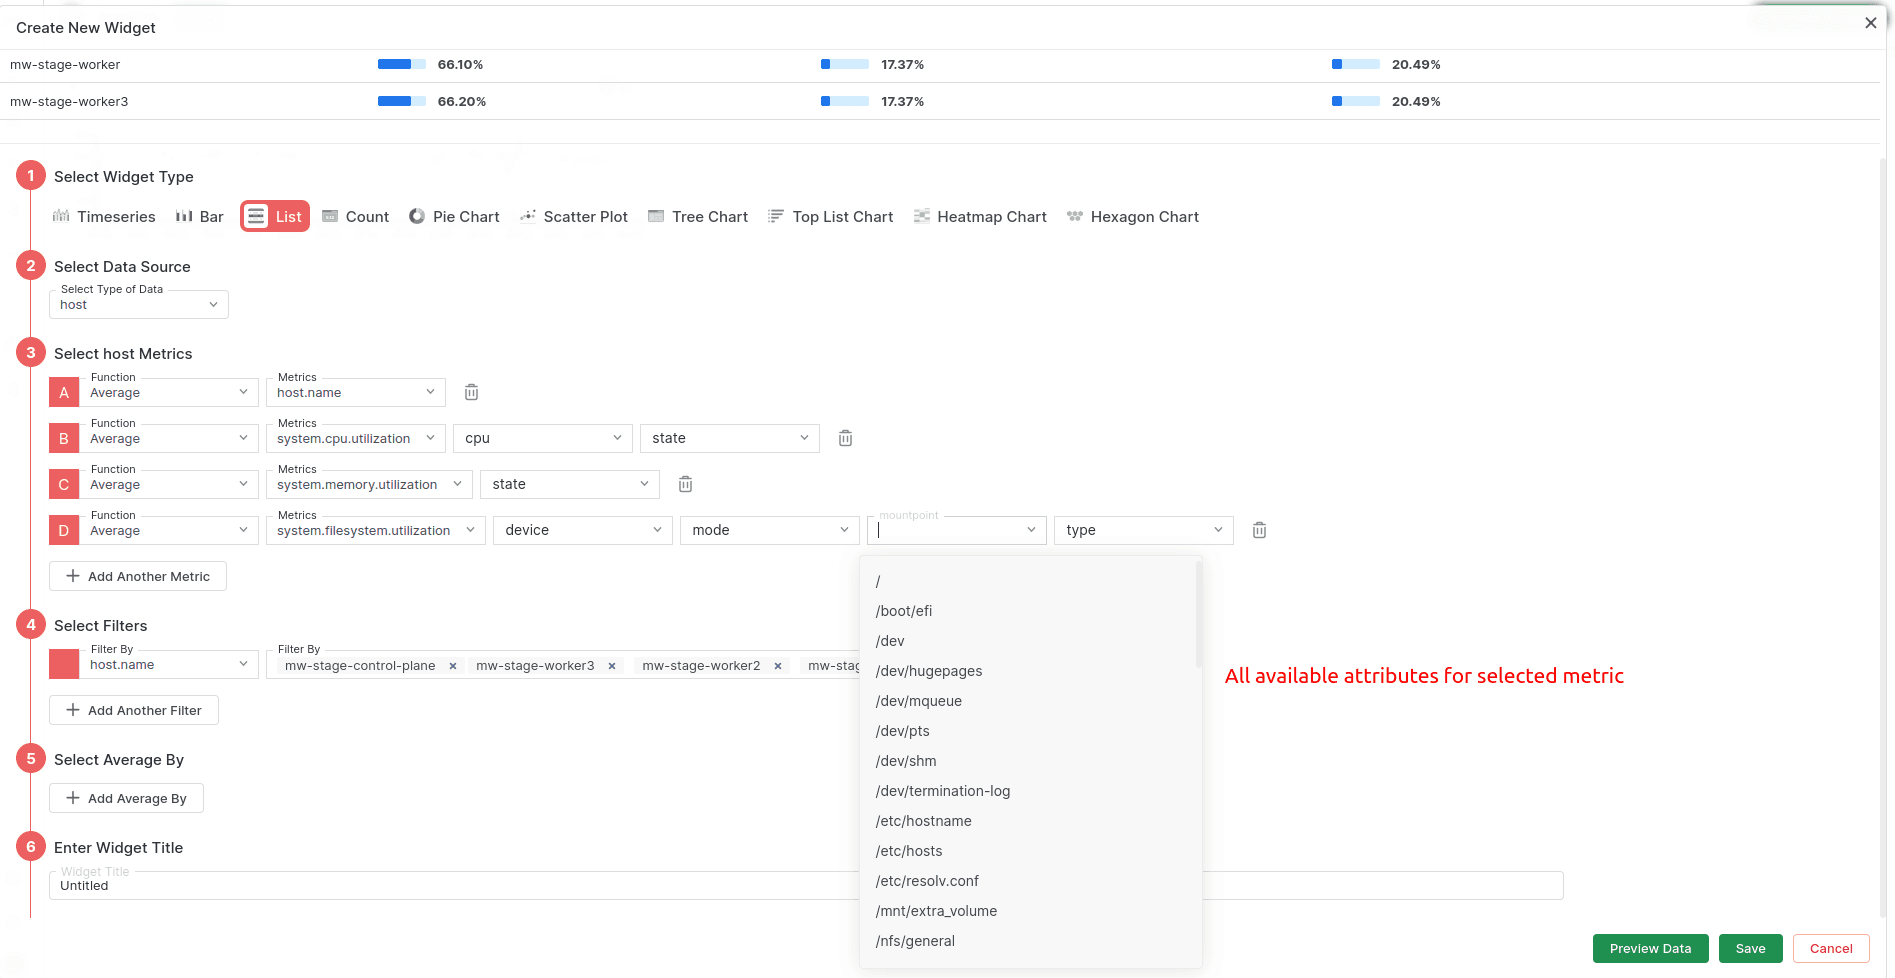
Select Filters#
You can filter out data based on your requirement. You will be able to see all available filters for selected resource type and metrics. You can select multiple filters to filter out your data. If you have selected k8s.pod as the resource type and any metrics of the pods, then you can filter your data by host.id or namespace or node and output will be based on your metrics and filters.
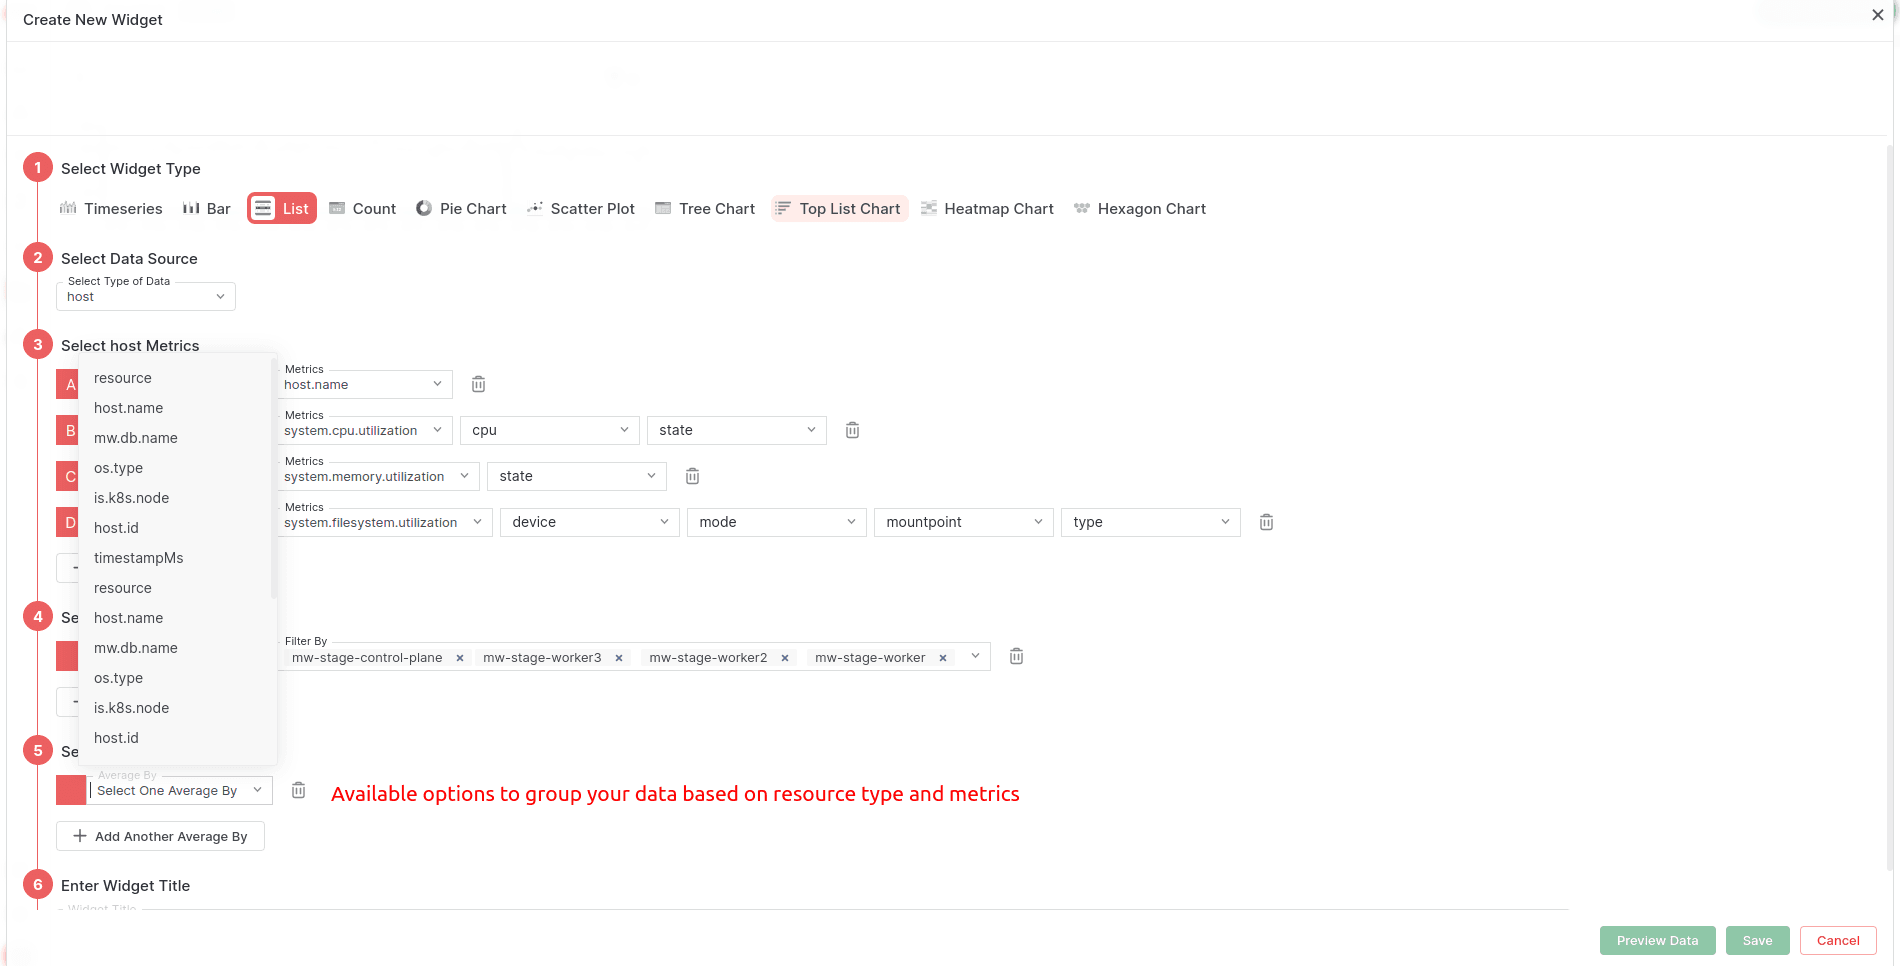
Select Data average by#
avg your data based on resource attributes. If you select host as the resource type and any metrics of the host, then you can average your data by host.name or host.id and output will be based on your metrics and avg by selection.
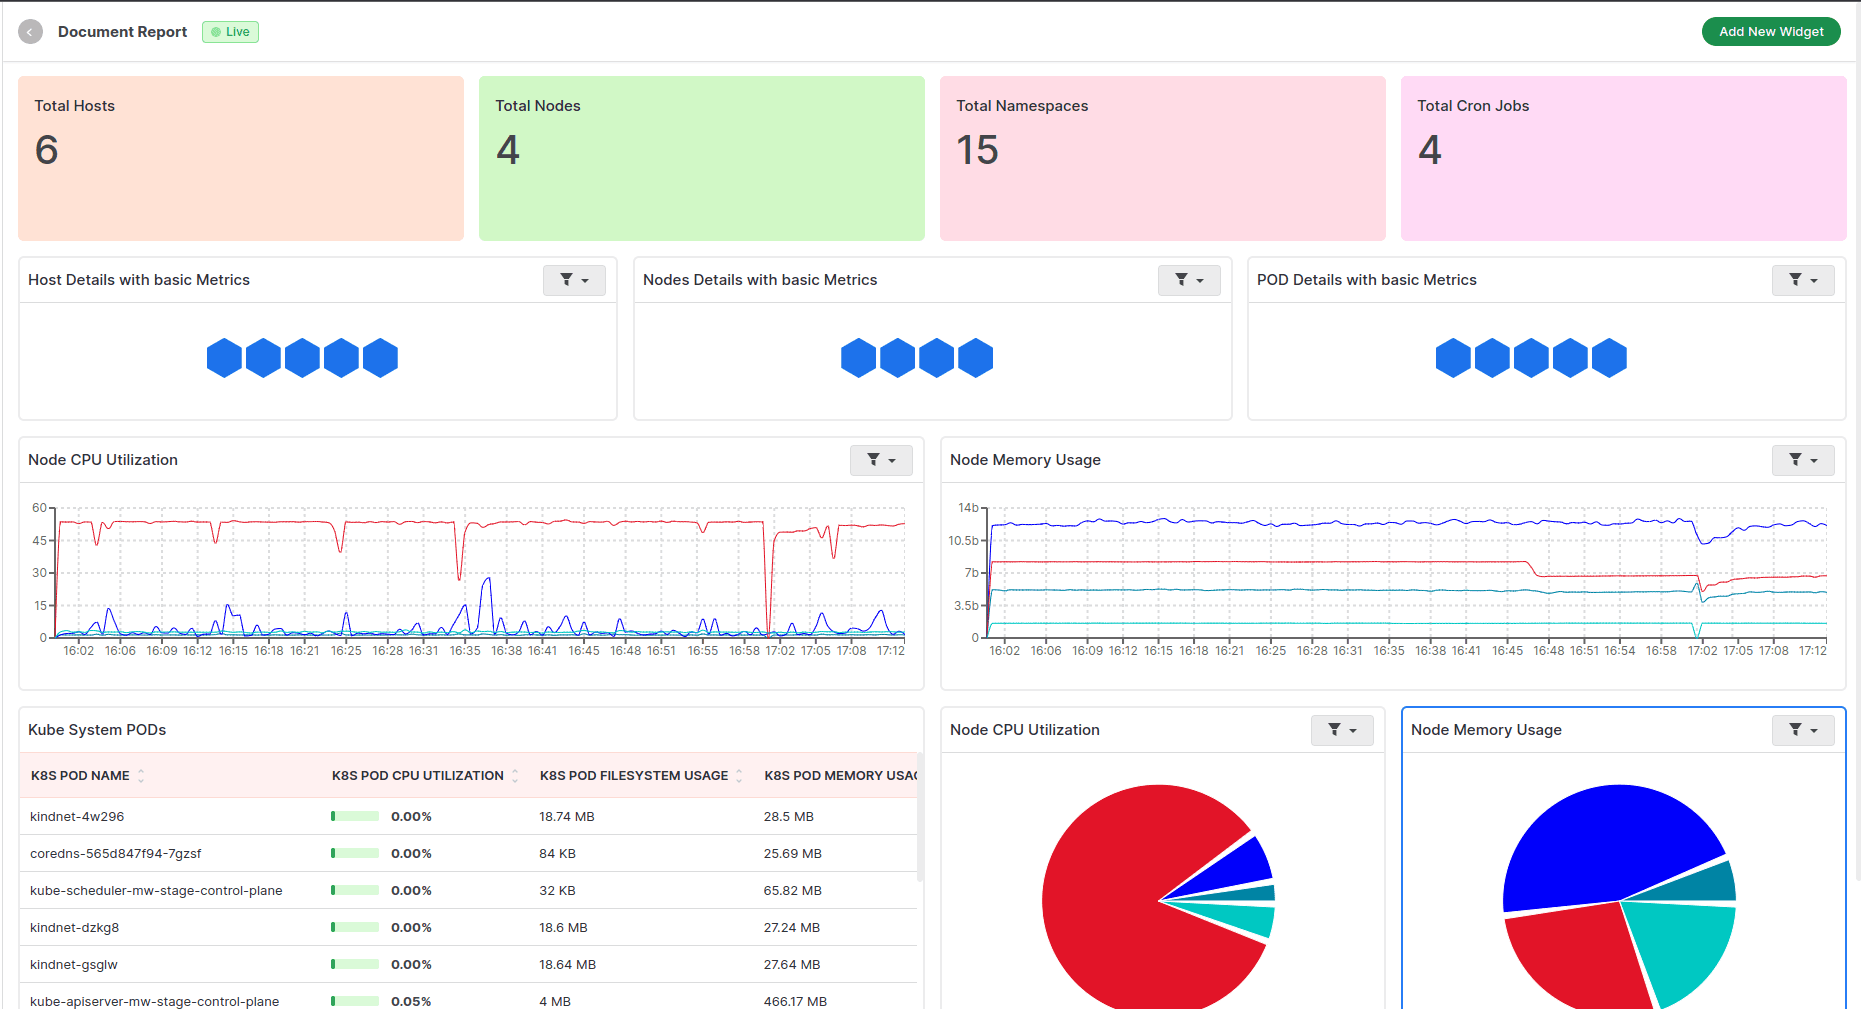
Preview and Save the Dashboard Data#
Before you make your report, you can preview the data with this option. You can see the preview at the top as per your selected data type and parameters. Once you save your widget, you can see the report as follow. You can add multiple graphs to your report by clicking “Add new widget” and arranging them by drag and drop in your report.
Need assistance or want to learn more about Middleware? Contact our support team at [email protected] or join our Slack channel.