MongoDB
MongoDB Integration - Setup & Installation Docs | Middleware
The MongoDB Integration allows you to ingest and monitor the performance and health metrics of your NoSQL database instances. This integration is useful for tracking the total number of active connections and operations executed within your instances, the total space allocated to database indexes, and the count of all document operations executed.
Prerequisites
Middleware Host Agent (MW Agent) must be installed on your local machine. To install the MW Agent, see our Installation Guide.
Setup
Step 1: Create Database Credentials
Create a .yaml file containing database credentials like the below example. If the database is not password protected, the username and password fields can be removed.
/home/ubuntu/mongodb-creds.yaml
/var/log directory. mongodb:
hosts:
- endpoint: localhost:27017
username: mongodb
password: mongodb
Step 2: Access Integrations
Log in to Middleware, navigate to the Installations Page in the bottom left corner, select All Integration and click MongoDB
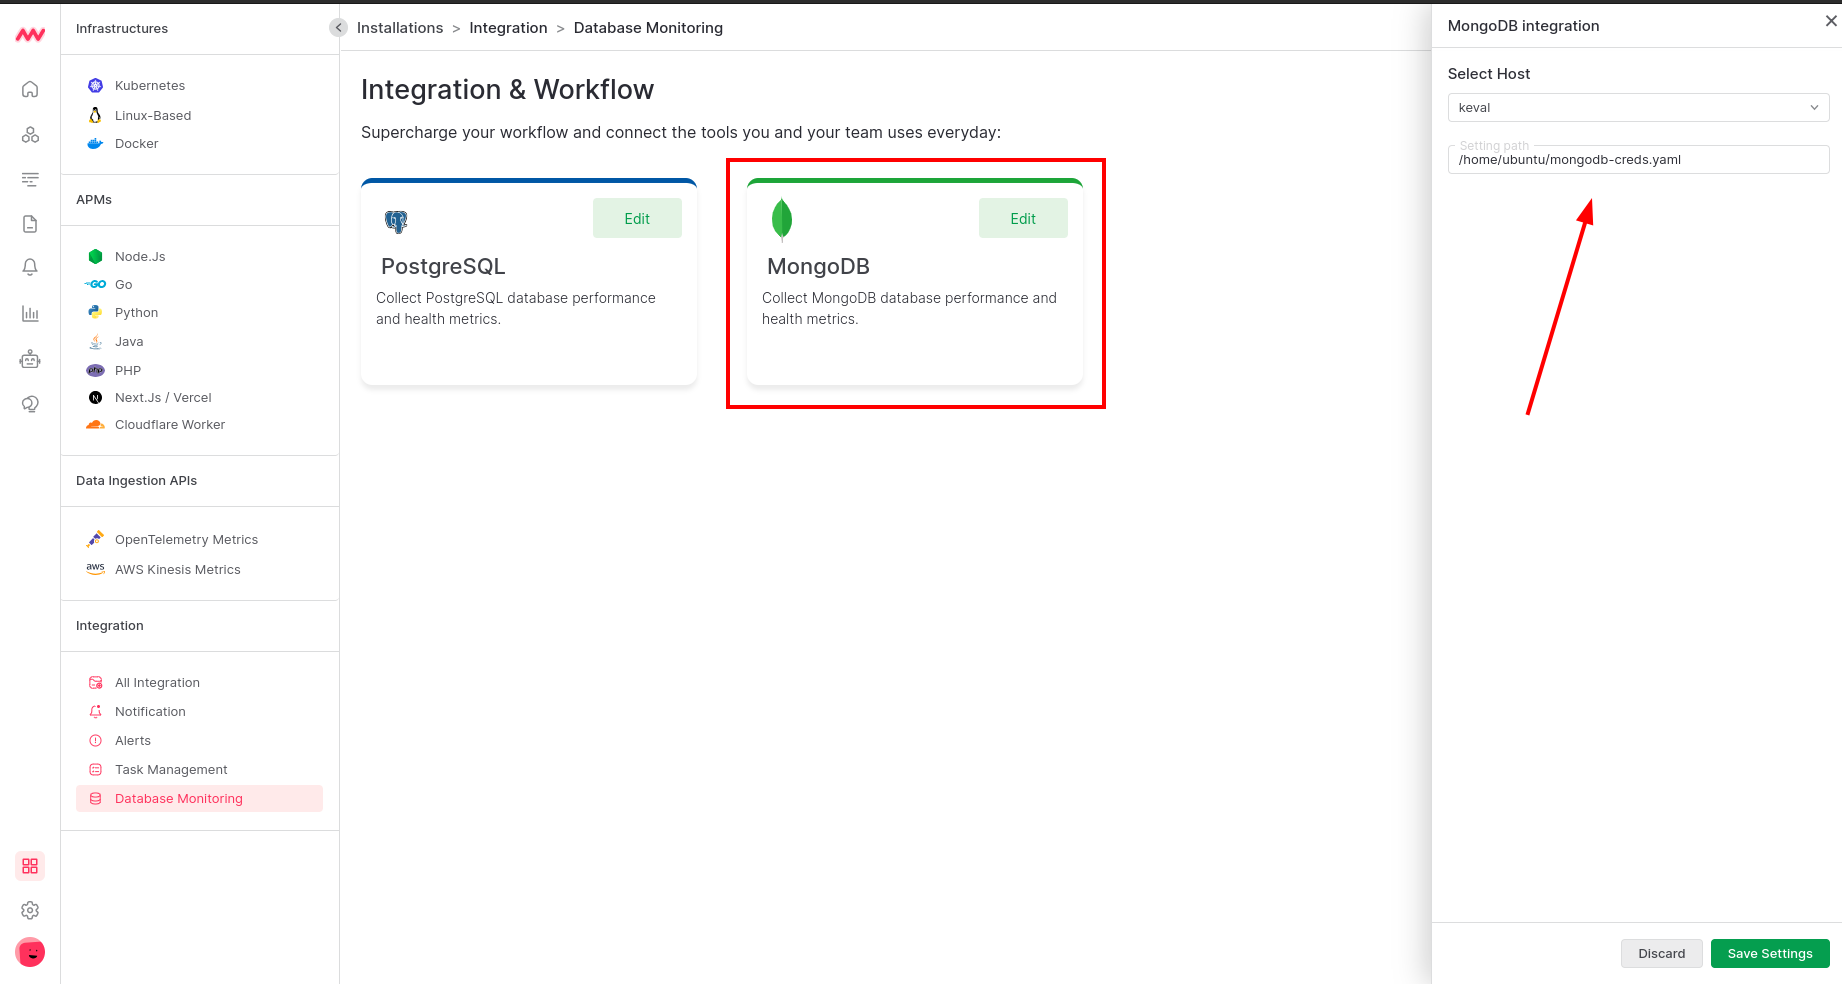
Step 3: Enable Integration
Add a host machine from the dropdown list, input the credential path from Step 1, and Save
Visualize Analytics
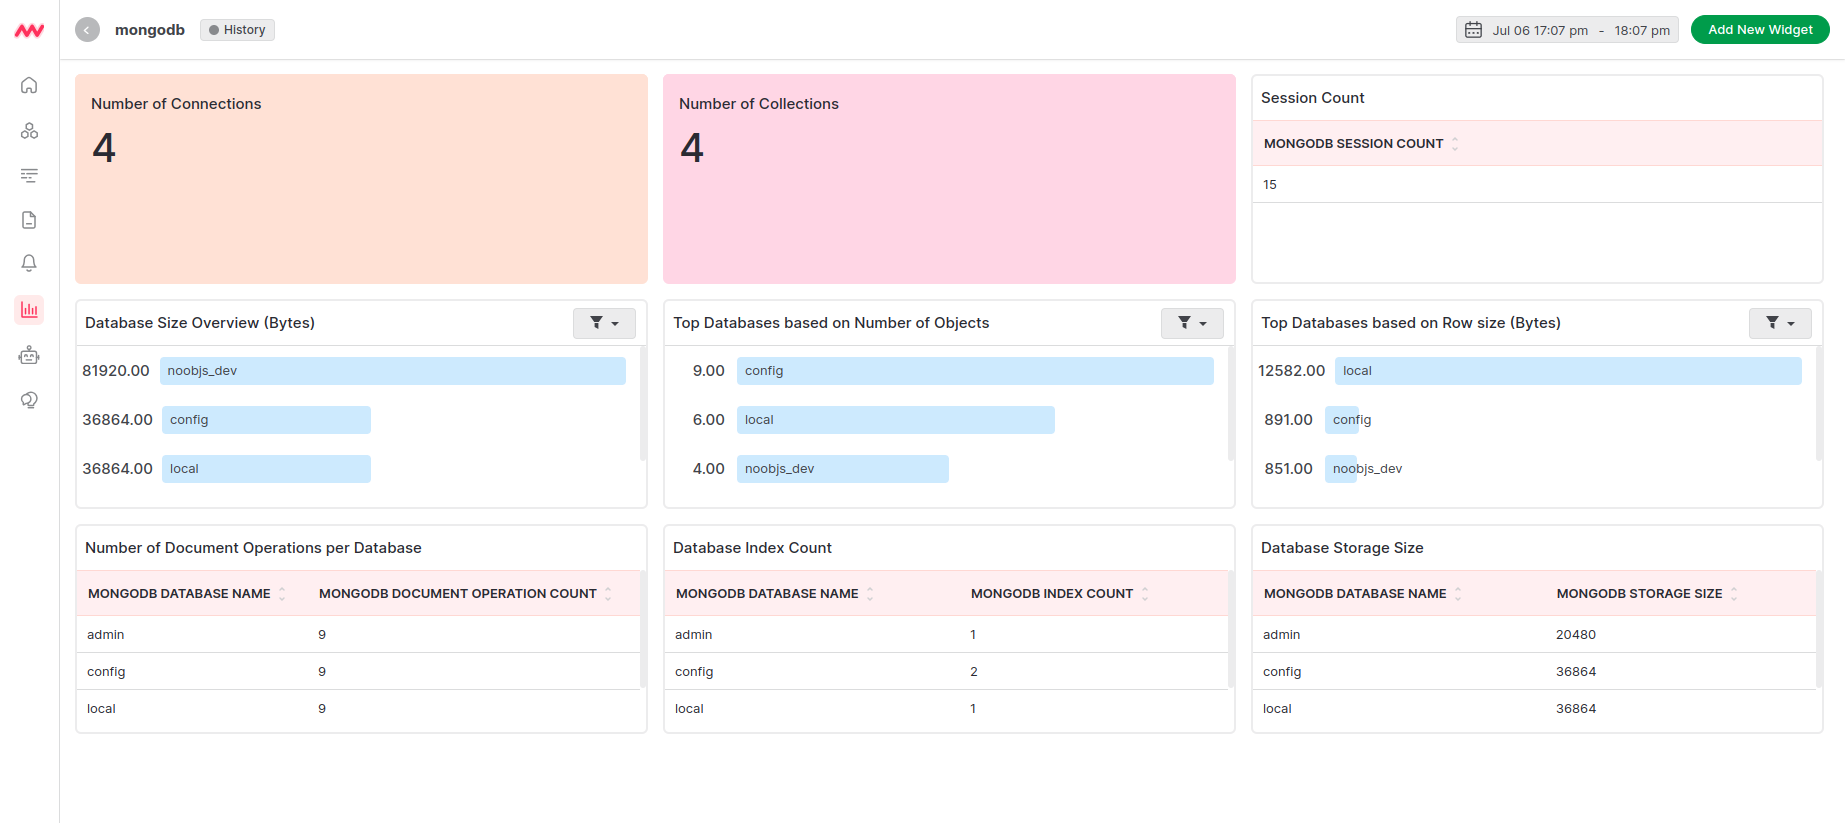
Default MongoDB Dashboard
Once the MongoDB integration setup is complete, a new MongoDB-specific dashboard will appear in the Dashboard Builder. This default dashboard serves as a jumping off point for visualizing and analyzing MongoDB data.
Create MongoDB Widget
MongoDB data can be added to dashboards as a custom widget. When adding a new widget, select the mongodb data source to view a full list of available MongoDB data.
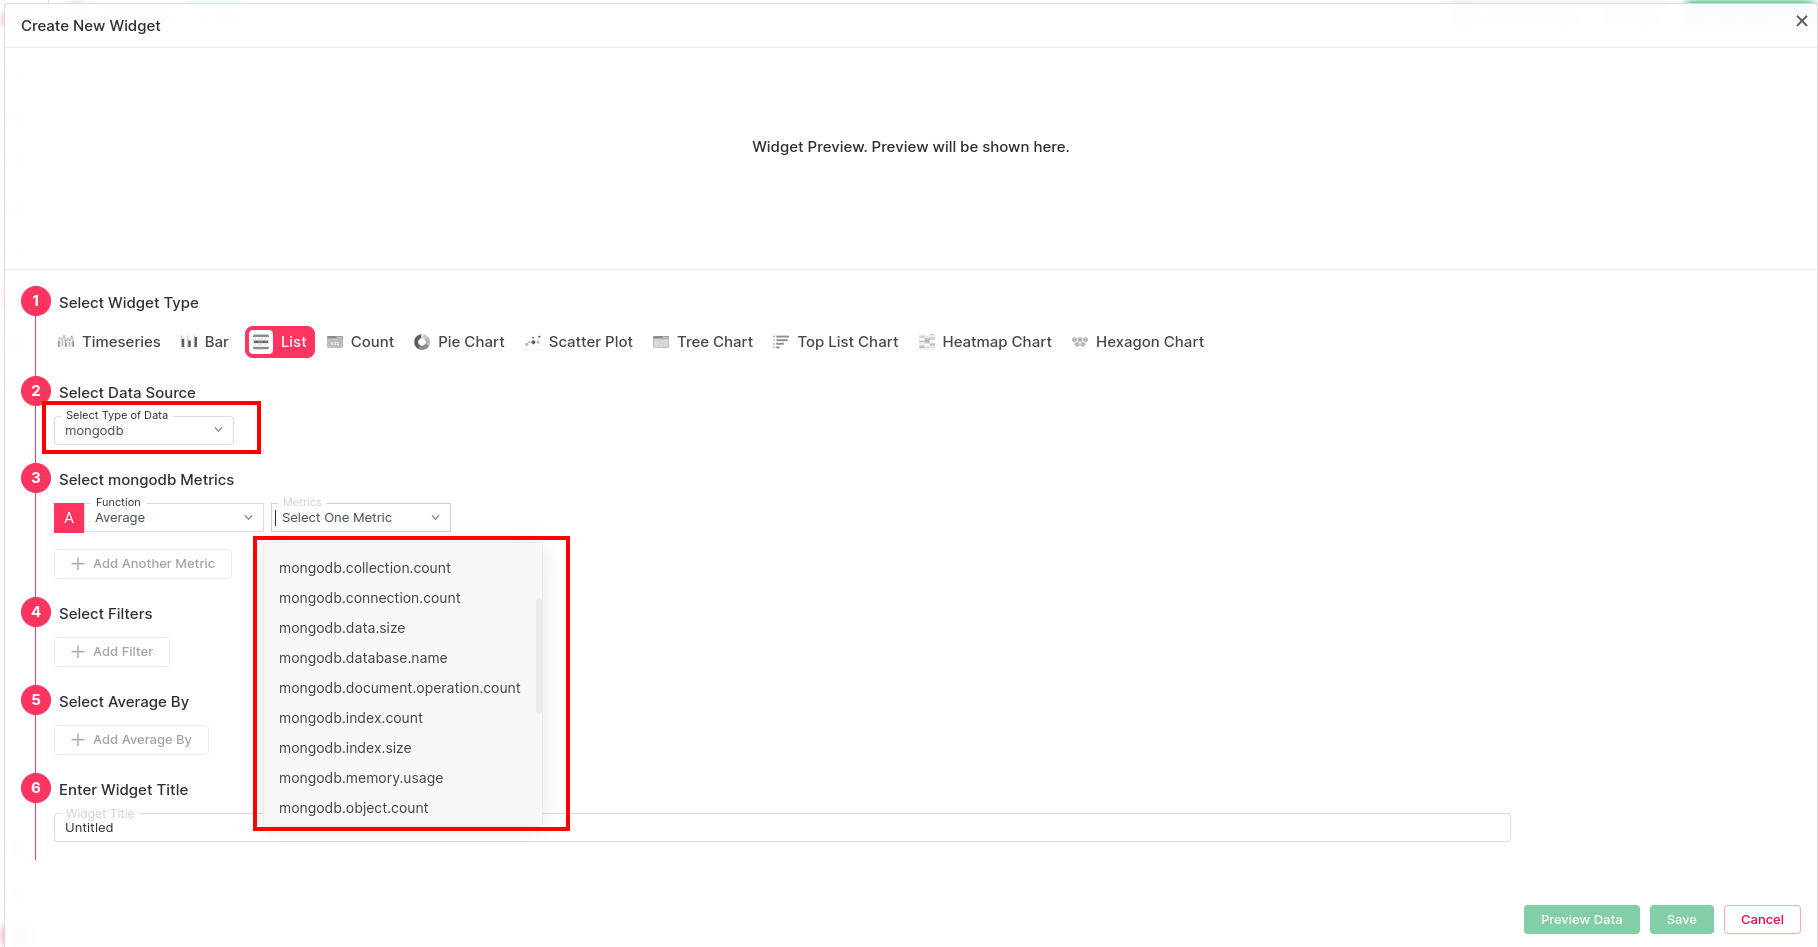
The exhaustive list for MongoDB metrics can be seen here
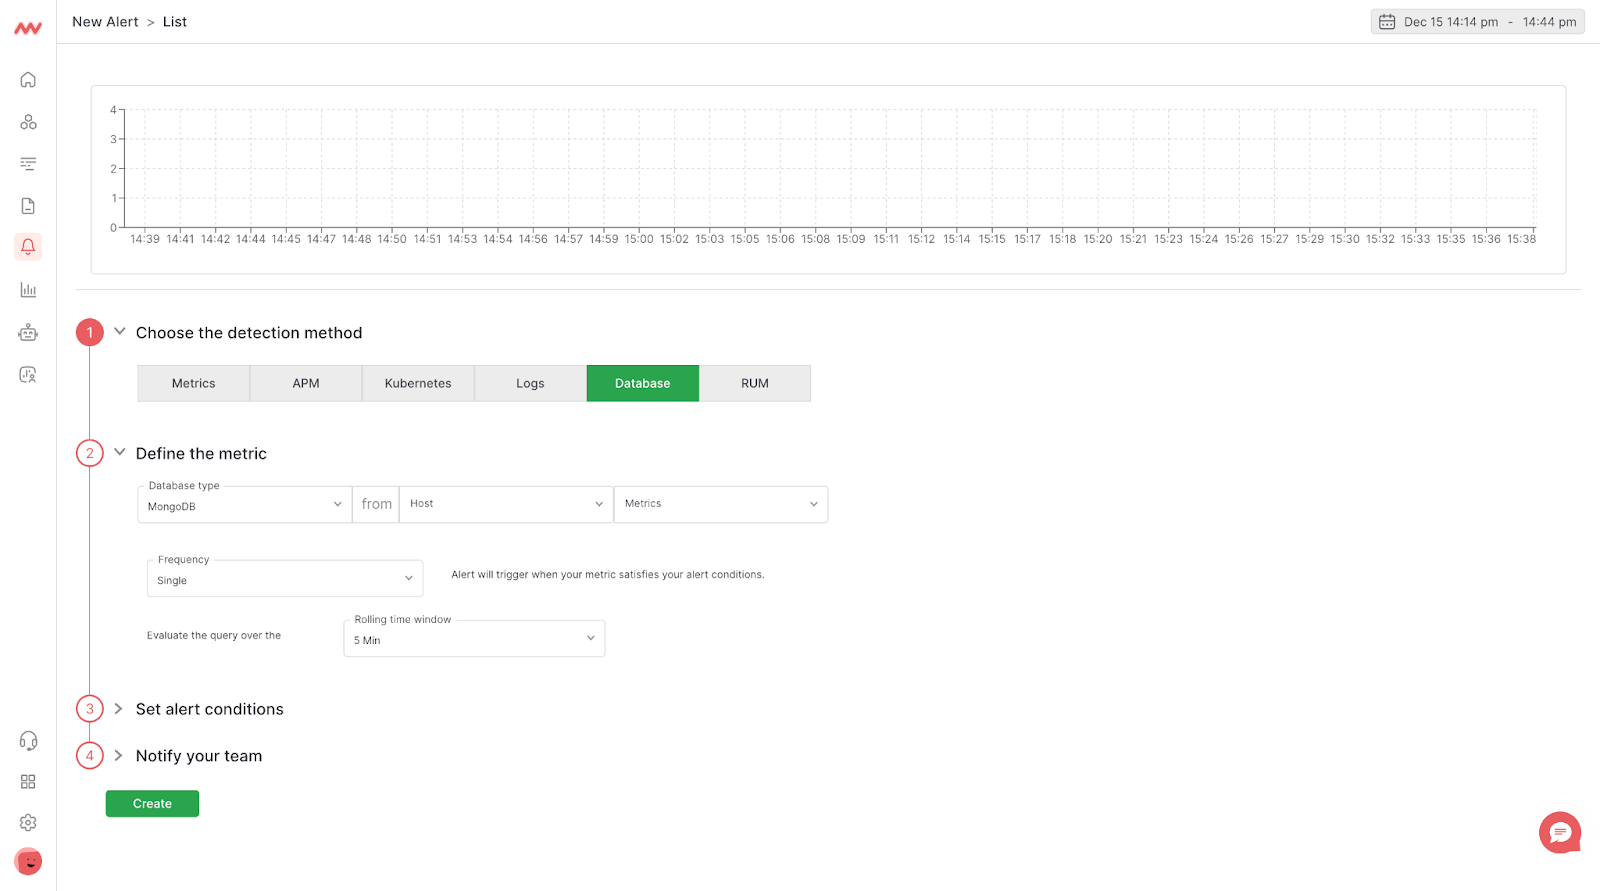
Alerts
Alerts can be configured for any MongoDB metrics. When creating a new rule select the Database detection method and MongoDB database type for available metrics to appear in the Metrics dropdown list. Select the desired metric and continue configuring the alert conditions.
Metrics Collected
| Metric | Description |
|---|---|
mongodb.cache.operations | Number of cache operations |
mongodb.collection.count | Number of collections |
mongodb.data.size | Size of the collection, data compression does not affect this value |
mongodb.connection.count | Number of connections |
mongodb.extent.count | Number of extents |
mongodb.global_lock.time | Total time the global lock has been held |
mongodb.index.count | Number of indexes |
mongodb.index.size | Total space allocated to all database indexes, including free index space |
mongodb.memory.usage | Amount of memory used |
mongodb.object.count | Number of objects |
mongodb.operation.latency.time | Total latency of operations |
mongodb.operation.count | Number of operations executed |
mongodb.operation.repl.count | Number of replicated operations executed |
mongodb.storage.size | Total amount of storage allocated to this collection |
mongodb.database.count | Number of existing databases |
mongodb.index.access.count | Number of times an index has been accessed |
mongodb.document.operation.count | Number of document operations executed |
mongodb.network.io.receive | Number of bytes received |
mongodb.network.io.transmit | Number of bytes transmitted |
mongodb.network.request.count | Number of requests received by a server |
mongodb.operation.time | Total time spent performing operations |
mongodb.session.count | Total number of active sessions |
mongodb.cursor.count | Number of opened cursors maintained for clients |
mongodb.cursor.timeout.count | Number of cursors that have timed out |
mongodb.lock.acquire.count | Number of times a lock was acquired in the specified mode |
mongodb.lock.acquire.wait_count | Number of times lock acquisitions encountered waits due to locks held in conflicting modes |
mongodb.lock.acquire.time | Cumulative wait time for the lock acquisitions. |
mongodb.lock.deadlock.count | Number of times lock acquisitions encountered deadlocks |
mongodb.health | Health status of the server |
mongodb.uptime | Amount of time the server has been running |
Troubleshooting
Next Steps
- How to Create Alerts
- Dashboard Basics & Customization
- Custom Telemetry Ingestion
- Getting Started With Real User Monitoring (RUM)
- Data Ingestion APIs
Was this page helpful?