Traces in Unified Dashboard
Overview
You can see traces of your applications in a Unified Dashboard. At the top part, you can see the summary of your Traces and at the bottom part, you can see the trace list with details.
Details of data in Traces
As per the selected timeframe in the chart, data of traces will display.
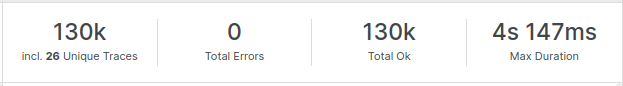
The top module is showing complete counts of
- Total Traces (incl. Unique Traces)
- Total Errors
- Total Ok
- Max Duration, to complete a trace
The down module of this section has 2 cards. These cards contain following data for a recent 1 Hour or selected interval.
- Traces Ratio
- Trace List
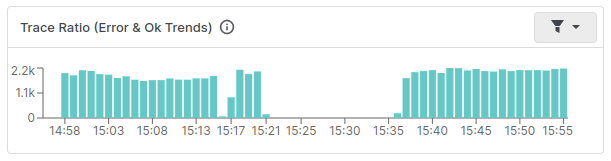
Trace Ratio
It shows the number of traces(Error & Ok) that are triggered per minute up to 1 hour in the form of a stacked-bar view. You can apply a filter over there to see only Error traces too.
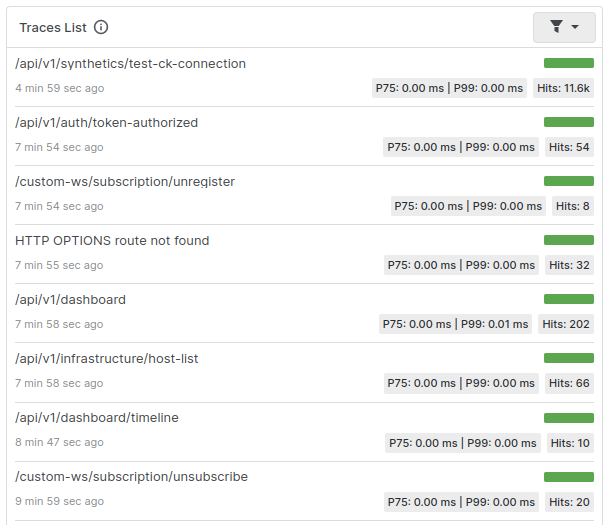
Trace List
Same as the Logs-list card, this display all the recent traces generated by the applications/machines. Each trace contains latency measurements of P75 & P99. It also shows the total hits with a progress bar, in which the Green part represents Ok & the Red part represents Error hits.
To get more details of any trace, you can click on a particular trace so it will give you detailed information on a side panel with its Proper dashboard for quick analysis, & displays the operational flow of this clicked trace. To know more about its side panel, please refer to this link.
Was this page helpful?