Unified View
Overview
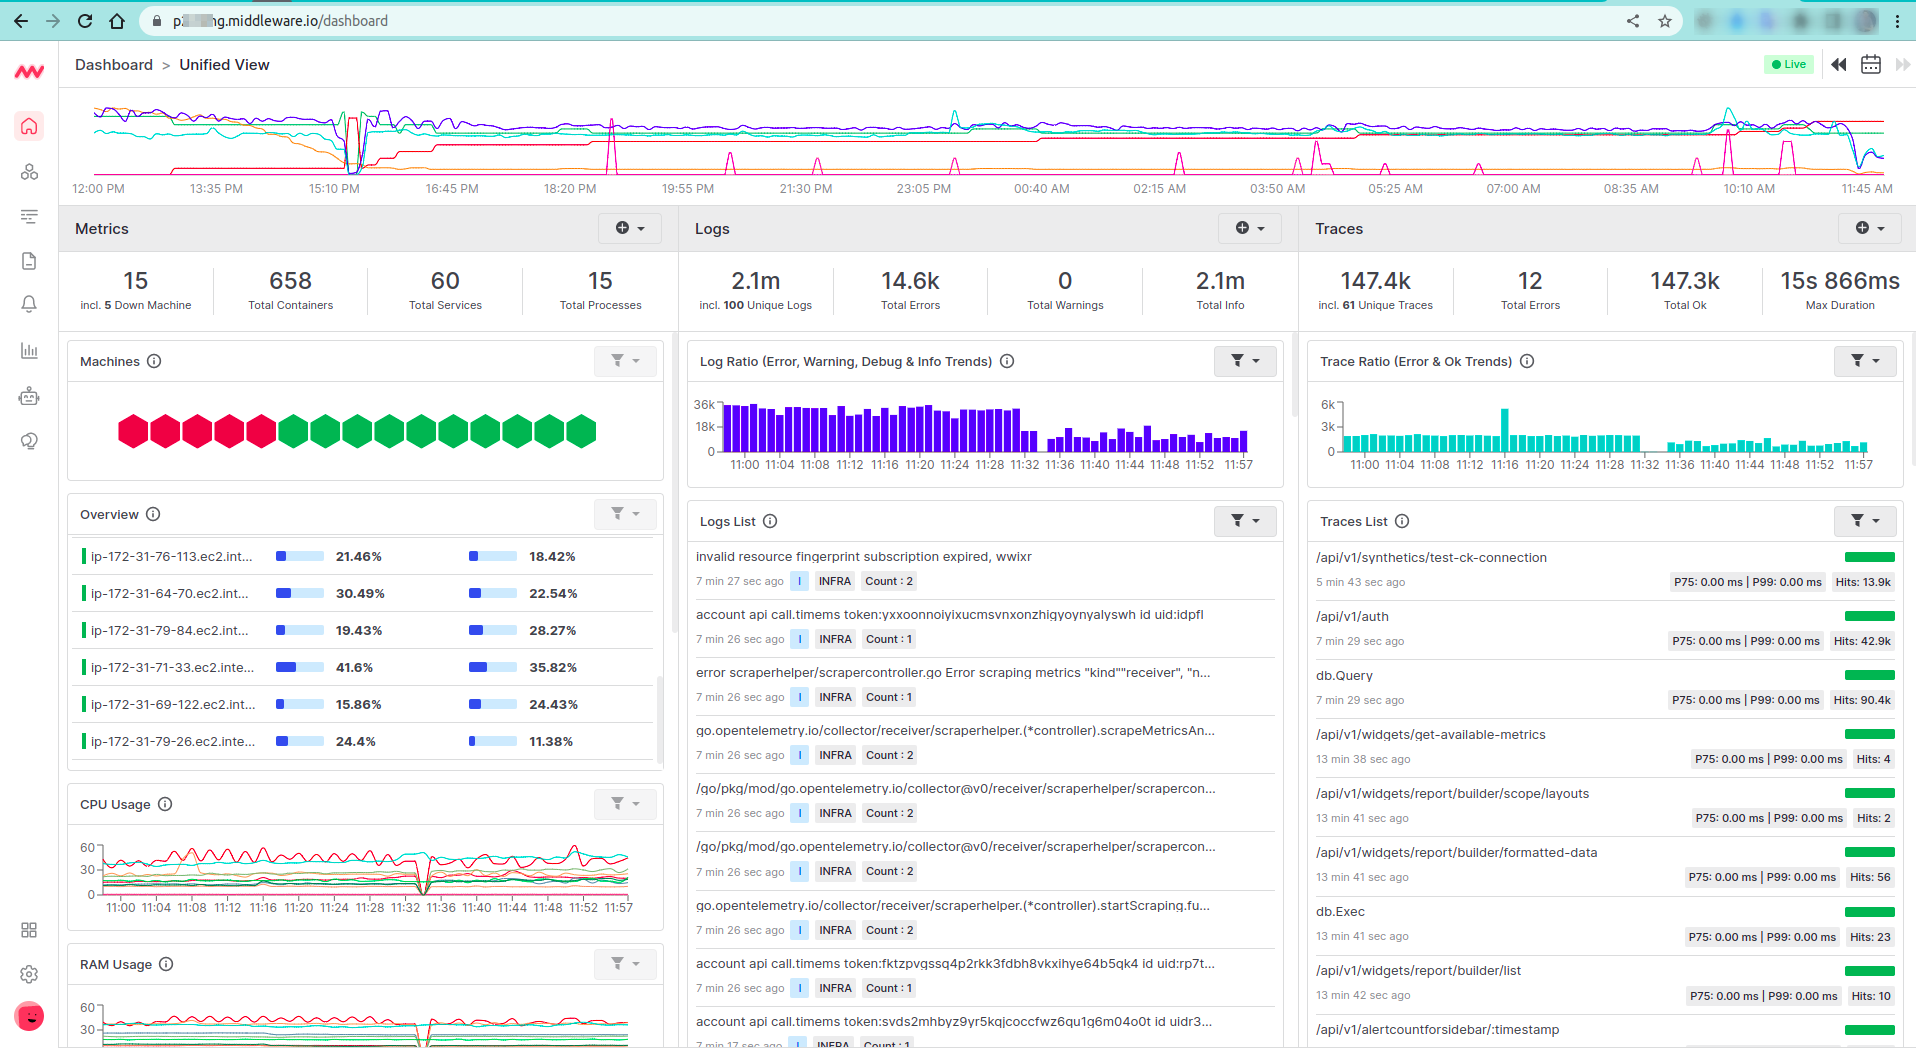
Middleware’s Unified View displays key performance metrics, logs, and traces, allowing you to continuously monitor your key server-related DevOps metrics on a real-time basis.
Why it matters
Unified View provides compact stats of your application or server (e.g. machine health, CPU & RAM usage, and every level of logs & traces) to track your app before getting crashed. There is no need to navigate from one screen to the other.
Get started with the dashboard
- Login to Middleware.
- Unified Dashboard will open as the first view of the Middleware.
Unified timeline
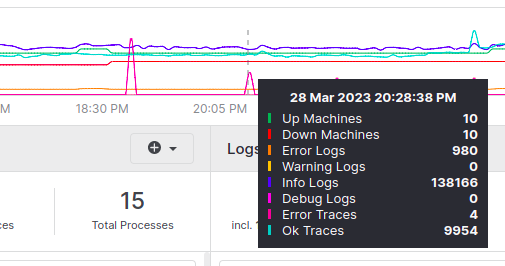
You can view live data on the timeline format with the following details
- Machine Counts (Up & Down)
- Log Counts (Error, Warning, Info & Debug)
- Trace Counts (Ok & Error)
You can also check the history stats, based on the timeline’s ups & downs that exist on the top bar. This timeline can contain data for up to 24 Hours which can be filtered using the calendar picker in the right corner.
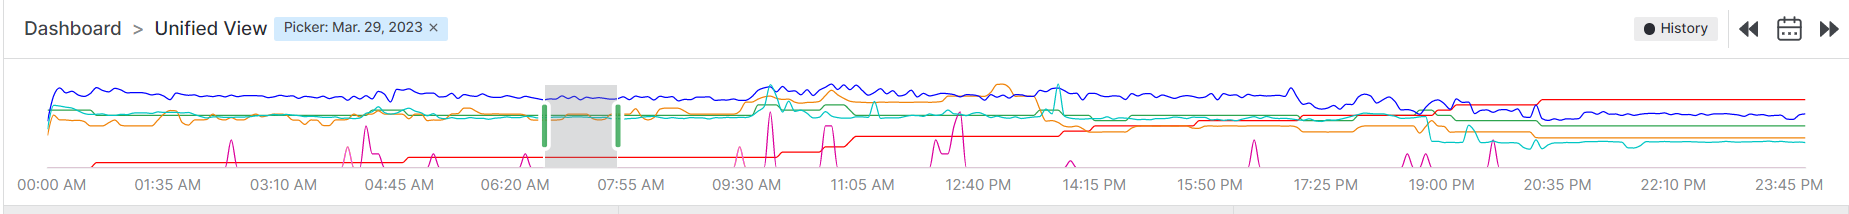
Time travel
As a default view, you will get data of last 24 hours on the timeline. However you can select any one hour time frame to see the data for that particular selected time. You can go the previous day as well, but up to a week for now. To do this you can select any previous day from the calendar icon, so the data of the Timeline bar will be changed according to that day.
Data in Unified dashboard
The Unified dashboard is divided into 3 core sections: Metrics, Logs, and Traces. Which are interlinked to a particular host or machine. In Middleware, you can see them in one frame, so you can get a better understanding that on that time what were Metrics & what were those Logs & Traces, that affected your particular machine.
Was this page helpful?