Logs in Unified Dashboard
Overview
Logs in the Unified Dashboard display both a summary and detailed description of your infrastructure and applications.
Details of data in Logs
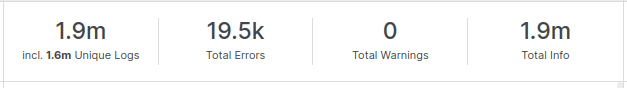
As per the selected timeframe in the chart, the following Log data will be displayed:
- Total Logs (incl. Unique logs)
- Total Errors
- Total Warning
- Total Info Logs
The down module contains 2 cards. These cards also contain the following data for a recent 1 Hour or selected interval:
- Log ratio
- Log list
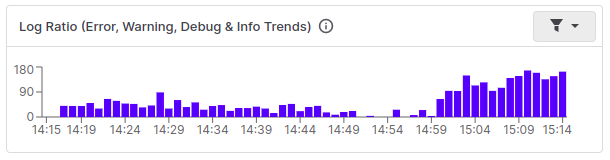
Log Ratio
The Log Ratio displays the log trends in a bar chart. You can get a complete idea of log numbers (with Errors, Warnings, Info & Debug counts) for every minute up to 1 hour. The filter feature allows you to see only the Errors or Warnings trend. This data is updated in real-time.
Log List
This card will show the recent logs as per the mode, If Live mode is on then you will see all the coming logs & If History mode is on then it will show the logs based on the selected time frame. You can modify it with available filters & you can categorize your logs based on the App & Infra filter. You can also check its triggered counts, it will be incremented format if the same log will trigger again. Each log has its own Mini-chart on the right side, that represents the counts of the same log occurrences in the last hour.
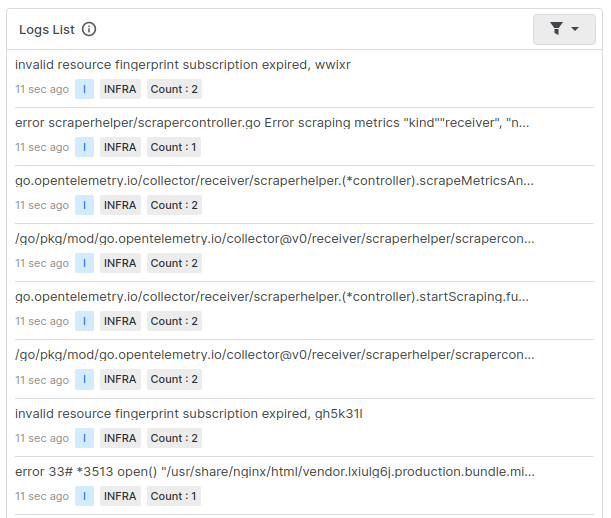
Click on any log to learn more about its Tags, Properties, Raw data, Source logs and Similar logs.
Was this page helpful?