Host
Overview
Once the Infrastructure Agent is installed, you can see all the hosts under “Host List”. This helps to visualize host performance and health.
Host List
The infrastructure host list shows all hosts monitored by Middleware. Here you can monitor your node machine on a real-time basis. The collection of host metrics data is like system health RAM, CPU, FileSystem, Memory usages, etc.
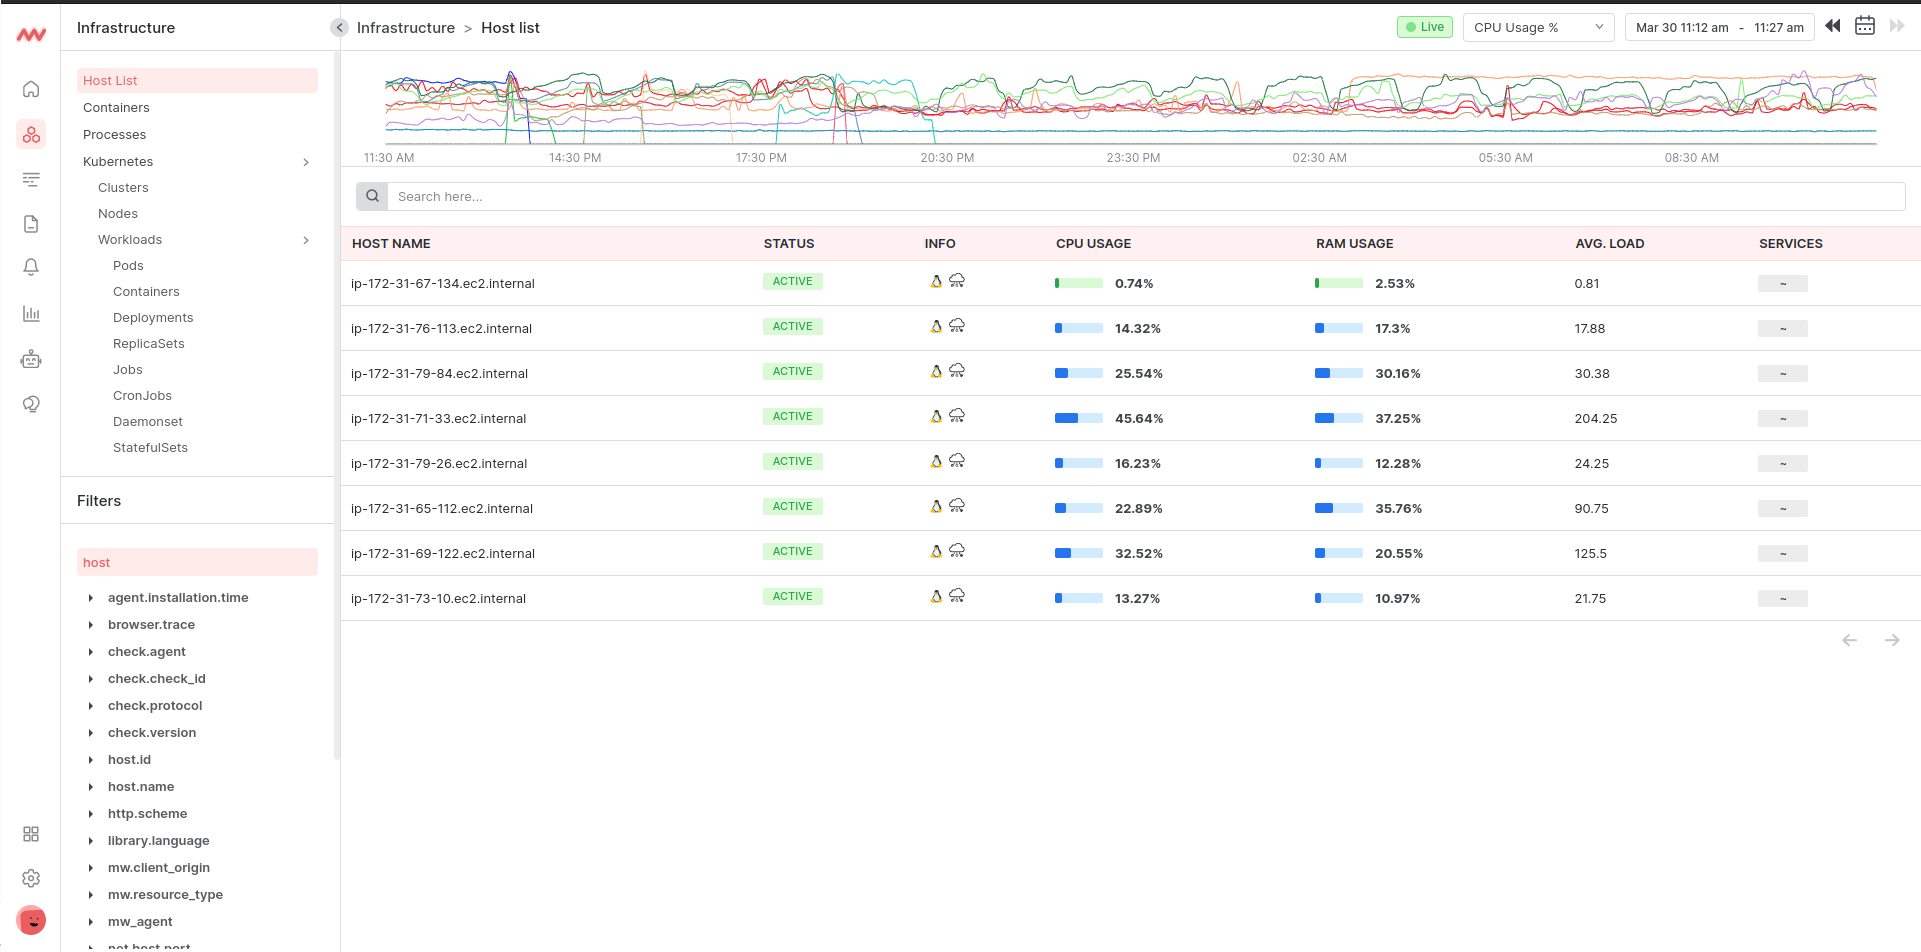
Host Name
This shows the name of your host machine. It is a unique name that identifies that system on a network.
Status
This shows if your host is currently active or inactive. If the Status is UP, then the expected metrics are being received and the host is Active. If the Status is DOWN, then there is no data being sent from the host to middleware and is currently inactive.
Info
This shows the client OS and cloud platform details.
CPU Usage
This shows the machine CPU usage as a percentage. CPU usage is calculated by adding attributes such as steal, system, user and wait state and dividing those by CPU core.
RAM Usage
This shows the machine RAM used as a percentage. RAM usage is calculated using attributes used state of system memory utilities.
Avg Load
This shows the system load over a 15-minute time frame.
Service
This is the name of the services that are running on the host.
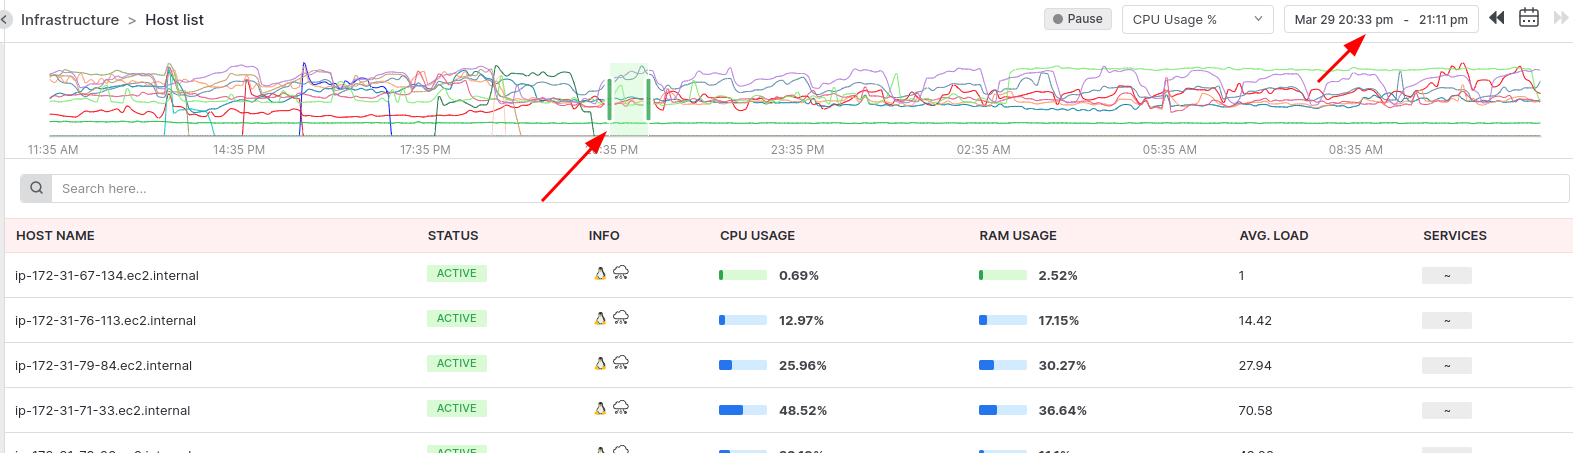
Timeline scale
The host timeline scale chart ranges from the current time to 24 hours. It shows the top 25 hosts with CPU and memory usage metrics data. Additionally, we can select a range from the timeline chart. The maximum selection limit is 1 hour and can be easily drawn at any available time basis on the x-axis scale. The selected range is shown in the date range box at the top. After selecting a scale range, the host list displays data of that range.
The primary data shown in the timeline is CPU usage. But we can choose another option of Memory usage in percent.
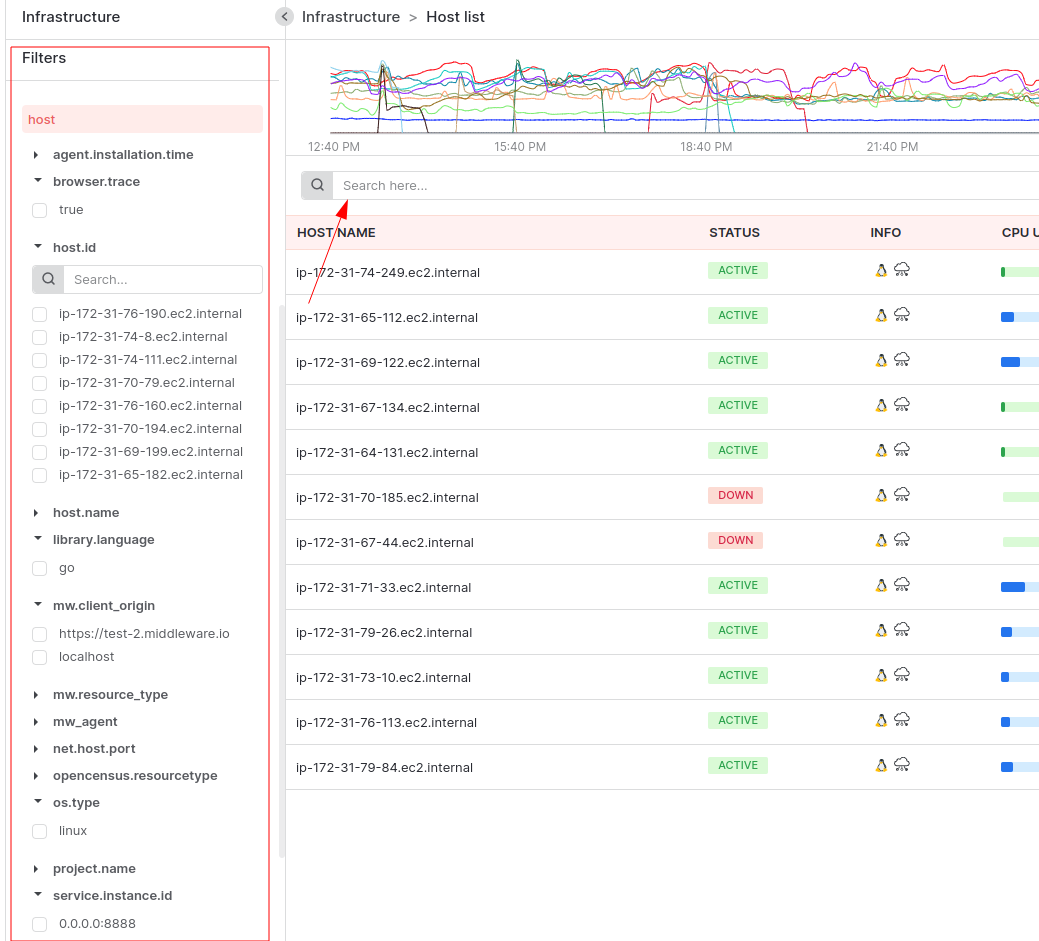
Filter
We have many options for data filters. Like selecting any date and searching host by name etc. Also in the sidebar section we also have multiple check options available to filter the host list data.
Host Detail
Click on any host to view more details, the tab view provides basic host information such as metrics, containers, and managed processes. host info will always display the latest data. You can see all the data of service, container, and process related to that host in different tabs.
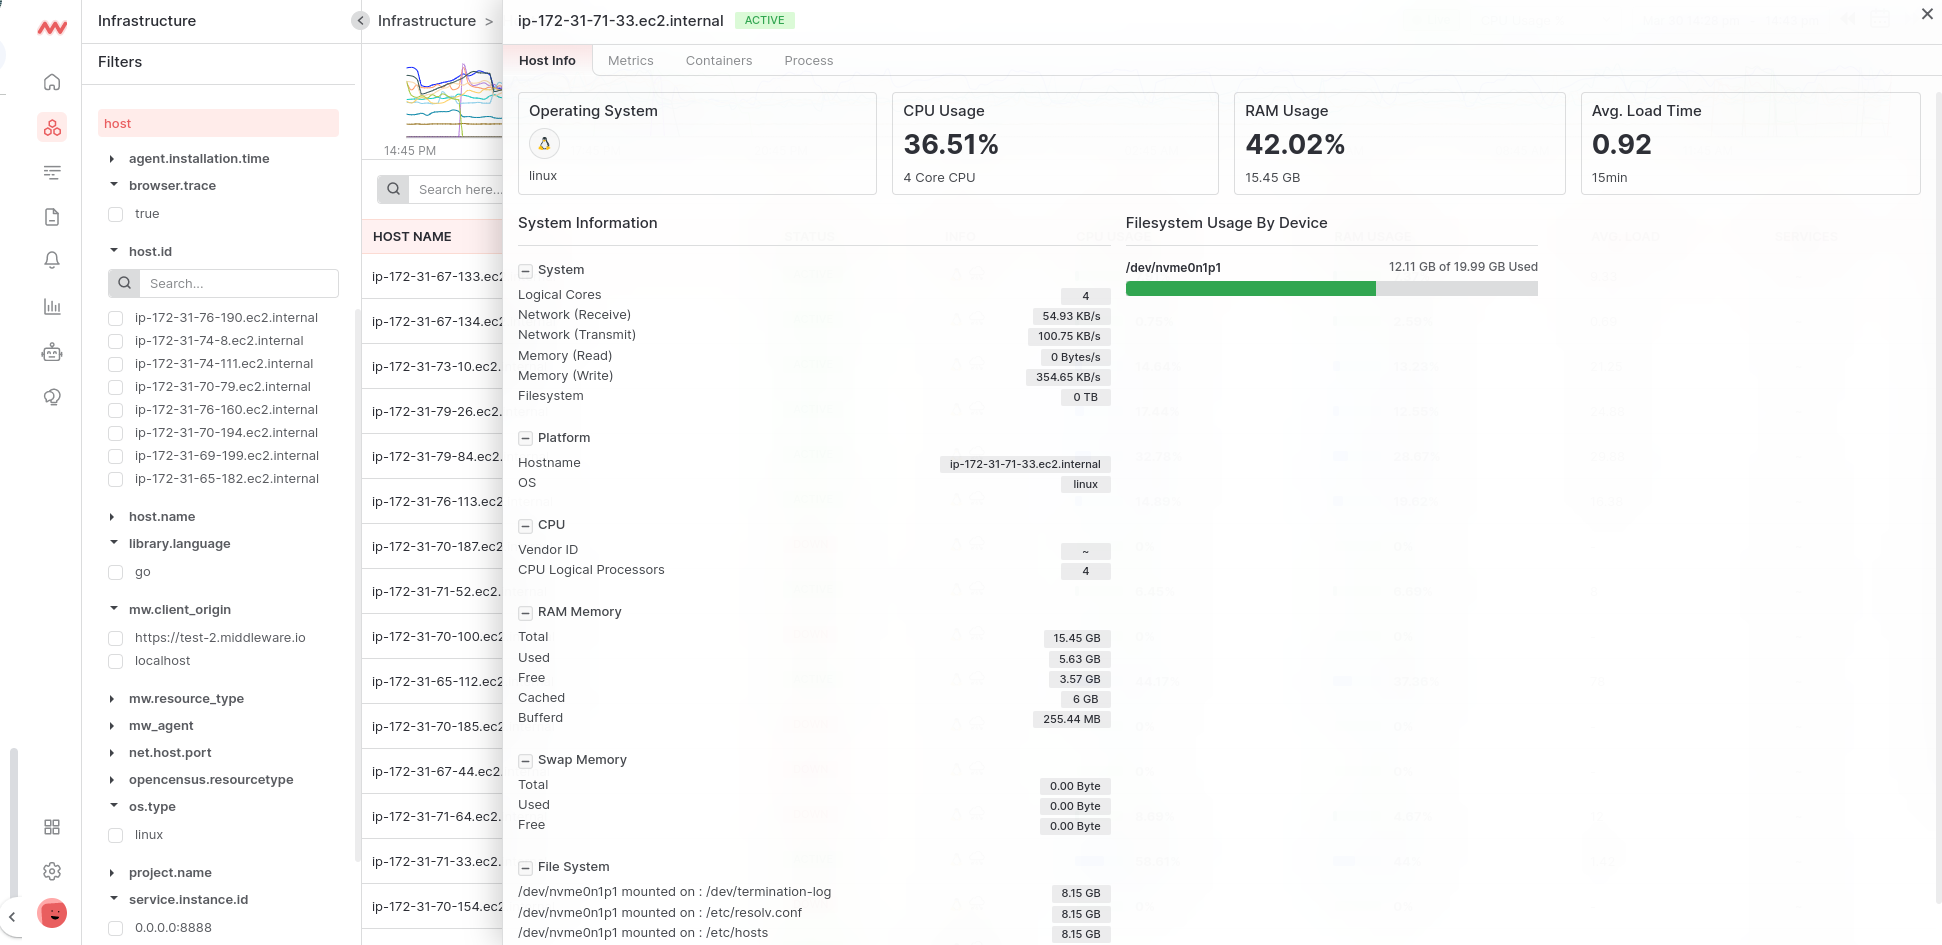
Filesystem Usage
The filesystem usage shows selected machines in the form of progress bars with their Used, Reserved & Free areas, so we can get an idea of filesystem utilization & usage in the cluster. In the below bar, Green shows Used space, Yellow shows Reserved space, and Gray shows Free space in the cluster.
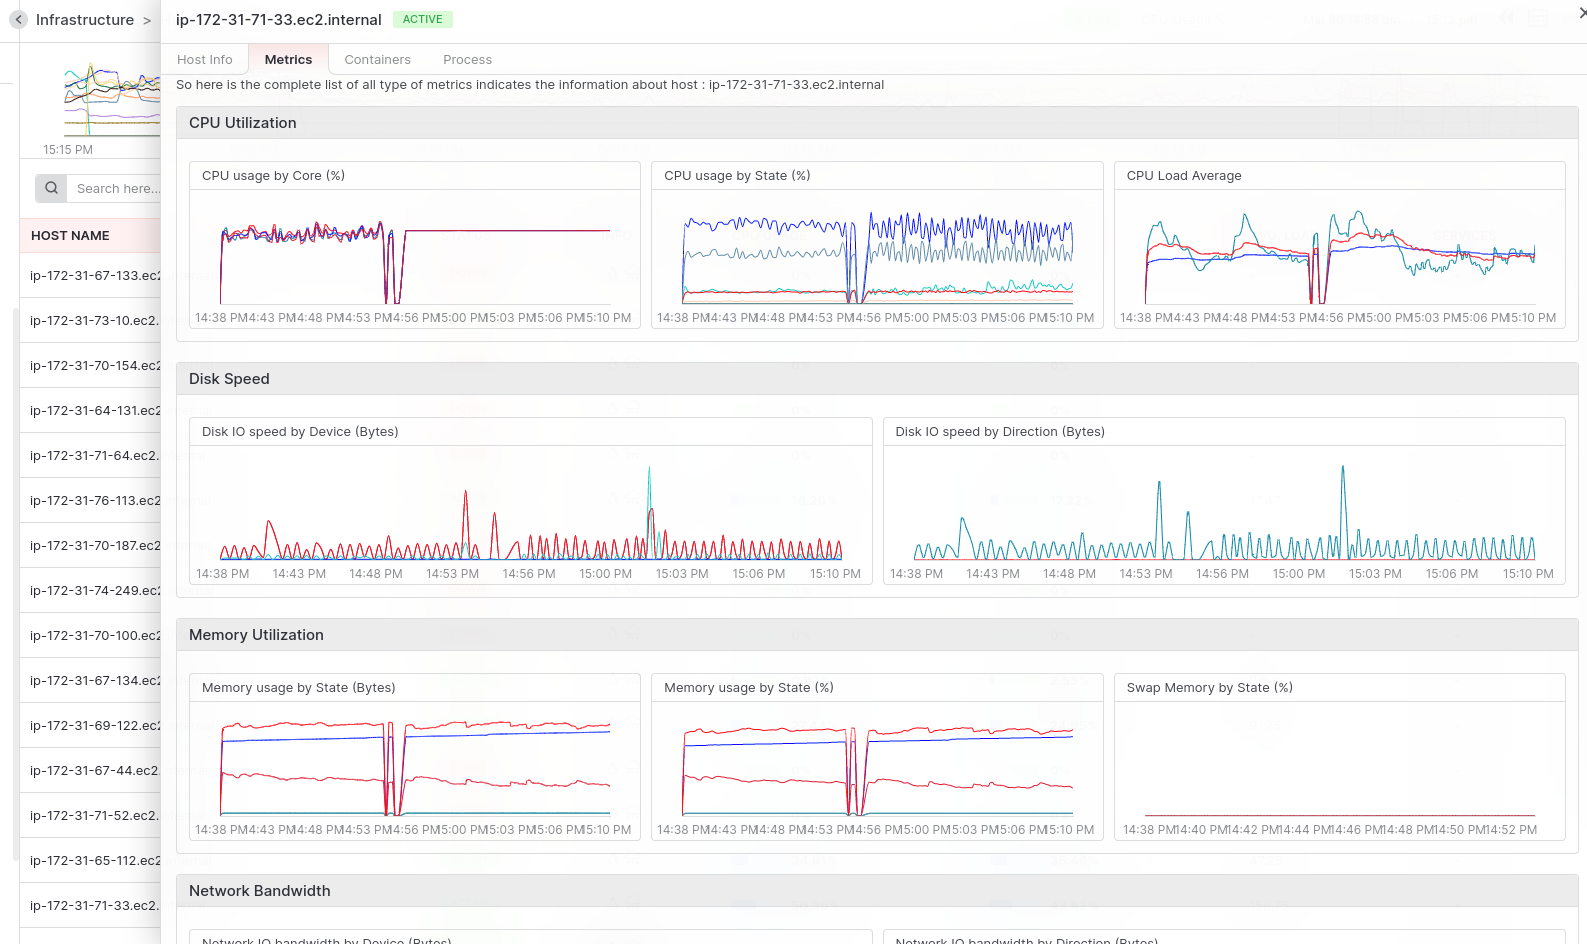
Metrics
Metrics provide an overall picture of your system’s health for the selected host. Metrics are shown in graphical visuals by averaging a nanosecond timestamp, and time series datasets are rounded to the nearest second by that same timestamp.
-
CPU Utilization: CPU utilization is a key performance metric often used to evaluate a system’s processing capabilities. CPU usage is measured by state, core, and load average time. Here we show the CPU’s three types of graphs according to state, core, and load average time. Two charts of CPU used by core & state display the value in percentage. And the other one the Load Average shows value in seconds.
-
Disk Speed: Measuring system disk I/O speed by state, and direction is an effective way to monitor. The disk I/O speed by state refers to the amount of time the system spends performing various types of I/O operations. These states can include reading and writing depending on the time spent in each state. Disk I/O speed by direction refers to the speed at which data is transferred to or from the disk. This includes both read and write speeds.
-
Memory Utilization: System memory utilization and paging usage by the state are important metrics that can help monitor the performance of a system’s memory subsystem. Memory utilization refers to the amount of memory that is currently being used by the system. This includes both physical and virtual memory. Paging usage refers to the amount of data that is being swapped between physical memory and virtual memory on the system’s storage devices.
-
Network Bandwidth: System network I/O bandwidth state by direction, and device are important metrics that can help monitor the performance of a system’s network. It can measure the amount of bandwidth used for different types of operations, such as network latency or packet loss, incoming, and web traffic, or file transfers.
Also device performance of specific networks used by adapters or switches and the bandwidth used by different network protocols. By monitoring network I/O bandwidth by state, direction, and device, it is possible to identify performance bottlenecks, optimize network configurations, and ensure that the system is running efficiently. -
Network Connection: System network connections by protocol and state refer to the monitoring of network connections between two endpoints, such as a client and a server, using specific communication protocols. It can help identify potential security issues and optimize network configurations.
-
System Network IO: System network I/O state by direction and device refers to monitoring the network input/output (I/O) operations on a system. tracking the amount of data transmitted and received over the network, as well as the direction of the traffic (incoming or outgoing) and the network device used for the communication.
-
Network Packets: The system network packets state by direction and device refers to monitoring the number of network packets transmitted and received on a system, as well as the direction of the traffic (incoming or outgoing) and the network device used for the communication.
Was this page helpful?